Histopathological examination has inherent sampling errors including incorrect sampling site, heterogeneity in tissue sampling, tumour grade heterogeneity within the sampled tissue hence, emphasizing the role of imaging in tumour grading.
Conventional Magnetic Resonance Imaging (MRI) sequences provide excellent soft tissue resolution which enhanced by contrast studies can help to differentiate grades of glial tumours. Nonetheless sensitivity, specificity of conventional MRI remains limited in categorizing tumour types, grades [5].
MRS provides information about the internal biochemical mileu of the tumour complimenting anatomic details provided by conventional MRI. We have tried to evaluate the differences in biochemical constitutes and hence, accuracy of MRS in grading of glial brain tumours. N-Acetyl Aspartate (NAA) is a marker of neuronal integrity, choline (Cho) a marker of cell membrane breakdown and turnover while creatinine (Cr) being a marker of metabolism. So, as aggression of tumour cells increases, we would expect a reduction in NAA, Cr levels and rise in Cho levels.
DWI assesses brownian motion of protons in a mileu. It is simple to understand that in solid parts of tumours, increase in cellular density will be inversely related to free motion of protons. Precedent studies have evaluated role of diffusion imaging in grading of glial tumours [16].
Owing to variance in prognosis and treatment planning, it is imperative to diagnose tumour grade of cerebral tumours preoperatively. This study aims to evaluate validity of MRI using newer techniques (MRS and DWI) to achieve this goal non invasively.
Materials and Methods
This prospective study was conducted over 16 months from April 2015 to August 2016 at Teerthankar Mahavir Medical College, Moradabad after obtaining necessary approvals from Institutional Ethical Committee and written informed consent from all participants. A total number of 50 patients including 29 males and 21 females were included in this study. Mean age of study group was 43 years. 10 patients were excluded due to unavailability/ inadequacy of histopatholgical findings. Histopathological diagnosis was obtained from biopsy or surgical resection specimens classified according to modified Ringertz’s three-tier classification of gliomas as Grade 1: Low Grade Gliomas (LGG), Grade 2: Anaplastic astrocytomas (AA) and Grade 3: Glioblastoma multiforme (GBM) [17]. Out of 40, 19 patients had histologically confirmed GBM, 12 patients had Anaplastic Astrocytomas (AA) while remaining nine had LGG. No extra costs were involved in this study as patients coming for contrast MRI of brain were included and their pathological; neurosurgical reports were obtained from respective departments.
MRI Examination
MRI examinations were conducted on 1.5 T system (Magnetom Avanto, Siemens, Erlangen, Germany) in supine position using standard circularly polarized head coil. Conventional T1, T2, FLAIR images were obtained with TR/ TE being 2500/ 44,5000/ 99, 9000/99 respectively. Matrix size of 128x128, slice thickness 5.0 mm, 1.5 mm gap, flip angle 140, voxel size 0.7 mm x 0.7 mm x 5.0 mm was used. Postcontrast (Gadolinium- DTPA) images were obtained using multiplanar T1 FS (TR/TE 1970/44; Slice thickness 5 mm with 2 mm gap) and 3D MPRAGE (TR/TE 1890/5.6; Slice thickness 1 mm with 0.5 mm gap) sequences.
Multivoxel MRS was done using intermediate TE 2D chemical shift imaging with TR 1690, TE 135 ms, flip angle 90, band width 1000 Hz, vector size 1024, voxel size 11.4 mm x11.4 mm x15 mm. Total scanning time was 6 minute, 5 second. Spectroscopy imaging was done postcontrast and good quality spectra from contrast enhancing/solid parts of lesions only were included in this study. Necrotic, cystic, haemorrhagic areas were avoided while placing the voxel and also care was taken not to include normal brain tissue or surrounding bones.
DWI was done using 2D echoplanar imaging. Images were obtained at three b values 0,500,1000 in x, y, z direction. TR/TE was 4100/89. Slice thickness was 4.5 mm with gap of 1.6 mm. FOV was 230 mm. Voxel size was 1.2 mm x 1.2 mm x 4.5 mm. SNR of 1 was obtained. Necrotic/ haemorrhagic/ cystic areas were carefully avoided when sampling ROI. Post processing was done by automated software. Apparent diffusion coefficient (ADC) values were taken from three solid/ contrast enhancing locations within the mass. An average of the three readings was taken as final value.
Spectroscopic Analysis
Metabolites examined included NAA at 2.02 ppm, Cr at 3.0 ppm, Cho at 3.2 ppm. Sum of lipid lactate peak was defined at 0.9-1.3 ppm. Standard commercial software provided following ratios: Cho: NAA, Cho: Cr.
Statistical Analysis
Mean, Standard Deviation (SD) was calculated using commercial statistical software MEDCAL. Significance of difference between mean values across groups was evaluated using two tailed Pearson test. Taking mean as cut off values, sensitivity, specificity, PPV, NPV was estimated by statistical analysis using MEDCAL statistical software package.
Results
Diffusion Imaging: Lowest ADC values were seen in GBM [Table/Fig-1,2 and 3] cases while these were highest in LGG. Mean values taken as thresholds provided sensitivity, specificity, accuracy of 72.3%, 60%, 58.6% respectively [Table/Fig-4].
Showing range, mean values of DWI, MRS parameters (n=40).
| Varibles | LGG (n=9) Range mean+SD | AA (n=12) Range mean+SD | GBM (n=19) Range mean+SD |
|---|
| Diffusion Imaging |
| ADC | 0.86- 1.4x10⁻³ mm2/s | 1.05+ 0.18x 10⁻³ mm2/s | 0.74- 1.02x 10⁻³ mm2/s | 0.87+ 0.1x10⁻³ mm2/s | 0.52- 0.91x 10⁻³ mm2/s | 0.72+ 0.12x 10⁻³ mm2/s |
| MRS |
| Cho:NAA | 1.2-5.6 | 2.68+ 1.74 | 2.9-8.8 | 5.8+2.1 | 4.8-13.2 | 8.17+ 2.4 |
| Cho:Cr | 1.1-3.8 | 2.24+ 0.91 | 2.8-5.2 | 4.15+ 0.76 | 3.9-8.8 | 6.66+ 1.43 |
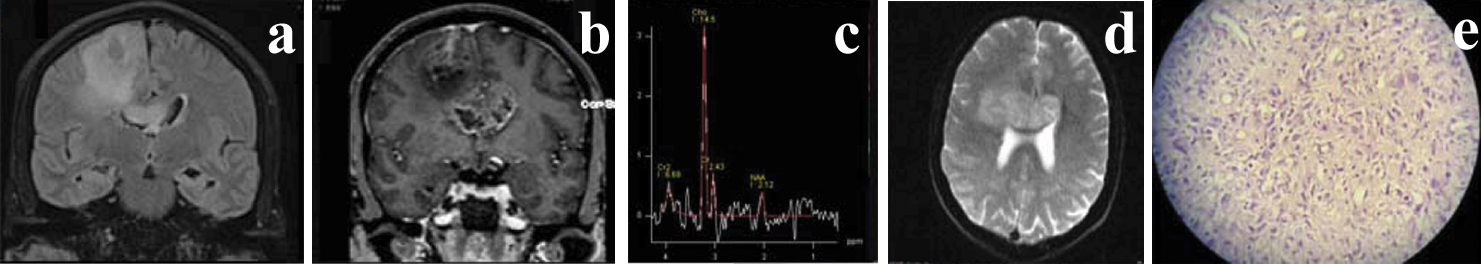
Showing Coronal FLAIR (a), coronal postcontrast T1 MP-RAGE (b), MRS (c), ADC image (d) Histopathological image (e) Grade IV GBM in 45-year-old male.
Axial T2 (a), Axial postcontrast T1 MP-RAGE (b), ADC (c), MRS (d) Histopathology image (e) Grade IV GBM in 12-year-old male.
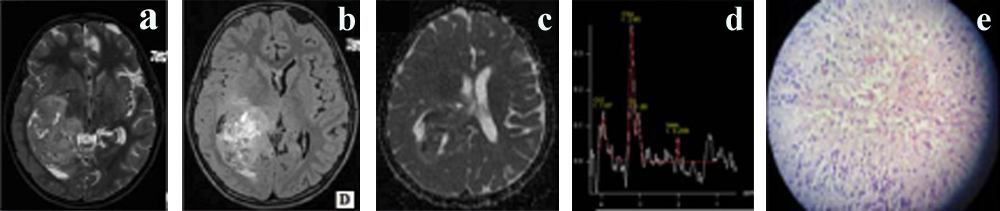
Table comparing diagnostic accuracy of DWI and MRS parameters.
| Variables | PPV (%) | NPV (%) | Sensitivity (%) | Specificity (%) | Accuracy (%) |
|---|
| ADC | 66.38 | 68.41 | 72.3 | 60 | 58.6 |
| Cho:NAA | 83 | 79.39 | 78.2 | 84 | 82.2 |
| Cho:Cr | 80.18 | 73.61 | 70.4 | 82.6 | 80 |
| MRS | 85.25 | 81.01 | 79.8 | 86.2 | 83 |
| MRS+DWI | 89.60 | 85.25 | 84.4 | 90.2 | 88.4 |
ADC: Apparent Diffusion Coefficient, Cho: Choline, NAA: N-Acetyl Aspartate, Cr: creatinine, MRS: Magnetic resonance spectroscopy, DWI: Diffusion Weighted Imaging, PPV: Positive predictive value, NPV: Negative predictive value
MR Spectroscopy: Cho: NAA as well as Cho:Cr ratio was significantly higher in GBM [Table/Fig-1,2 and 3] followed by AA and LGG. Sensitivity, specificity and accuracy was 78.2%, 84% and 82.2% respectively for Cho:NAA ratio while Cho: Cr ratio showed sensitivity, specificity and accuracy being 70.4%, 82.6% and 80% respectively [Table/Fig-4].
Clubbing both ratios evaluated in MRS, sensitivity specificity accuracy of 79.8%, 86.2% and 83% respectively was obtained [Table/Fig-4].
MRS and DWI used together provided 84.4 % sensitivity, 90.2% specificity and 88.4% accuracy. [Table/Fig-4].
Two tailed Pearson test showed statistical significance at p-value<0.05 for ADC values as well as Cho: NAA, Cho: Cr ratios.
Discussion
This study could find MRS as well as DWI to be useful in preoperative non invasive grading of glial tumours.
Diffusion Imaging
Statistically significant differences were seen in ADC values across tumour grades in present study. Results similar to our study were shown by Kono K et al., [18]. Their study found significantly higher ADC values in Grade II astrocytomas (1.14+0.18x 10 –3 mm 2/s) than in glioblastomas (0.82+0.13x 10 –3 mm 2/s). Bulakbasi N et al., showed significant differences in ADC values in low and high grade tumours [19]. Kralik SF et al., also found ADC maps useful in differentiating high grade versus low grade supratentorial tumours in first year of life [20]. Server A et al., found PPV, NPV, sensitivity and specificity of 79.7%, 60%, 88.7% and 42% with ADC cut off value 1.07 in differentiating high and low grade tumours [21]. Significant difference was shown by Liu ZL et al., amongst ADC values in low and high grade gliomas [7]. Their study reported sensitivity, specificity, PPV and NPV of 86.36%, 90%, 95% and 75% with threshold value of 2.01 for Cho/Cr ratio.
MRS
In this study, PPV, NPV, sensitivity, specificity were 83%, 79.4%, 78.2%, 84% and 80.2%, 73.6%, 70.4%, 82.6% with Cho: NAA and Cho: Cr ratios respectively [Table/Fig-4]. In agreement with our findings, Server A et al., estimated sensitivity, specificity, PPV and NPV to be 83.3%, 85.1%, 41.7%, 97% and 100%, 57.4%, 23.1%, 100% with Cho/Cr ratio cut off 1.35 and Cho/NAA cut off value 1.78 respectively [21]. Zeng Q et al a [11] demonstrated a threshold value of 2.04 for Cho/Cr ratio to provide sensitivity, specificity, PPV and NPV of 84.00%, 83.33%, 91.30% and 71.43%, respectively. Threshold value of 2.20 for Cho/NAA ratio resulted in sensitivity, specificity, PPV and NPV of 88.00%, 66.67%, 84.62% and 72.73%, respectively. Naser RKA et al., found sensitivity, specificity, accuracy of 72.7%, 90.9%, 81.8% respectively at Cho/NAA cut off value of 12.2, 80%, 91.7%, 86.4% with Cho+Cr /NAA cut off value 17 and 61.5%, 88.9%, 72.7% at Cho/Cr cut off value 9.2 [14]. Nelson SJ, Kousi E et al., also found MRS useful in discriminating tumour grades of primary cerebral tumours [5,6]. Liu ZL et al., found Cho/ Cr and Cho/NAA ratios significantly higher in high grade gliomas versus LGG [7]. Law M et al., found sensitivity, specificity, PPV, NPV of 97.5%,12.5%,77% and 62.5 % respectively with threshold of 1.08 for Cho:Cr ratio [10]. Hsu YY et al., found Cho/Cr, Cho/NAA ratios significantly higher and NAA/Cr ratio significantly lower with increasing glioma grade [12].
However, variance in cut off values of ADC, metabolite ratios in our and other studies and overlap in values across tumour grades are noted which can be attributed to variance in techniques adopted, tumour heterogeneity, voxel size, voxel placement.
Limitation
We have chosen intermediate TE in spectroscopic evaluation. Intermediate TE detects fewer metabolites than short TE. Partial volume effects during voxel placement cannot be completely denied though we have tried to minimize them by careful manual voxel placement/selection and taking average of three readings.
Conclusion
Both DWI as well as MRS was found to have statistically significant roles in grading of glial brain tumours. MRS (sensitivity, specificity, accuracy 79.8%, 86.2%, 83% respectively) was found to be more useful than DWI (sensitivity, specificity, accuracy 72.3%, 60%, 58.6% respectively). When used together DWI and MRS showed higher sensitivity, specificity as well as accuracy than their individual role (84.4%, 90.2% and 88.4%).
ADC: Apparent Diffusion Coefficient, Cho: Choline, NAA: N-Acetyl Aspartate, Cr: creatinine, MRS: Magnetic resonance spectroscopy, DWI: Diffusion Weighted Imaging, PPV: Positive predictive value, NPV: Negative predictive value