Materials and Methods
This was a descriptive study. The study population included all 15 to 54-year-old individuals in Ilam province. The study sample size was calculated using n=Z2 *p*q/ (d)2. Because the happiness status was unknown in our study population, therefore we considered p=0.5, α= 0.05 and d=0.05 and 385 participants were calculated. After considering design effect = 2, a total sample size of 770 participants was estimated. Considering the possibility of losing a number of questionnaires, the sample size of 800 participants was considered. After removing the incomplete questionnaire, 772 questionnaires were analysed. A random sampling method was used in the present study.
The researcher first provided a list of all Ilam provinces’ regions and cities. Then 10 cities were chosen among all the regions and cities randomly. The sample size required for each city or area was determined by the proportion of the population in the area to the whole population.
Research tools included Oxford Happiness Questionnaire (OHQ) [10] and influencing factors on happiness questionnaire.
The OHQ contains 29 items. All items are scored based on a four Likert scale numbered from 0 to 3. The final score ranges from 0 to 89. OHQ has five domains, including; life satisfaction, self esteem, subjective well being, fulfillment and positive mood. A previous study confirmed the validity and reliability of OHQ in Iranian society [11]. In the present study the reliability of this instrument was estimated with a Cronbach’s alpha value=0.93.
The influencing factors on happiness questionnaire were created using books, similar researches (5-7) and adapting them with the social and cultural environment of Ilam. The questionnaire validity was obtained by content validity by an expert panel (CVR=0.75).
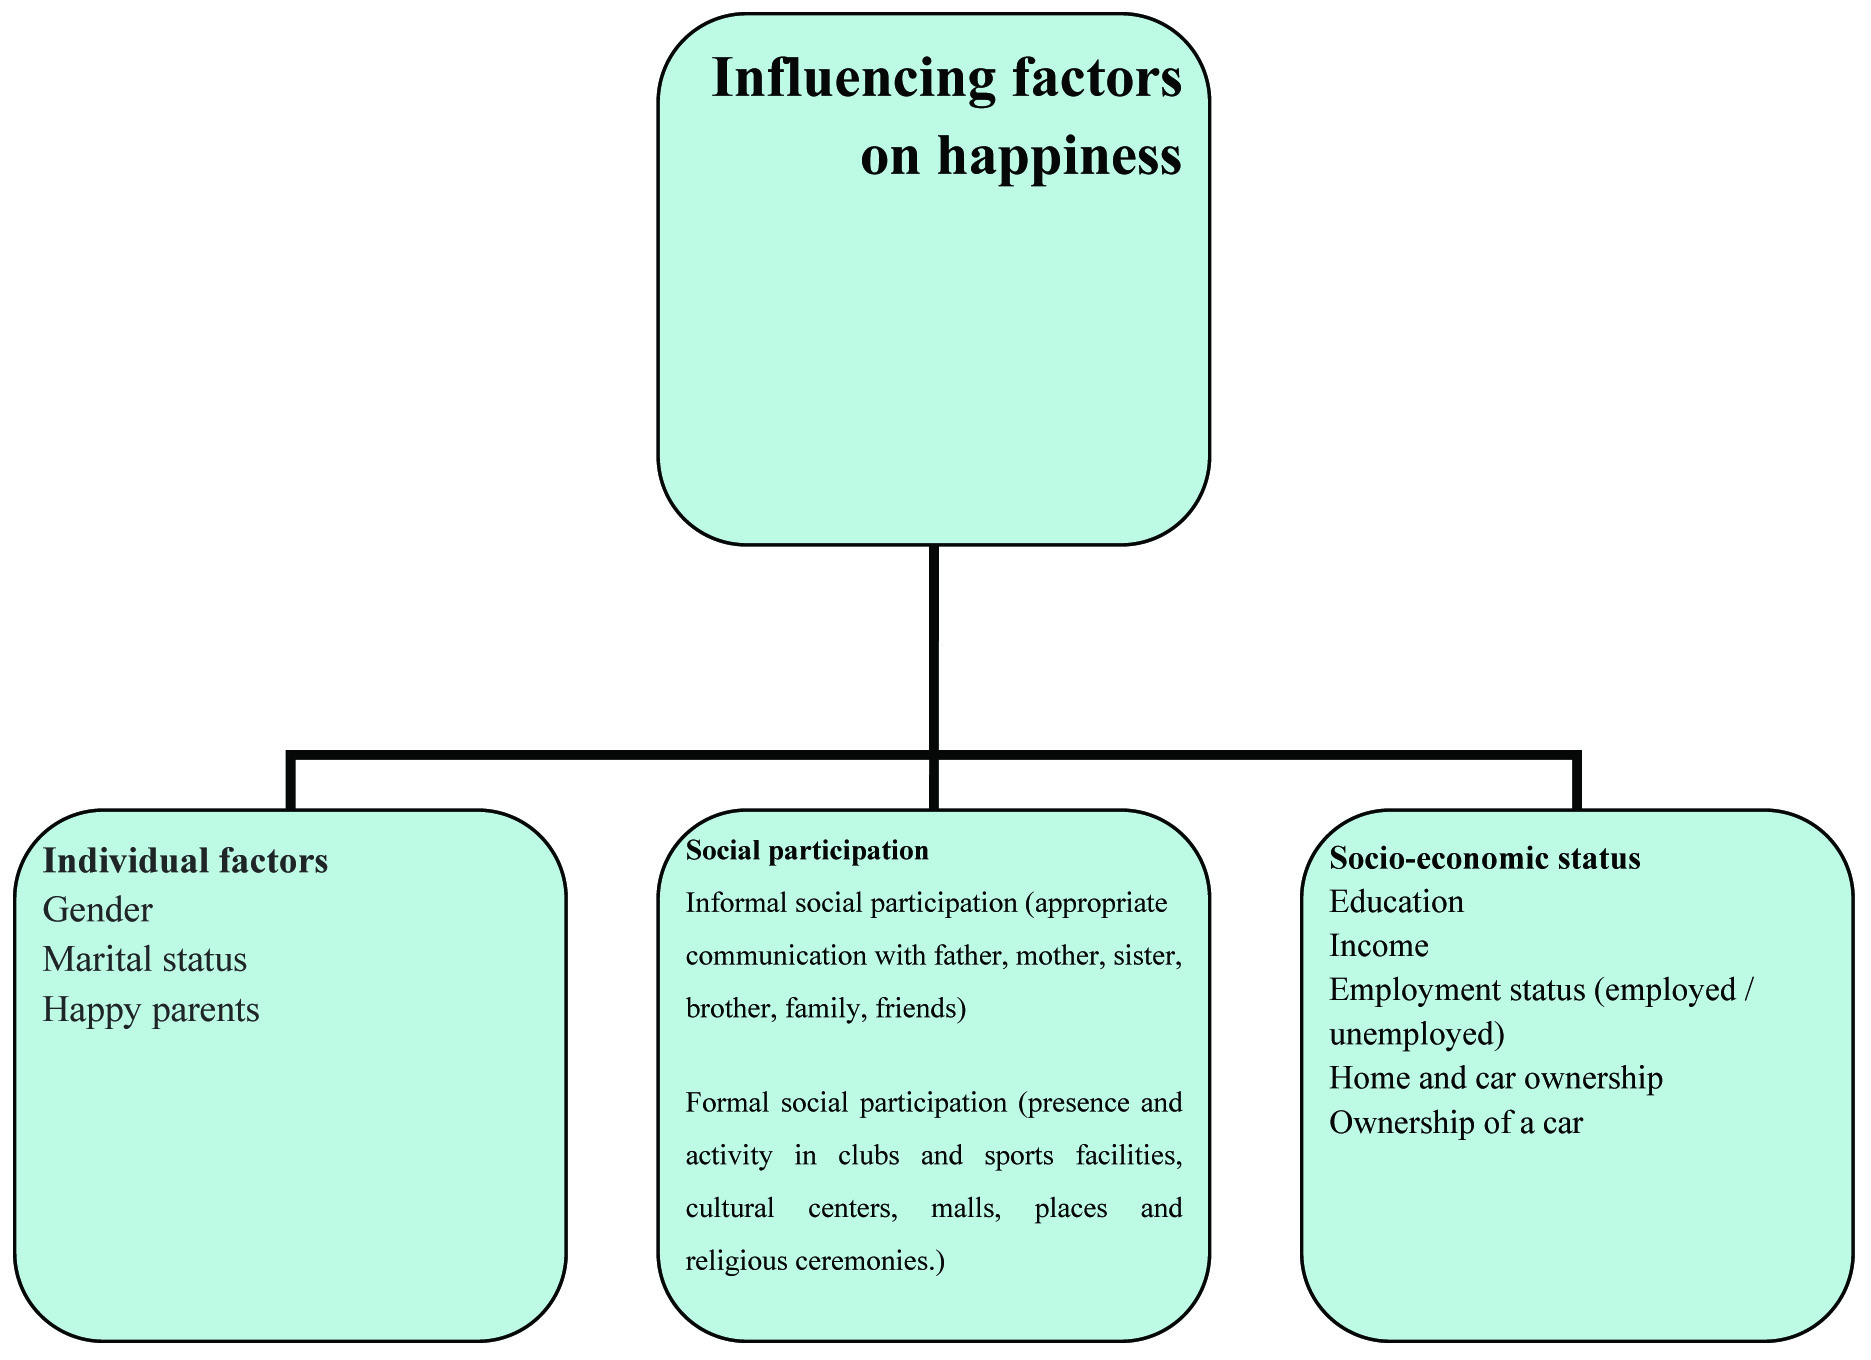
The content validity identified that the influencing factors on happiness questionnaire has three dimensions which include [Table/Fig-1]. In addition, 12 questions based on 5-point Likert was used in order to measure the formal and informal social participation. A total of six questions were proposed to assess the formal participation, including; the presence of responsive activities in clubs and sports facilities, cultural centers, malls, places and religious ceremonies. Also, six questions were raised to assess informal participation, including; the status of responsive communication with father, mother, sister, brother, family and friends. To measure the socioeconomic status, these were taken into consideration-educational grade, employment status (employed or unemployed), income, home and car ownership. Data analysis was performed by SPSS 21 using descriptive statistics including frequency, percentage, Mean±SD. Statical analysis was also used which included correlation coefficient, one way ANOVA and logistic regression.
The factors influencing happiness based on content validity
Results
The demographic characteristics of participants were as follows: less than half (41.8%) of all participants were male, most of participants were married (56.6%). Regarding educational level, one third of participants had a diploma (33%), 28.2% had bachelor’s degree and 10.7% had master’s or Ph.D. The majority of study participants (84.5%) were employed. Study participants had a Mean±SD happiness score of 55.94±16.05. To investigate the relationship between happiness and associated factors pearson correlation coefficient was used. The results showed a significant relationship between gender, marital status, happy parents, educational grade, employment status, income, car ownership, informal social participation and formal social participation with happiness. However, the relationship between home ownership (p=0.346, r=-0.015), and happiness was not significant. Also, among these factors, formal and informal social participation have the highest correlation with happiness [Table/Fig-2].
The coefficient of correlation between the studied factors and happiness.
| Factors | p-value | r |
|---|
| Gender | 0.001 | 0.144 |
| Marital status | 0.001 | 0.174 |
| Happy parents | 0.001 | 0.194 |
| Educational grade | 0.001 | 0.189 |
| Employment status (employed / unemployed) | 0.001 | 0.180 |
| Home ownership | 0.346 | -0.015 |
| Car ownership | 0.001 | 0.173 |
| Income | 0.001 | 0.264 |
| Informal social participation | 0.001 | 0.300 |
| Formal social participation | 0.001 | 0.231 |
A regression analysis was used to predict the factors affecting happiness. The Durbin–Watson statistic was in an acceptable area (1.5-2.5), therefore, we accepted the assuming independence of errors. The Variance Inflation Factor (VIF)=1.093 and Tolerance Index=0.915 were in the appropriate range. Also, the linear correlation between independent variables could not distort the application of multiple regression.
Overall, 10 variables were entered into the equation and resulted in eight steps, led to a reliable model so that:
In the first step, the informal social participation was entered in the equation. This variable had the highest impact on happiness (r=0.301, R2=0.090) and explained 9% of change of happiness as the dependent variable.
In the second step, the variable income was entered in the equation. The result showed a significant correlation coefficient between income and the power equation (r=0.394, R2=0.155). This variable could be increased 6.5% of the variance of the power equation. During 3rd step, the variable formal social participation was entered in the equation. The result showed a significant correlation coefficient between formal social participation and happiness (r=0.42, R2=0.177). The formal social participation could be increased 2.2% of the variance of the power of the equation. In the next steps, variables marital status, educational grade, gender, happy parents and employment status were entered in the equation. At each of these steps, the results showed a significant correlation coefficient between variables and happiness. These variables could increase the power of the equation respectively 2.1, 2, 1.5, 1.2, and 0.07. Totally, eight variables have been able to explain and interpret changes 24.5% of the dependent variable [Table/Fig-3,4].
Regression analysis of factors affecting happiness among the study participantsa
| Model | R | R Square | Adjusted R Square | R Square Change | F | p-valuea | Durbin-Watson |
|---|
| Informal social participation | 0.300 | 0.090 | 0.089 | 0.090 | 73.017 | 0.001 | |
| Income | 0.394 | 0.155 | 0.153 | 0.065 | 67.595 | 0.001 | |
| Formal social participation | 0.421 | 0.177 | 0.174 | 0.022 | 52.845 | 0.001 | |
| Marital status | 0.446 | 0.199 | 0.194 | 0.021 | 45.545 | 0.001 | |
| Educational grade | 0.468 | 0.219 | 0.214 | 0.020 | 41.167 | 0.001 | |
| Gender | 0.484 | 0.234 | 0.228 | 0.015 | 37.269 | 0.001 | |
| Happy parents | 0.496 | 0.246 | 0.239 | 0.012 | 34.026 | 0.001 | |
| Employment status | 0.503 | 0.253 | 0.245 | 0.007 | 30.856 | 0.001 | 1.699 |
p<0.05
Regression coefficients of factors affecting happiness among the study participants.
| Model | Un-standardized coefficient | Standardized coefficient | t | p-value |
|---|
| B | Std. Error | Beta |
|---|
| Constant | 0.989 | 0.346 | | 2.849 | 0.005 |
| Informal social participation | 0.048 | 0.009 | 0.193 | 5.574 | <0.001 |
| Income | 0.216 | 0.040 | 0.188 | 5.463 | <0.001 |
| Formal social participation | 0.033 | 0.007 | 0.162 | 4.744 | <0.001 |
| Marital status | 0.257 | 0.062 | 0.135 | 4.125 | <0.001 |
| Educational grade | 0.111 | 0.024 | 0.154 | 4.552 | <0.001 |
| Gender | 0.218 | 0.061 | 0.115 | 3.548 | <0.001 |
| Happy parents | 0.306 | 0.086 | 0.118 | 3.537 | <0.001 |
| Employment status | 0.225 | 0.087 | 0.087 | 2.604 | 0.009 |
Discussion
The results of the present study showed that the Mean±SD of the happiness score was 55.94±16.05 among our study participants, which was lower than the mean of happiness score of other studies [12-15]. Previous studies reported the higher prevalence of happiness score among Turkish University students [14,15]. In another study, the Mean±SD happiness score was 114.59±18.31 among 541 Iranian University students [13].
Also, the results of regression analysis showed that all demographic factors including; gender, marital status, happy parents are factors affecting happiness among our study participants. The set point theory is the most common psychological and vital theory related to happiness. In fact, the set point reflects a certain level of happiness that is inherited from parents. Based on set point theory factors such as living conditions, nationality, geographic location, cultural, regional, and demographic information such as age, gender and ethnicity account for only 10 percent of total happiness [16].
In addition, the results of some studies on the factors affecting happiness showed that gender is not a contributing factor in happiness [17,18].
The results of previous studies on the relationship between marital status and happiness vary. Some studies suggest the influence of marital status on happiness [17,19] and others showed no effect of marital status on happiness [20,21]. Married people enjoy emotional relationships and emotional intimacy with their partner. Also, they have more opportunity to express their emotions or feelings and it can lead to more happiness in them.
Based on the results of the present study, the socioeconomic factors, including income, education and occupation have affected happiness among our study participants. According to economic theory, living conditions, especially income have a lasting impression on happiness [11] and the results of various studies have confirmed this [17,22].
In addition, individuals with low incomes are likely to face difficulties in meeting their basic needs. They are more susceptible to physical, mental and emotional problems. Also, individual with higher education grade are happier than others. This result is in line with the findings of another study [22]. Although there are studies with conflicting results too [21,23].
It is important to note that having higher education grade may lead to an appropriate job, more income, achieving better economic and social position, high self esteem as well as more happiness. Often, unemployed individuals experince an unstable position in their family and society. Therefore, they are likely to suffer from loneliness and face social isolation.
Participant’s social participation (formal and informal) contributed to their happiness. So the results of the current study demonstrated that participant’s informal social participation was the most important factor in happiness. Based on the psychology set point theory, intentional activities including the activities of behavioral, cognitive and volunteering, is one of the essential factors of happiness and explain 40% of happiness [24]. In fact, interaction and social participation in formal or informal social communities increase satisfaction and create happiness. Involvement in religious activities and attending religious places are aspects of an formal social participation. The results of previous studies indicate that there is a significant correlation between happiness and involvement in religious activity. Religious activities makes one feel closer to God, helps in attaining a sense of calm, comfort and security that can increase happiness [18,24].
In the informal aspect of social participation, having good relations with others is one of the important factors that increase the happiness. Also, having a good and healthy family creates a safe, quiet, intimate and friendly space at home that can create and increase happiness among the family members too.
Limitation
The present study had some limitation. Although some factors such as marital and job satisfaction have a significant impact on individual’s happiness, we evaluated the marital and employment status regardless of their satisfaction. Also, the parents’ happiness was investigated as another effective factor on happiness among the study participants. Although we may not have the correct interpretation of the happiness of others, we examined the parents’ happiness from the perspective of their children.
Conclusion
It seems that good and cordial relations with others, including family, relatives and friends (informal social participation) are the main sources and the most important factors of life’s satisfaction and human happiness. Also, a higher income helps individuals to achieve their desires easily and lead a comfortable life. Therefore, it can be claimed that in most cases, the individuals with higher incomes experience lower stress and anxiety in their lifetime.
ap<0.05