Introduction
Egypt has the highest prevalence of Hepatitis C Virus (HCV) in the world, estimated nationally at 14.7%. HCV treatment consumes 20% ($80 million) of Egypt’s annual health budget. Outcomes of cirrhotic patients admitted to the ICU may, in fact, largely depend on differences in the state of the disease, criteria and indications for admission, resource utilization, and intensity of treatment.
Aim
The aim of the present study was to evaluate the efficacy of liver specific scoring models in predicting the outcome of critically ill cirrhotic patients in the ICU as it may help in prioritization of high risk patients and preservation of ICU resources.
Materials and Methods
Over one year, a total of 777 patients with End Stage Liver Disease (ESLD) due to HCV infection were included in this retrospective non-randomized human study. All statistical analyses were performed by the statistical software SPSS version 22.0 (SPSS, Chicago, IL, USA). Child Turcotte Pugh (CTP) score, MELD score, MELD-Na, MESO, iMELD, Refit MELD and Refit MELD-Na were calculated on ICU admission.
Results
ICU admission was mainly due to Gastrointestinal (GI) bleeding and Hepatic Encephalopathy (HE). Overall mortality was 27%. Age and sex showed no statistical difference between survivors and non survivors. Significantly higher mean values were observed for all models among individuals who died compared to survivors. MELD-Na was the most specific compared to the other scores. MELD-Na was highly predictive of mortality at an optimized cut-off value of 20.4 (AURC=0.789±0.03-CI 95%=0.711-0.865) while original MELD was highly predictive of mortality at an optimized cut-off value of 17.4 (AURC=0.678±0.01-CI 95%=0.613-0.682) denoting the importance of adding serum sodium to the original MELD. INR, serum creatinine, bilirubin, white blood cells count and hyponatremia were significantly higher in non survivors compared to survivors, while hypoalbuminemia showed no statistical difference. The advent of Hepatorenal Syndrome (HRS) and Spontaneous Bacterial Peritonitis (SBP) carried worse prognosis. Hyponatremia and number of transfused blood bags were additional independent predictors of mortality.
Conclusion
In cirrhosis of liver, due to HCV infection, patients who died during their ICU stay displayed significantly higher values on all prognostic scores at admission. The addition of sodium to MELD score greatly improves the predictive accuracy of mortality. MELD-Na showed the highest predictive value of all scores.
Introduction
Egypt has the highest prevalence of HCV in the world (14.7%) [1]. Complicated liver cirrhosis frequently requires ICU admission. Outcomes of cirrhotic patients admitted to the ICU may, in fact, largely depend on differences in the state of the disease, criteria and indications for admission, resource utilization, new therapeutic modalities and intensity of treatment. The ICU mortality rates of cirrhotic patients admitted to the ICU range from 34% to 86% [2].
Specific prognostic models are desirable not only to recognize the patients most suitable for aggressive treatment, but also to justify the large ICU resource utilization for these patients [3]. The severity of cirrhosis is commonly classified with the CTP score developed in 1973 [4,5], which is more subjective as it includes two subjective variables namely ascites and encephalopathy. A second limiting factor for CTP is that renal function which is a variable prognostic marker in cirrhosis is not taken into account [6]. More modern scores, used in the allocation of liver transplants but also in other contexts, are the Model for End Stage Liver Disease (MELD) scoring system that has many advantages including objectivity, simplicity, ease of use, sensitivity to the dynamic changes of liver cirrhosis and reproducibility [7]. However, MELD has some limitations such as variability in the score because of the different laboratories and conditions, and without hemodynamic index [8,9].
Recently, studies have shown that the MELD score’s prognostic accuracy may be improved by adding variables such as serum sodium and/or albumin leading to more mathematical scores such as MELD to sodium (MESO) index [10]. The MELD with the incorporation of serum sodium (MELD-Na) [11] and the integrated MELD (iMELD) score [12].
Our aim was to evaluate the efficacy of the new liver specific scoring system in predicting the outcome of critically ill cirrhotic patients admitted to the ICU for prioritization of high risk patients and preservation of ICU resources.
Materials and Methods
This was a retrospective non-randomized human study based on the analysis of 777 consecutive patients admitted to the ICU in the hepato-gastroenterology department at Theodor Bilharz Research Institute (TBRI), Giza, Egypt. All were cirrhotic patients with either HE and/or GI bleeding admitted during the one year period i.e., from January 1st to December 30th, 2015. These are the two types of patients, we used to admit to our hepatic ICU. All patients were anti HCV-antibody positive with liver cirrhosis and portal hypertension as evidenced by clinical examination, laboratory, ultrasonographic and endoscopic features. None of them received recent oral antiviral treatment. All patients with upper GI bleeding were exposed to upper gastrointestinal endoscopy after they have been resuscitated and stabilized by administration of intravenous fluids, packed red blood cells, octreotide and antibiotics. Most of them underwent upper GI endoscopy within 24 hours of admission. The Oesophageal Varices (OV) were banded, fundal varices were injected with histoacryl and bleeding peptic ulcers were treated with two methods, mostly diluted adrenaline injection and argon plasma coagulation when detected. If bleeding was observed in the ulcer base, it was treated by clips. No liver biopsy was done for any patient because of prolonged prothrombin time and/or presence of ascites. The laboratory data were determined within two hours of admission to ICU and the most recent findings were considered when patients were readmitted.
Exclusion criteria include: *Age <18 years.
*Patients with primary (HCC or cholangiocarcinoma) or metastatic malignancies.
*Patients with any chronic liver disease other than HCV.
*Cirrhotic patients admitted to ICU following any type of surgery.
*Patients received liver transplantation before.
The study had been approved by the ethical committee of TBRI and follows the Helsinki rules.
Calculations of the Scores
Child Turcotte Pugh score: It took into account five factors including, ascites, enceph-alopathy, serum bilirubin, serum albumin and prothrombin time. It assigned a score ranging from 1 to 3 for each variable. Score up to 6 denotes Child A, score from 7 to 9 denotes Child B and score more than 9 denotes Child C which is the worst [5].
Model for End Stage Liver Disease (MELD) score: MELD=9.57 x loge serum creatinine (mg/dl) + 3.78 loge serum bilirubin (mg/dl) + 11.2 x loge INR + 6.43. With a lower limit of one for all three variables and upper limit of four for serum creatinine. Patients receiving renal replacement therapy were automatically assigned the upper bound for creatinine. The MELD score ranges from 6 to 40 with higher values indicating more severe disease [13].
MELD - with the incorporation of serum sodium (MELD-Na) score: MELD-Na=MELD + 1.59 x (135-Na [mmol/l]). Na range 120 and 135 [mmol/l]. It is rounded to the nearest integer [14].
Model for End Stage Liver Disease to sodium index (MESO) score: MESO=(MELD/Na [mmol/l]) x100 [10].
Integrated MELD (iMELD) score: iMELD=MELD + (age [years] x 0.3) – (0.7 x Na [mmol/l]) +100 [12].
Refit MELD=4.082 x loge (Bilirubinc) + 8.485 x loge (creatininec) + 10.671 x loge (INRc) + 7.432 [15,16].
Refit MELD-Na = 4.258 x loge (Bilirubin) + 6.792 x loge (Creatininec) + 8.290 x loge (INRc) + 0.652 x (140-Nac) - 0.194 x (140-Nac) x Bilirubincc+ 6.32 [15,16].
Where the modified terms bilirubinC = bilirubin bounded below by 1 mg/dl, creatinineC = creatinine capped by 0.8 mg/dl below and 3 mg/dl above, INRC = INR bounded by 1 below and 3 above and Nac = serum sodium bounded by 125 below and 140 above.
Statistical Analysis
Kolmogorov-Simirnov testing was performed to evaluate the normality of the distribution of each variable. Continuous variables were compared by Mann-Whitney test. Categorical variables were evaluated using a Chi-square test or Fisher’s Exact test as needed. The accuracy of prognostic models was analyzed by Receiver Operating Characteristics (ROC) curves and by calculating the sensitivity, specificity and 95% CI for chosen cut offs. Logistic regression was performed to identify risk factors for mortality (dependent variables) by backward stepwise regression. Kaplan-Meier curves were plotted to display the impact on survival. All statistical analyses were performed by the statistical software SPSS version 22.0 (SPSS, Chicago, IL, USA). A p-value of less than 0.05 was considered statistically significant.
Results
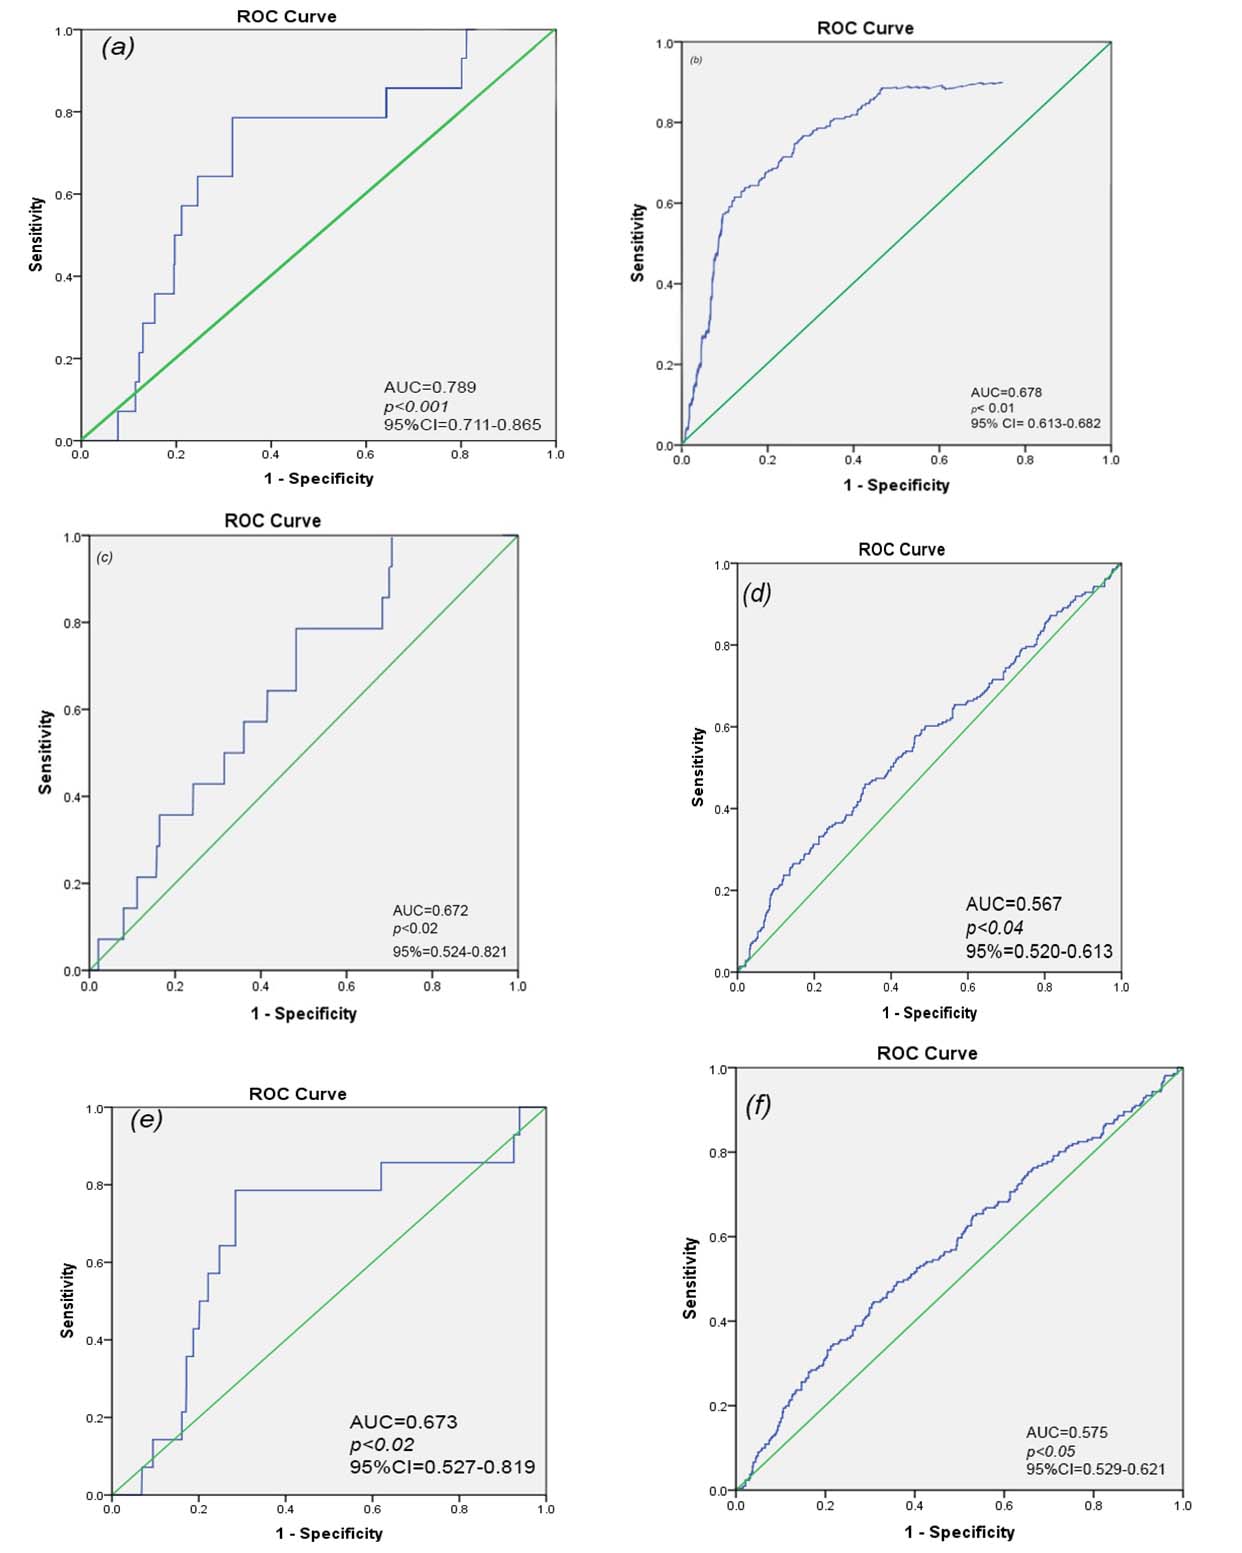
A total of 777 patients, admitted to the ICU either due to hepatic encephalopathy and /or GI bleeding were included in our study; 72.8% survived and 27.2% died. Mean age was 57 years (range 23-80 years) and 66.4% were males. The demographic, clinical characteristics and laboratory results of the study groups are shown in [Table/Fig-1]. Both age and sex did not show any statistical difference between survivors and non survivors. Serum bilirubin, creatinine, INR and hyponatremia were significantly higher in non survivors compared to the survivors. Non survivors showed significantly higher proportions of ascites (p<0.01), hepatic encephalopathy (p<0.01), Child C (p<0.01), Spontaneous Bacterial Peritonitis (SBP) (p<0.01) and hepatorenal syndrome (HRS) (p<0.01) compared to the survivors [Table/Fig-2]. Associated co-morbidities did not show statistically significant difference between the two groups [Table/Fig-3]. Mean values of the MELD, MELD-Na, MESO, iMELD, Refit MELD and Refit MELD-Na models are shown in [Table/Fig-4]. Significantly higher means values (p<0.01) were observed for all models among individuals who died compared to survivors. No significant differences were observed when model equations compared with each other (p>0.05). ROC curves of all studied models at admission was plotted to evaluate their performance in predicting ICU mortality [Table/Fig-5,6]. MELD-Na had the highest area under curve and was highly predictive of mortality at an optimized cut-off value of 20.4. Logistic regression analysis showed the number of transfused blood units and hyponatremia as additional independent prognostic factors that predict mortality [Table/Fig-7].
Demographic, clinical characteristics and laboratory results in the study groups.
| Characteristics | All patients n =777 | Survivors n=566 | Non- Survivors n = 211 |
|---|
| Age (years) | 57.00±0.44 | 57.16±0.49 | 56.66±0.96 |
| Male/Female | 516/261 | 371/195 | 145/66 |
| Male | 516 (66.4%) | 371 (65.5%) | 145 (68.7%) |
| Female | 261 (33.6%) | 195 (34.5%) | 66 (31.3%) |
| Child Score | 9.44±0.09 | 9.23±1.05 | 9.97±0.15** |
| -A | 79 (10.2%) | 71 (12.5) | 8 (3.8) |
| -B | 319 (41.1%) | 250 (44.2%) | 69 (32.7%) |
| -C | 379 (48.8%) | 245 (43.3%) | 134 (63.5%)** |
| Hematemesis | 340 (43.8) | 287 (50.7) | 53 (25.1) |
| Melena | 85 (10.9) | 67 (11.8) | 18 (8.5) |
| Hematemesis + melena | 62 (8.0) | 59 (10.4) | 3 (1.4) |
| Encephalopathy | 290 (37.3) | 153 (27.0) | 137 (64.9)** |
| 1stattack of hematemesis | 103 (13.3) | 65 (11.5) | 38 (18.0)* |
| Recurrent attacks of hematemesis | 384 (49.4) | 238 (42.0) | 146 (69.2)** |
| Splenomegaly | 255 (32.8) | 78 (13.8) | 177 (83.9) |
| Ascites | 573 (73.7) | 362 (63.9) | 211 (100.0)** |
| Albumin (g/dL) | 2.59±0.04 | 2.64±0.06 | 2.48±0.04 |
| Creatinine (mg/dL) | 1.57±0.05 | 1.48±0.06 | 1.80±0.09** |
| Bilirubin (mg/dL) | 3.94±0.16 | 3.93±0.17 | 3.96±0.38** |
| SGPT (IU/dL) | 66.90±5.23 | 65.57±5.17 | 70.45±13.37 |
| SGOT (IU/dL) | 63.32±3.44 | 63.43±3.96 | 63.02±6.9 |
| PT (seconds above control) | 13.83±0.82 | 12.67±0.73 | 16.93±2.3** |
| INR | 1.82±0.04 | 1.74±0.03 | 2.04±0.09** |
| WBC | 10.19±0.31 | 9.94±0.33 | 10.86±0.71 |
| HB (g/dL) | 10.06±1.10 | 9.03±0.25 | 9.60±0.49 |
| Natremia<126 meq/l | 126.16±1.23 | 133.30±1.58 | 124.24±1.44** |
| Natremia>126 meq/l | 133.58±0.53 | 134.47±0.65 | 131.32±0.84 |
| Units of RBC (bags) | 2.52±0.09 | 2.00±0.09 | 3.76±0.27** |
| ICU Admission Days | 2.55±0.04 | 2.34±0.09 | 2.80±0.17** |
SGOT: serum glutamic oxaloacetic transaminase, SGPT: serum glutamic pyruvic transaminase, PT: Prothrombin time, INR: international normalized ratio, WBC: white blood cells, RBC: Red blood cells, HB: Hemoglobin
p<0.05,
p<0.01 significant increase than survivors. Fisher’s Exact test.
Complications of liver cirrhosis and risk of mortality.
| All patients | Survivors | Non- Survivors |
|---|
| SBP | 48 (6.2) | 14 (2.5) | 34 (16.1)** |
| HRS | 78 (10.04) | 34 (6.01) | 44 (20.9)** |
| PVT | 28 (37.3) | 5 (14.7) | 23(56.1) |
p<0.01 significant increase than survivor. Chi square (χ2). HRS; hepatorenal syndrome, SBP; spontaneous bacterial peritonitis, PVT; portal vein thrombosis.
Associated major co-morbidity and risk of mortality.
| Associated Diseases n (%) | All patients (777) | Survivors (566) | non-Survivors (211) |
|---|
| CRF | 15 (1.93) | 15 (2.65) | --- |
| HTN | 160 (20.59) | 110 (19.43) | 50 (23.70) |
| DM | 270 (34.75) | 190 (33.56) | 80 (37.90) |
| Neurological | 47 (6.0) | 43 (7.59) | 4 (1.89) |
| Chest infection | 47 (6.0) | 27 (4.77) | 20 (9.48) |
| Cardiovascular | 39 (5.0) | 29 (5.12) | 10 (4.74) |
| NSAID Drugs | 90 (12.0) | 66 (11.66) | 24 (11.37) |
CRF: chronic renal failure, HTN: hypertension, DM: diabetes Mellitus, NSAID: non steroidal anti- inflammatory drugs
Scoring models and risk of mortality.
| Parameter | all N=777 | Survivors N=566 | non-Survivors N=211 | p-value |
|---|
| MELD | 17.65±0.34 | 16.93±0.38 | 19.59±0.73** | <0.01 |
| MELD-Na | 21.37±0.84 | 19.99±0.99 | 25.05±1.57** | <0.01 |
| MESO | 12.59±0.29 | 11.79±0.33 | 14.73±0.55** | <0.01 |
| iMELD | 40.88±0.66 | 39.47±0.81 | 44.64±1.05** | <0.01 |
| Refit MELD | 18.36±0.33 | 17.72±0.36 | 20.04±0.69** | <0.01 |
| Refit MELD-Na | 13.33±0.65 | 11.92±1.64 | 13.64±0.66* | <0.02 |
p<0.05,
p<0.01 significant increase than survivors. Mann-Whitney test (U-test). MELD:Model for end-stage liver disease; MELD-Na: MELD with sodium; MESO: model for end-stage liver disease to sodium index, iMELD:integerated MELD; Re^BELD: revised model for end-stage liver disease; Refit MELD-Na: received model for end disease stage liver with sodium.
Predictive value of different scoring models.
| Model | Cut off | Sensitivity | Specificity | AUROC | CI 95% |
|---|
| MELD-Na | 20.4 | 88.89 | 77.27 | 0.789±0.03 | 0.711-0.865 |
| MELD | 17.4 | 80.42 | 73.33 | 0.678±0.01 | 0.613-0.682 |
| MESO | 12.7 | 65.1 | 72.70 | 0.672±0.02 | 0.524-0.821 |
| IMELD | 39.8 | 63.0 | 70.60 | 0.567±0.02 | 0.520-0.613 |
| Refit MELD-Na | 12.1 | 66.1 | 71.20 | 0.673±0.02 | 0.527-0.819 |
| Refit MELD | 18.7 | 69.0 | 70.40 | 0.575±0.02 | 0.529-0.621 |
AUROC: area under the curve (ROC), Meld:Model for end-stage liver disease; MELD-Na: MELD with sodium; MESO: model for end-stage liver disease to sodium index. iMELD:integerated MELD; Refit MELD: revised model for end-stage liver disease; Refit MELD-Na: received model for end disease stage liver with sodium.
ROC curves of all studied models: (a)-MELD-Na, (b) MELD, (c) MESO, (d) iMELD, (e) Refit MELD-Na, (f) Refit MELD.
Logistic regression analysis of independent predictors of mortality.
| Variable | Odds Ratio | p-value |
|---|
| Blood bags | 1.46 | p<0.01 |
| Serum sodium | 1.36 | p<0.03 |
| MELD | 1.09 | p<0.05 |
| MELD Na | 1.096 | p<0.05 |
Discussion
Many prognostic models and scores have been proposed in the last two decades to predict prognosis in patients with ESLD and to determine the most appropriate therapeutic option [17]. The ICU mortality rate of cirrhotic patients ranged from 34% to 68% [2]. Overall mortality in our patients was 27.2%. This is contrary to other reported mortality 47% [18], >55% [19] and 57.5% [20] in cirrhotic patients admitted to ICUs. The explanation can be attributed to variability within the stages of the disease, associated complications and number and type of non-functioning organs among different studies. Also, most (nearly 63%) of our patients were admitted to the ICU because of GI bleeding for whom emergency therapeutic intervention is available with estimated mortality of 15.19%. This is in concordance with Carbonell N et al., who reported improved survival after variceal bleeding in patients with cirrhosis over the past two decades from 42.6% to 14.5% [21]. In our series, 37% of our patients admitted to the ICU because of HE, of whom 47.4% died. This is in concordance with other studies where HE comprised the single most common presentation of liver disease in 47% of patients, of whom 50% died in hospital [18] and was the most common complication of cirrhosis requiring admission to the ICU (33%) where it was also was the most common cause of death (50%) [20].
Both age and gender did not predict outcome in our study. Mean age was 57 years; 66.4% of whom were males. This is in concordance with other studies. Gunnarsdottir SA et al., [22] reported mean age around 60 years; whereas O’Brien AJ et al., [19] reported the mean age was 52.5 years with male preponderance (60%). Parkash O et al., reported more men with liver disease (60%) were admitted to the ICU compared with women (40%) [18]. Similarly, Nafeh H et al., in 2014 [20] reported mean age of 56 and the majority were men (85%).
In our study, INR, serum creatinine, bilirubin (MELD components), white blood cells count and hyponatremia (<126 meq/l) were significantly higher in ESLD patients who died in the ICU. This is similar to other report [23]. Bilirubin was a good parameter to predict patients’ survival although various limitations should be kept in mind. Even in advanced hepatic disease, bilirubin levels may be normal [24]. In our study, 73 (19.3%) patients under child score C had normal serum bilirubin level. On the other hand, elevated levels are often very unspecific and can point to many different diseases, severe or harmless [25]. Still, in patients with liver disease elevated levels of bilirubin point to a worse outcome [24]. Thus, bilirubin levels may at least provide some estimate of mortality in patients with liver disease admitted to an ICU.
We did not find statistically significant value for hypoalbuminemia; although, it was low in patients who died in ICU. Hypoalbuminemia has been shown to be a frequent finding in hepatic patients on ICU admission, because it may result from hemodilution, capillary leak, or a cytokine-induced decreased synthesis of albumin by liver rather than pre-existing liver disease alone [26]. Similarly, INR may increase because of hypoxic hepatitis, disseminated intravascular coagulation, or bleeding-induced coagulopathy. The absence of a prognostic impact of liver disease severity with the prognostic impact of high INR or low serum albumin, suggests that INR and serum albumin might not reflect liver disease severity in the setting of ICU admission [27].
Studies showed that patients with decompensated cirrhosis had a poor prognosis, particularly when they develop complications related to ESLD, such as HE, SBP, or GI bleeding with or without diminished renal function [28]. The latter is a well established important predictor of survival in those patients [29]. Pan HC et al., showed that cirrhotic patients with acute kidney injury admitted to ICUs show extremely high mortality rates [30]. This came in agreement with our study as 78 (10%) patients of our ESLD patients admitted to the ICU presented with HRS, of whom 44 (5.6%) patients died. Of note is that the HRS indicates a severe liver failure and has a bad prognosis without liver transplantation [31].
A recent meta-analysis by Arvaniti V et al., showed that the presence of infections in cirrhotic patients increased the mortality four-fold [32]. Indeed, in our cohort one of the main causes of death was sepsis. However, the detection of pathogens may not necessarily be indicative of an active infection, 34 of 48 (70.8%) patients had died from SBP.
We compared the efficacy of the liver specific scoring system in predicting the outcome of critically ill cirrhotic patients admitted to the ICU. In our study, patients with cirrhosis who died during their ICU stay displayed significantly higher values on all prognostic scores at admission when compared to those who survived. MELD-Na had the highest area under curve comparing to the other scores denoting the importance of adding serum sodium to the original MELD. This is in agreement with previous report of Kim WR et al., [14]. They reported that 7% of waiting list deaths could be averted if the MELD-Na score were used for liver allocation. However, the effect of hyponatremia gradually diminished as the MELD score increased. It is known that serum sodium concentrations may vary depending on factors such as the volume status and use of diuretics [14]. However, published data indicate that hyponatremia in patients with cirrhosis is difficult to alter [33]. It is worth noting that how well the model discriminates between individuals who will live and those who will die is termed discrimination, and how close the estimated probabilities of mortality correlate with the observed mortality over the entire range of probabilities is termed calibration. It is rather impossible for any model to have perfect calibration and discrimination at the same time [34]. We found Refit MELD-Na scoring model to have a mortality predicting value which in contrary to Kim J et al., [15] who reported no difference between both Refit MELD and Refit MELD-Na in predicting mortality in patients with ESLD with ascites. It could be attributed to different type of patients included in our study.
As previously suggested by others [35] the prognosis of ICU admitted cirrhotic patients seems to have improved over time. The hypotheses that may explain this observation include significant advances in medical care of cirrhotic patients and/or in general intensive care, a more strict selection of cirrhotic patients by ward physicians or intensivists for ICU admission, or differences in the characteristics of studied populations (cirrhosis causes, reasons for ICU admission) [21,35].
Limitation
Potential limitations of our study include the retrospective design, absence of randomization and no follow-up with single time point measurement of blood tests. However, this study for our knowledge is the first to study a homogenous group of patients with single disease; HCV infected patients with and without complications and study most of the liver specific scores. Needless to say, randomized controlled prospective studies with longer follow up and repetitive scoring calculations are needed to confirm our results.
Conclusion
Patients with liver cirrhosis due to HCV infection, who died during their ICU stay displayed significantly higher values on all prognostic scores at admission when compared to those who survived. The addition of sodium to MELD score greatly improves the predictive accuracy of non survival. MELD-Na showed the highest predictive value of all scores. Randomized controlled prospective studies with longer follow-up and repetitive scoring calculations are needed to validate the predictive accuracy of liver specific scoring system.
SGOT: serum glutamic oxaloacetic transaminase, SGPT: serum glutamic pyruvic transaminase, PT: Prothrombin time, INR: international normalized ratio, WBC: white blood cells, RBC: Red blood cells, HB: Hemoglobin
*p<0.05,
**p<0.01 significant increase than survivors. Fisher’s Exact test.
**p<0.01 significant increase than survivor. Chi square (χ2). HRS; hepatorenal syndrome, SBP; spontaneous bacterial peritonitis, PVT; portal vein thrombosis.
CRF: chronic renal failure, HTN: hypertension, DM: diabetes Mellitus, NSAID: non steroidal anti- inflammatory drugs
*p<0.05,
**p<0.01 significant increase than survivors. Mann-Whitney test (U-test). MELD:Model for end-stage liver disease; MELD-Na: MELD with sodium; MESO: model for end-stage liver disease to sodium index, iMELD:integerated MELD; Re^BELD: revised model for end-stage liver disease; Refit MELD-Na: received model for end disease stage liver with sodium.
AUROC: area under the curve (ROC), Meld:Model for end-stage liver disease; MELD-Na: MELD with sodium; MESO: model for end-stage liver disease to sodium index. iMELD:integerated MELD; Refit MELD: revised model for end-stage liver disease; Refit MELD-Na: received model for end disease stage liver with sodium.
[1]. Mohamoud YA, Mumtaz GR, Riome S, Miller D, Abu-Raddad LJ, The epidemiology of hepatitis C virus in Egypt:a systematic review and data synthesisBMC Infect Dis 2013 13:288 [Google Scholar]
[2]. U.S. Centers for Disease Control and Prevention (CDC). Progress toward Prevention and Control of Hepatitis C Virus Infection - Egypt, 2001-2012. Morbidity and Mortality Weekly Report, 27 July 2012 [Google Scholar]
[3]. AL-Freah M, Gera A, Martini S, McPhail M, Devlin J, Harrison P, Comparison of scoring systems and outcome of patients admitted to a liver intensive care unit of a tertiary referral center with severe variceal bleedingAliment Pharmacol Therap 2014 39:1286-1300. [Google Scholar]
[4]. Child CG, Turcotte JG, Surgery and portal hypertensionMajor Probl Clin Surg 1964 1:1-85. [Google Scholar]
[5]. Pugh RN, Murray-Lyon IM, Dawson JL, Pietroni MC, Williams R, Transaction of the esophagus for bleeding esophageal varicesBr J Surg 1973 60:646-49. [Google Scholar]
[6]. Fernandez-Esparrach G, Sanchez-Fueyo A, Gines P, Uriz J, Quintó L, Ventura P, A prognostic model for predicting survival in cirrhosis with ascitesJ Hepatol 2001 34:46-52. [Google Scholar]
[7]. Wiesner R, Edwards E, Freeman R, Harper A, Kim R, Kamath P, Model for end stage liver disease (MELD) and allocation of donor liversGastroenterol 2003 124:91-96. [Google Scholar]
[8]. Cholangitas E, Senzalo M, Triantos C, Samonakis D, Patch D, Burrhoughs AK, MELD is not enough-enough of MELD?J Hepatol 2005 42:479-77. [Google Scholar]
[9]. Durand F, Valla D, Assessment of the prognosis of cirrhosis:Child Pugh versus MELDJ Hepatol 2005 42:S100-07. [Google Scholar]
[10]. Huo TI, Wang YW, Yang YY, Lin HC, Lee PC, Hou MC, MELD score to serum sodium ratio index as a prognostic predictor and its correlation with portal pressure in patients with liver cirrhosisLiver Inter 2007 27:498-506. [Google Scholar]
[11]. Biggins SW, Kim WR, Terrauh NA, Saab S, Balan V, Schiano T, Evidence based incorporation of serum sodium concentration into MELDGastroenterol 2006 130:1652-60. [Google Scholar]
[12]. Luca A, Angermayr B, Bertolini G, Koenig F, Vizzini G, Ploner M, An integrated MELD model including serum sodium and age improves the prediction of early mortality in patients with cirrhosisLiver Transpl 2007 13:1174-80. [Google Scholar]
[13]. Kamath PS, Wiesner RH, Malinchoc M, Kremers W, Therneaue TM, Kosberg CL, A model to predict survival in patients with end stage liver diseaseHepatol 2001 33:464-70. [Google Scholar]
[14]. Kim WR, Biggins SW, Kremers W, Wiesner R, Kamath PS, Benson JT, Hyponatremia and mortality among patients on the liver-transplant waiting listN Engl J Med 2008 359:1018-26. [Google Scholar]
[15]. Kim J, Kim JH, Koo J, Choi Y, Ko S, Choe W, The Refit model for end stage liver disease-Na is not a better predictor of mortality than the Refit model for end-stage liver disease in patients with cirrhosis and ascitesCMH 2014 20:47-55. [Google Scholar]
[16]. Leise MD, Kim WR, Kremers WK, Larson JJ, Benson JT, Therneau TM, A revised model for end-stage liver disease optimizes prediction of mortality among patients awaiting liver transplantationGastroenterology 2011 140:1952-60. [Google Scholar]
[17]. Kim HJ, Lee HW, Important predictor of mortality in patients with end-stage liver diseaseClinical and Molecular Hepatology 2013 19:105-15. [Google Scholar]
[18]. Parkash O, Iqbal R, Jafri F, Azam I, Jafri W, Frequency of poor quality of life and predictors of health related quality of life in cirrhosis at a tertiary care hospital PakistanBMC Res Notes 2012 5:446 [Google Scholar]
[19]. O’Brien AJ, Welch CA, Singer M, Harrison DA, Prevalence and outcome of cirrhosis patients admitted to UK intensive care:a comparison against dialysis-dependent chronic renal failure patientsEur J Intensive Care Med 2012 38:991-1000. [Google Scholar]
[20]. Nafeh H, Abdelmoneim S, Hassany S, Swifee Y, Risk factors and outcome in ICU patients with end-stage liver DiseaseJournal of the Arab Society for Medical Research 2014 9:33-39. [Google Scholar]
[21]. Carbonell N, Pauwels A, Serfaty L, Fourdan O, Lévy V, Poupon R, Improved survival after variceal bleeding in patients with cirrhosis over the past two decadesHepatology 2004 40:652-59. [Google Scholar]
[22]. Gunnarsdottir SA, Olsson R, Olafsson S, Cariglia N, Westin J, Thjódleifsson B, Liver cirrhosis in Iceland and Sweden:incidence, etiology and outcomesScand J Gastroenterol 2009 44:984-93. [Google Scholar]
[23]. Benedeto-Stojanov D, Nagorni A, Bjelaković G, Stojanov D, Mladenović B, Djenić N, The model for the end-stage liver disease and Child–Pugh score in predicting prognosis in patients with liver cirrhosis and esophageal variceal bleedingVojnosanit Pregl 2009 66:724-28. [Google Scholar]
[24]. Lehner S, Stemmler HJ, Mück A, Braess J, Parhofer KG, Prognostic parameters and risk stratification in intensivecare patients with severe liver diseasesJ Gastrointestin Liver Dis 2010 19(4):399-404. [Google Scholar]
[25]. Bambha KM, Biggins SW, Inequities of the model for end-stage liver disease:an examination of current components and future additionsCurr Opin Organ Transplant 2008 13:227-33. [Google Scholar]
[26]. Wang X, Li W, Lu J, Li N, Li J, Lipopolysaccharide suppresses albumin expression by activating NF-kappa B in rat hepatocytesJ Surg Res 2004 122:274-79. [Google Scholar]
[27]. Das V, Boelle P, Galbois A, Guidet B, Maury E, Carbonell N, Cirrhotic patients in the medical intnsive care unit:early prognosis and long-term survivalCrit Care Med 2010 38:2108-16. [Google Scholar]
[28]. Gines P, Schrier RW, Renal failure in cirrhosisN Engl J Med 2009 361:1279-90. [Google Scholar]
[29]. Cholongitas E, Marelli L, Kerry A, Senzolo M, Goodier DW, Nair D, Different methods of creatinine measurement significantly affect MELD scoresLiver Transpl 2007 13:523-29. [Google Scholar]
[30]. Pan HC, Jenq CC, Tsai MH, Fan PC, Chang CH, Chang MY, Risk models and scoring systems for predicting the prognosis in critically ill cirrhotic patients with acute kidney injury:a prospective validation studyPLoS One 2012 7:e51094 [Google Scholar]
[31]. Gines P, Cardenas A, Arroyo V, Rodés J, Management of cirrhosis and ascitesN Engl J Med 2004 350:1646-54. [Google Scholar]
[32]. Arvaniti V, D’Amico G, Fede G, Manousou P, Tsochatzis E, Pleguezuelo M, Infections in patients with cirrhosis increase mortality four-fold and should be used in determining prognosisGastroenterology 2010 139:1246-56. [Google Scholar]
[33]. Gerbes AL, Gulberg V, Gines P, Decaux G, Gross P, Gandjini H, Therapy of hyponatremia in cirrhosis with a vasopressin receptor antagonist:a randomized double blind multicenter trialGastroenterol 2003 124:933-39. [Google Scholar]
[34]. Freire P, Romãozinho J, Amaro P, Ferreira M, Sofia C, Prognostic scores in cirrhotic patients admitted to a gastroenterology intensive care unitRev Esp Enferm Dig 2011 103:177-83. [Google Scholar]
[35]. Cholongitas E, Senzolo M, Patch D, Kwong K, Nikolopoulou V, Leandro G, Risk factors, sequential organ failure assessment and model for end-stage liver disease scores for predicting short term mortality in cirrhotic patients admitted to intensive care unitAliment Pharmacol Ther 2006 23:883-93. [Google Scholar]