Pulse oximetry has assumed a significant position in management of patients in ICU. It is often referred to as fifth vital sign [1]. Specific pulse oximeter oxygen saturation (SpO2) targets have been proposed to achieve end goals in weaning, providing long term oxygen therapy and other critical end points in ICU [2]. In view of their prevalent use, FDA has issued guidelines for manufacturing and quality standard. In particular, all pulse oximeters have to meet an accuracy, which is defined as root mean square of bias and precision, of less than 3%, in order to be approved [2].
Accuracy of pulse oximeter is dependent on various factors. While most manufacturers design and standardize their pulse oximeters in hypoxia laboratories, in real life and emergency rooms and ICUs, various factors like hypoxia, anaemia, use of vasopressors, perfusion status and sepsis affect the bias (difference between SpO2 and true arterial oxygen saturation i.e., SaO2) and precision (variability of readings-measured by standard deviation of bias) and accuracy of pulse oximeters with conflicting results [3]. Indeed, accuracy of pulse oximeters is dependent on various factors ranging from sensors, patient oximeter interface, optical image stabilization, algorithms used to perfusion and hypoxia status of the patients [3]. In real world studies Accuracy Root Mean Square (ARMS) of pulse oximeters have been shown to overshoot desired limit (3%) in hypoxic conditions and critical care scenario. However, studies have shown conflicting results due to variability in study conditions [4-10].
The conflicting results of bias (positive or negative) and the factors (haemoglobin, lactate, vasopressors and effect of various sensors) associated with the bias have been attributed to retrospective nature of most of these studies which were not aimed to investigate these hypothesis [11-18]. Further, there are other important measures of pulse oximeter performance also, such as sensitivity (percentage of time pulse oximeter is able to correctly pick up true desaturation event and minimize missed events), specificity (percentage of time pulse oximeter is able to correctly pick up non hypoxic events and minimize false alarms) and performance index (defined as percentage of time SpO2 is within 7% of the true SaO2, which have not been addressed by these studies, because of their exclusive focus on bias, precision and ARMS alone. Due to a multitude of pulse oximeters used in these studies, bias and precision have been averaged out as results have been pooled as presented and summarized as such. Since, in a developing country like ours, no clearance is needed to market these devices, once FDA approval is obtained, it also becomes important to assess performance of these pulse oximeters in real life scenarios, to investigate if they meet the requisite standards and claims. There is paucity of studies assessing performance of pulse oximeters in critical care set up in India.
We addressed these flaws by determining performance (sensitivity, specificity, ARMS, performance index), Bland Altman curves and limits of agreement of two pulse oximeters used in our ICU separately at various levels of arterial oxygen saturation. We also planned to evaluate the effect of factors like lactate, vasopressors, perfusion status and blood pressure on bias of pulse oximeters.
Thus, our primary objective was to assess performance parameters of pulse oximeters used in ICU, and to investigate if they met required FDA standards in real time clinical situations as well as to evaluate the factors associated with bias.
Materials and Methods
The present prospective cohort study included a convenient sample of 129 adult patients presenting to emergency room or medical ICU between June 2015 and August 2015.
Inclusion criteria: All patients with age 18-60 years, presenting to ER or MICU with appropriate indications (as indicated by the treating team) were included.
Exclusion criteria: Patients with
Venous blood gas samples,
Pigmented nails
Methemoglobinemia
Recent use of intravenous contrasts for radiological studies
Arterial blood sample was obtained from the radial artery following Allen’s test to confirm adequacy of ulnar artery flow. The syringe lumen was heparinized (0.1 cc of unfractionated heparin) prior to taking blood sample. Air bubbles, if present, were immediately expelled from the sample. The sample was sealed in an iced container and sent to laboratory for analysis using blood gases analyser (AVL 995 Automatic Blood Gases, Graz, Austria). Pulse oximetery was done at same time (preferably on fingers) using two pulse oximeter (Nonin NBP SpO2) (Nonin 9600 pulse oximeter) and Philips (Sure Signs VM8 monitor + Phillips M1191BL sensor).
The finger probe for the unit was placed on the index finger of the opposite arm from which the arterial sample had been taken. In this study, ABG values were be taken as gold standard reference values [3].
Charts were reviewed for evidence of sepsis, use of vasoconstrictors, blood pressure of patient, serum lactate and haemoglobin and these data were collated. Time taken for stabilization of readings was also noted. Only the values from the blood gas sample were used in final analysis. Incomplete data sets, including those arising from pulse oximeter signal failure, were excluded.
Patients were divided in following subgroups based on sepsis, SaO2 <90%, use of vasoconstrictors, SBP <90 and analysis was done. Post hoc tests were not applied for multiple comparisons because of exploratory nature of data analysis.
Sample size calculation
Assuming a difference of biases between 0.5 to be clinically significant and precision to be 2% for each group, sample size was calculated with a power of 80% and at an alpha level=0.05 using matched pair design in G power 3.1 software [19]. Thus, 128 patients would have been adequately powered to discern this difference. We screened 140 patients and included 129 patients in final analysis.
Statistical Analysis
Data was stored in predefined proforma and analysed using SPSS 20.0 (IBM,SPSS), G power and R software package [19,20]. Interaction plots were made using sjPlot R package. Bland and Altman method was used for performing primary analysis and bias (systematic error – mean difference between SpO2 and SaO2), precision (random error-standard deviation of mean difference) were calculated. Limits of agreement were defined at mean difference ±2SD. Correlation plots were drawn between continuous variables to look for significant association. In particular, preplanned subgroup analysis with respect to haemoglobin, lactate, mean arterial pressure and need for vasoactive drugs was done.
Variables were reported as means with Standard Deviations (SD) or medians with Inter-Quartile Ranges (IQR) with respect to their normality. Mean difference (biases) of the two pulse oximeters was compared using the Student’s t-test. A p-value of ≤0.05 was considered statistically significant for purpose of our statistical analysis.
Results
We screened 140 patients for the study, eight patients were excluded because of signal failure and three patients due to nail pigments leading to 129 patients being included in final analysis.
In our population 18.6% (24/129) were on vasopressors, 26.4% (34/129) were suffering from sepsis, 8.5% (11/129) were hypotensive, 51.1% (66/129) patients were male, 17.05% (22/129) patients were hypoxic. Rest of the important demographic variables are summarised in [Table/Fig-1].
Summary statistics of important demographic variables (SpO2 = Pulse oximeter saturation, SaO2 = Arterial oxygen saturation)
| Parameters | N | Mean | SD |
|---|
| Age | 129 | 50.51 | 11.83 |
| Hemoglobin | 129 | 10.07 | 1.95 |
| Lactate | 129 | 2.31 | 2.00 |
| MeanArterialPressure | 129 | 84.54 | 12.30 |
| SaO2 | 129 | 93.88 | 8.70 |
| SpO2.Nonin | 129 | 94.33 | 8.55 |
| SpO2.Philips | 129 | 96.32 | 8.13 |
| Bias.Nonin | 129 | 0.46 | 1.67 |
| Bias.Philips | 129 | 2.44 | 3.04 |
Mean SaO2 and SpO2 across all readings were 93.88 ± 8.68 and 95.33 ± 8.33 respectively. Thus, there was positive bias of 1.45 ± 2.64 and SpO2 tended to overestimate SaO2. Bias worsened with decreasing SaO2. (r=-0.26, p =0.001). Bias, precision and ARMS at various levels of SaO2 has been summarized in [Table/Fig-2]. There was statistically significant difference in bias and between Philips (2.49±2.99) and Nonin (0.46±1.68) pulse oximeters (mean difference=1.98, 95% C.I. = 1.53-2.43, p-value <0.001). The variability was higher (and precision lower) in Philips pulse oximeter than Nonin pulse oximeter (F-ratio=3.23, 95% C.I.=2.34-4.7, p-value <0.001).
Bias, precision and ARMS (Accuracy-root mean square) of individual pulse oximeters and overall (pooled) at various levels of SaO2 (arterial oxygen saturation).
| | Nonin | | | Philips | | | Overall | |
|---|
| Sao2 | Bias | Precision | ARMS | Bias | Precision | ARMS | Bias | Precision | ARMS |
|---|
| 95-100 | 0.19 | 0.93 | 0.94 | 1.21 | 1.66 | 2.06 | 0.70 | 1.44 | 1.60 |
| 90-95 | 0.67 | 0.97 | 1.18 | 3.8 | 2.05 | 4.32 | 1.44 | 2.64 | 3.01 |
| 70-100 | 0.474 | 1.67 | 1.73 | 2.53 | 3.04 | 3.92 | 1.47 | 2.63 | 3.01 |
| 60-80 | 0.66 | 1.35 | 1.51 | 7.66 | 4.95 | 9.12 | 4.16 | 5.03 | 6.53 |
| Overall | 0.46 | 1.68 | 1.74 | 2.49 | 2.997 | 3.89 | 1.45 | 2.64 | 3.01 |
On correlation analysis, bias was significant correlated with SaO2 (r=- 0.32, p<0.001) and lactate (r=0.16, p=0.04). There was no significant correlation between bias and mean arterial pressure (r=0.02, p=0.71). Though patient subgroup on vasopressors had higher bias than those not on vasopressors, it didn’t achieve statistical significance (p=0.06)
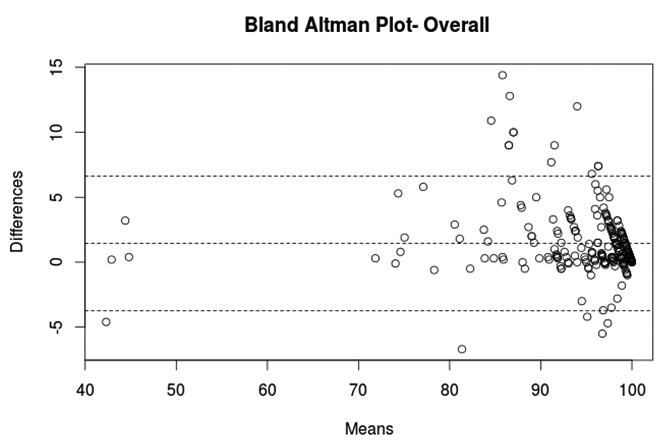
Bland Altman curve was drawn to graphically evaluate agreement between SpO2 and SaO2 for individual pulse oximeters and overall [Table/Fig-3]. Mean difference, 95% lower and upper limits of agreement were as follows for Nonin (0.456, -2.81, 3.72), Philips (2.44, -3.51, 8.39) and pooled pulse oximetry (1.44, -3.72, 6.62).
Bland Altman plot depicting mean difference (Bias) - central line and upper and lower limits of agreement between pulse oximeter oxygen saturation and arterial oxygen saturation.
Philips pulse oximeter took significantly larger time to stabilize than Nonin pulse oximeter. (12.28±3.85 seconds versus 6.73±2.94 seconds, 95% C.I.= 4.70-6.382894, p-value=0.001).
The sensitivity, specificity, negative predictive value, positive predictive value, Kappa (agreement) of Nonin pulse oximeter were 72.73% (16/22), 100% (107/107), 94.69% (107/113), 100% (16/16), 0.815 respectively. The sensitivity, specificity, negative predictive value, positive predictive value, Kappa (agreement) of Philips pulse oximeter were 36.36% (8/22), 100% (107/107), 88.43% (107/121), 100% (8/8), 0.465 respectively. The performance index defined as percentage of readings with bias less than 7 (absolute difference between pulse oximetry and arterial saturation less than 7) was 98.44% (127/129) in Nonin group and 92.24% (119/129) in Philips group. Thus, Nonin pulse oximeter performed significantly better than Philips pulse oximeter on majority of performance indicators. Overall (pooled) sensitivity, specificity, negative predictive value, Performance index, and Kappa were 54.54% (24/44), 1005 (214/214), 91.45%, 95.34% (246/258), 0.66 respectively. On changing cut off for Hypoxia to 92%, significant gains in sensitivity of both Nonin (100%: 22/22) and Philips (72.73%: 16/22), increased with some decrease in specificity of Nonin (90.65%: 97/107) and Philips (98%: 106/107) pulse oximeters respectively.
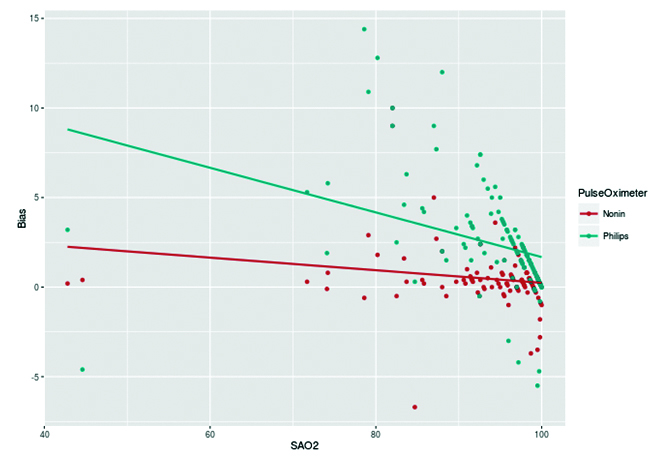
Bias of both the pulse oximeter increased with decreasing arterial oxygen saturation. However, the bias in Philips pulse oximeter increased rapidly with higher slope [Table/Fig-4].
Regression lines depicting relation between bias and oxygen saturation for Nonin and Philips pulse oximeters.
Discussion
Our study shows that pulse oximeters overestimate true arterial oxygen saturation in ICU with a mean positive bias of 1.44% and limits of agreement being from -3.72% to 6.62%. There was also a significant heterogeneity in performance of pulse oximeters in real world situations as reflected in with Nonin pulse oximeter significantly outperforming Philips pulse oximeters used at our set up. The bias in pulse oximeters increases with decreasing arterial oxygen saturation (r=- 0.326). Other patient markers of tissue hypoxia like lactate impacted the accuracy of pulse oximeters (r=0.16).
Our study shows that pulse oximeters in ICU overestimate arterial oxygen saturation at all ranges of true arterial oxygen saturation [Table/Fig-2]. With decreasing saturation, both bias and variability (lack of precision) increased. Our findings with a positive bias of 1.44% are consistent with studies by Lee W et al., Seguin P et al., and Wilson BJ et al., [6-8], which showed a mean positive bias of around 2%. However, some studies showed that pulse oximeters underestimated SaO2 (2.8, 2.9, 1.1, 1.5, 1.8, 1.9). The discrepancy found in these studies could be due to the fact that different pulse oximeters were used in these studies and bias is known to be pulse oximeter specific. In our study, both of the pulse oximeters overestimated arterial oxygen saturation thereby showing positive bias which increased at low levels of oxygen saturation (r =-0.32).
While overall ARMS of our pulse oximetry just met prescribed FDA limit of 3%, one pulse oximeter (Philips) consistently had ARMS >3% once SaO2 fell below 90%. It goes on to show that many pulse oximeters are not meeting requisite ARMS guidelines.
Performance characteristics like sensitivity, specificity, NPV, performance index of Nonin pulse oximeter was significantly better than Philips pulse oximeter. However, sensitivity of Nonin and Philips in picking up true desaturation (defined as SpO2 <90%) were 72.72% and 36.36% respectively. Thus, almost one fourth and two third cases of true hypoxia might be missed even though pulse oximeters might be meeting FDA guidelines for bias, precision and accuracy. Thus, it is instructive, to not rely upon a single value (SpO2 90%) as a marker of hypoxia. Further, since most pulse oximeter tends to overestimate SaO2 by around 2% as discussed a higher target of 92% might be mandated as to predict true hypoxia. Thus, on reanalysing with an increased cut of 2% (92%) sensitivity of Nonin pulse oximeter increased to 100% while that of Philips pulse oximeter increased to 72.73% with limited reduction in specificity. The pooled sensitivity increased to 86% from 54.54%; thus, reducing almost one third number of missed cases in total on adjusting for positive bias of 2%.
Low oxygen saturation increased bias in our study. Hypoxia causes increase in reduced haemoglobin causing error in absorption ratio and increase in bias. There is also a lack of calibration data at low oxygen saturation leading to increased error in low range of SaO2. Blood lactate levels were directly proportional to bias in our study. Lactate is a marker of tissue hypoxia. Tissue hypoxia causes arteriolar dilation which leads to pulsatility being transferred to veins via capillary beds. The venous pulsatility introduces a component of error and increasing bias as pulse oximeters are known to rely only upon analysis arterial pulsation for calculation of oxygen saturation [2,4,5]. Though, use of vasoactive agents and anaemia have been linked to increase in pulse oximetry error, they were not associated with increase in bias in our study.
Time to stabilization depends upon signal averaging time, perfusion filter and handling of artefacts. The recommended guideline suggests that time to stabilization be less than thirty seconds, though default mode is set at 10 second [2]. In our study, both of our pulse oximeters met these guidelines with Nonin oximeter signal stabilizing at six seconds.
Pulse oximeter accuracy depends upon various factors machine related (pulse oximeter sensor, monitor, optimal image stabilization, algorithms), patient geometry, pigmentation and patient’s physiological states (hypoxia, lactate, vasopressor, acidosis, anaemia) [3,4]. Given the multitude sources of error, it has been rightly suggested we should not rely upon a single cut off and a single reading to take important clinical decisions. FDA guidelines of ARMS of 3%, while a good measure of pulse oximeter accuracy has to be supplemented by other measures of pulse oximeter performance like sensitivity, stabilization time, performance index and drop out rate in real world scenario. It has also been recommended that remedial measures like regular calibration of pulse oximeter, checking for sensor accuracy be done routinely.
Our study has many strengths, it was prospectively done with an aim to assess effect of physiological variables on pulse oximeter bias. We also took into account heterogeneity of pulse oximetry use in ICU and assessed their performance separately as well as in pooled fashion. We also determined various other recommended measures of pulse oximeter performance like performance index, sensitivity, specificity in addition to bias, precision, accuracy at different ranges of SaO2. We analysed if the pulse oximeters met the required ARMS and time to stabilization guidelines in our set up. However, our study did not control for patient skin colour, inspiratory pressure, pCO2, temperature which might be other source of biases.
Conclusion
In conclusion pulse oximeters tend to overestimate arterial oxygen saturation in ICU. There is lot of heterogeneity in performance of pulse oximeter, they often exceed their recommended ARMS range in real world scenario. Hence, relying on a single reading or cut off like SpO2 <90% might lead to missing out on a lot of cases of true hypoxia. Thus, though overall pulse oximeters are great monitoring tools, clinicians should not rely upon a single reading, regularly calibrate and check their pulse oximeters and when in doubt or specially in lower oxygen saturation range (SaO2 70%-90%) perform an arterial blood gas to estimate true arterial oxygen status in view of multiple sources of bias.
Disclosure
There was no commercial association with either of the pulse oximetry companies involved with the study. Study was designed with aim to measure accuracy of pulse oximeters in ICU and was conducted after taking clearance from ethical committee from in-house pulse oximeters.
All patient data has been adequately collected with proforma and will be submitted on request. An Excel sheet containing the key parameters has been appended with manuscript. I, Anupam Kumar Singh, act as guarantor of the data.