Measurement of RNFLT is a novel test in opthalmology, useful in a variety of conditions. It is done using a technique called OCT. OCT is a computerized technique which measures the RNFLT in vivo [1]. A near-infrared beam is passed into the eye and its reflectivity pattern is studied [2]. This technique is easy to operate, reproducible, non-invasive and gives an objective measurement [1]. It produces a high-resolution cross-sectional image of the retina in the posterior pole which can be used to determine localized thinning or thickening [1]. Thus, it is a sensitive technique for early detection of incipient retinal changes in a variety of diseases [1].
The thinning of the retina in HIV progresses with time and decline in CD4 count [6,7]. Hence, if early diagnosis and treatment of HIV is instituted, this decline in visual functions can be thwarted. Early diagnosis of the visual impairments can also help in future career planning for the patients.
Materials and Methods
The present cross-sectional study was done in a tertiary care medical college hospital of Eastern India between May 2016 and September 2016. This particular institution has the separate regional referral centres for ophthalmology as well as HIV infection in Eastern India. Hence, a large patient pool was potentially available. The Institutional Ethical Committee was informed of the detailed study protocol and full ethical permission was obtained prior to embarking on the study. The ethical guidelines for study on human subjects, laid down by ICMR, were strictly followed [10].
Sampling was done from the registered HIV patients of the ART centre of the institution. People <60 years of age only were considered to avoid the confounding effect of age related retinal changes. The names of the registered patients were arranged in serial order. Then, random numbers were generated using Microsoft Excel and the corresponding patients were selected. The potential subjects were explained about the study in their own language. Only those who chose to take part voluntarily were selected. The patients were examined clinically first and direct ophthalmoscopy was done to rule out any retinal infection or other pathology. Patients with ocular disorders like glaucoma or any congenital ocular disease were excluded. Also, anyone with systemic disorders like diabetes, hypertension or recent use of oculotoxic drugs like chloroquine was excluded from the study. Our exclusion criteria also included anyone with prior history of posterior segment surgery or laser therapy.
RNFLT was measured using the HRA-OCT Spectralis machine (Heidelberg Engineering, Germany, 2011). Software for analysis was the Heidelberg Eye Explorer, available with the machine. All the study subjects were examined by the same machine operator. The testing was done on undilated eye. A circular area of 3.4 mm diameter around the optic nerve head was analysed. The angle of infra-red rays and the depth of analysis were auto-adjusted by the machine. Each reading was an average of three consecutive readings by the machine. Average resolution was 3 µm. All the output cross-sectional images were inspected by the authors and only those images which were free of significant artefacts or distortion were included in the study.
Based on normative Indian data, the output from the analysing software automatically classified the RNFLT ordinally as normal (green), borderline (Yellow) and thin (Red).
Contrast sensitivity was examined using Pellie-Robson chart. However, in this study, we used a smartphone version of the chart, as available in the free application, EyeHandbook ™. We made this improvisation as the original Pellie Robson chart is very costly. The chart was displayed full screen in a 7-inch smartphone with maximum background illumination and was held at the near point of vision of the subject. The near point was first determined by suitable clinical examination. In this chart, the logarithm of the contrast sensitivity is recorded and a higher value equates with better sensitivity. A cut off of ≥1.5 was considered as normal [11].
Visual acuity was determined by Snellen chart (6 m) and colour vision was determined by Ishihara chart using standard procedures. All these examinations were done by the same investigator for all patients. For all the study subjects, each eye was tested separately.
The CD4 count was done at the ART centre in the same machine for all patients.
Statistical Analysis
The data was entered into SPSS version 20.0 software. Suitable analyses were done using appropriate statistical tests. For continuous variables, Pearson coefficient was calculated in correlation analyses. For discrete variables or ordinal data, Spearman coefficient was used. The p<0.05 was considered significant.
Results
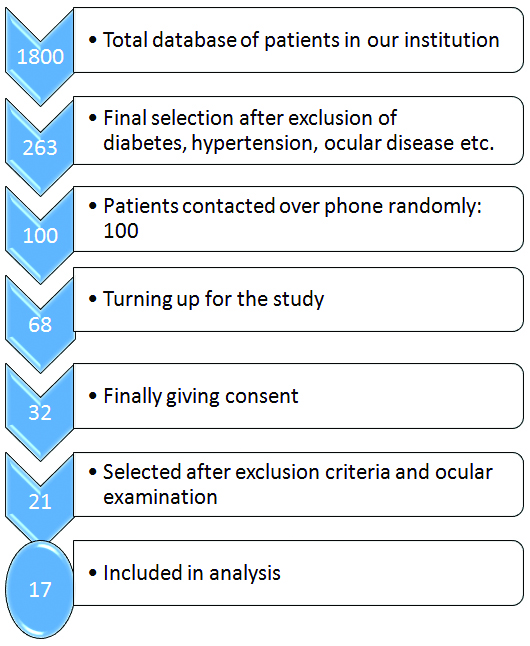
We initially selected 32 patients. After considering the exclusion criteria, 21 patients were finally taken for the OCT [Table/Fig-1]. But in four cases, the output images were distorted. Thus, finally in our study, we had 17 patients, which is 34 eyes. The average age of the study subjects was 33.5± 11.6 years with a range of 14 to 56 years. Male: female ratio was 12: 5. The CD4 count of the subjects ranged from 181 to 1256/µL with a mean CD4 count of 527± 290/µL. All of the patients were on suitable ART.
Flow diagram showing the selection of patients for our study.
The mean of log CS was 1.33±0.38. Taking 1.5 as the cut off, 16 eyes (47%;95% C.I. 30.2%,63.8%) were found to have low CS.
[Table/Fig-2] shows the visual acuity in the study subjects. As seen here, 50% of the eyes (n=17) had normal (6/6) visual acuity. Significantly low visual acuity (≥ 6/18) was present in only 23.5% of the eyes (n=8). However, in all cases with less than normal visual acuity, vision was correctable with suitable lenses.
Table showing the visual acuity of the study subjects.
| Visual Acuity | Number of Eyes |
|---|
| 6/6 | 17 |
| 6/9 | 6 |
| 6/12 | 3 |
| 6/18 and higher | 8 |
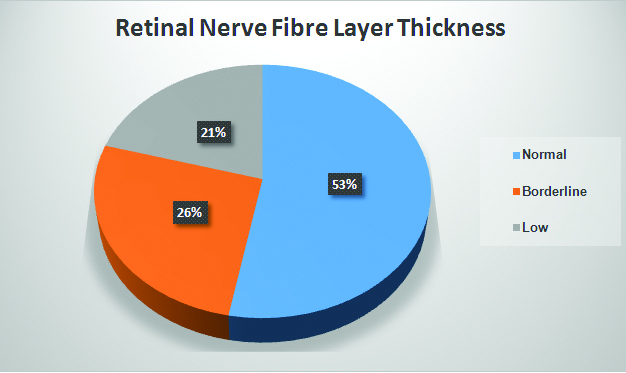
As [Table/Fig-3] shows, frank RNFL thinning was found in 21% of the eyes (n=7) and “borderline” thinning was present in 26%. Out of the 17 patients in the study, two had bilateral RNFL thinning and three had unilateral thinning. Out of the seven eyes which showed RNFL thinning, 5 (71.4%) showed only temporal quadrant thinning, one showed nasal quadrant thinning and one showed both temporal and nasal quadrant thinning. Out of the nine eyes where borderline thinning was present, 7 (77.8%) showed a temporal quadrant lesion.
Pie chart showing the distribution of RNFLT in study eyes.
The average RNFLT in the right eye was 98.7±9.6 µm and that in the left eye was 96.2±11.2 µm (p>0.05 by Student t test).
All the study subjects showed normal colour vision except two male subjects with red-green blindness.
Correlation study showed that there was no statistical correlation between the CD4 count and log contrast sensitivity (LCS) (r=0.178; p=0.49). LCS showed a negative correlation with age (r=-0.37) but did not reach statistical significance (p=0.14). Pearson rank correlation coefficient analysis showed that the LCS had a positive correlation only with absolute RNFLT of the temporal quadrant (r=0.37; 95% C.I., 0.041 to 0.631; p=0.02) [Table/Fig-4]. Thus, lower the RNFLT in temporal quadrant, lower the LCS. However, the correlation between average peripapillary RNFLT and LCS (r=0.24) was not statistically significant (p=0.16).
Table showing the correlation coefficients of log CS with RNFLT In different quadrants.
| Area | Average RNFLT In μm | Mean log CS | Correlation coefficient | p-value |
|---|
| Temporal | 66.6±17.8 | 1.33±0.38 | 0.37 | 0.02 |
| Nasal | 75.1±20.6 | 0.13 | 0.47 |
| Superior | 127.8±13.5 | -0.08 | 0.62 |
| Inferior | 120.5±22.8 | 0.09 | 0.6 |
| Average of all | 97.5±10.4 | 0.24 | 0.16 |
Test used: Pearson correlation coefficient
When the RNFLT is expressed as ordinal data (normal, borderline, low in that order) the correlation coefficient between LCS and this ordinal RNFLT is -0.29 (95% C.I., -0.57 to 0.056).
The absolute RNFLT of the temporal quadrant of the eyes also showed a significant correlation with CD4 count (r=0.36; 95% C.I., 0.024, 0.621; p=0.03).
There was significant correlation between LCS and visual acuity (expressed as ordinal data) (r=-0.5; 95% C.I., -0.79, -0.03; p=0.04). There was no statistical correlation between visual acuity and RNFLT, either average or of individual quadrants.
Discussion
In our study, we found that a large proportion of the eyes in HIV positive persons had low contrast sensitivity. Also, a large proportion of the subjects had RNFL thinning. This was predominantly localized to the temporal quadrant of retina. CS was significantly correlated with temporal RNFLT and visual acuity. The temporal RNFLT showed a weak correlation with CD4 count. However, CS did not show any correlation with the CD4 count.
In a similar study from South Africa, a significant proportion (43.5%) of HIV infected individuals was found to have low CS [12]. However, in that study, the authors had used a cut-off of 1.65 by Pellie-Robson chart to categorise as “poor CS”. In our study, we used a cut-off of 1.5, as is more commonly used [13]. Study of the predictors of low CS in HIV has yielded varying results. While some studies have found a significant correlation between the CS and HIV viral load, other studies failed to find any correlation with any factor [12,13].
Using other methods of measuring CS, also showed a similar trend of low CS in HIV infected individuals [14]. In this latter study, low CS was correlated to a falling CD4 count. In our case, there was no correlation between the CS and CD4 counts.
Thinning of the RNFL is a known ocular complication in HIV infection [15]. This is said to occur due to axonal degeneration [15]. Some authors have marked this as a manifestation of wider neuro-retinal degeneration that occurs in HIV [12]. Certain host factors, besides the virus related damage, may also be responsible for these degenerative changes [15]. In a study from USA, 17.6% of the eyes studied showed RNFL thinning. In our study, thinning was present in 21% of the eyes with a further 26% showing borderline values. The authors of the USA study found a significant correlation between temporal RNFLT (r=0.295) and log CS [15]. In our study, a similar result has been obtained. Since, temporal quadrant contains the macula, alterations in the RNFL of this area will, logically, have effect on essential visual functions like CS.
The predilection for RNFL thinning to affect the temporal quadrant has been found in other studies too. In our previous study too, a significant proportion of subjects with borderline or low values had temporal quadrant involvement [8]. The exact reason for this asymmetry is not fully known. But, some authors have hypothesized that the papillomacular bundle and its surrounding area in the temporal quadrant may be more susceptible to damage due to the low volume to surface area ratio of the axons there [15]. Thus, they may be more susceptible to energy deficits and eventual cell death [16]. This theory was first applied to Leber hereditary optic neuropathy, but is now thought to be applicable for HIV retinopathy as well [15].
But, some other studies have found low RNFLT in all quadrants of retina [15]. This is particularly true for children with HIV [17]. Since our study is only on adults, we cannot comment on this difference. A recent study found a generalized decrease in photoreceptor density in the retina of HIV infected subjects [3].
These results show that instead of the commonly used visual acuity testing, a more comprehensive testing protocol should be adopted for HIV positive individuals, especially when screening for occupations like driving. In a recent study, where HIV positive individuals were divided into four groups based on low/high CD4 count and low/high RNFLT, the group with low CD4 and low RNFLT had the worst visual performance [6]. Thus, as a practical guide, for professions like drivers, both CD4 count and RNFLT should be used as predictors of poor performance.
Visual field is another parameter that is found to be affected in HIV infection [15]. However, the pathophysiology of that disorder is likely to be different from that of alteration in CS as visual field is affected in peripheral retinal degeneration. Hence, we did not include it as a study variable.
In our study, we found a significant correlation between CS and visual acuity. A similar result has been obtained from studies done in other continents too [14,18]. Usually disorders of visual function occur concurrently and this may be a part of the greater problem of silent neurodegeneration in HIV infection.
There are some limitations in our study. As this is a cross-sectional study, we can only establish an association. But, a true cause-effect relationship can only be established after a longitudinal study. Also, the sample size is quite small. Finally, there is also scope for improvement in the method of testing CS and colour vision. However, in a resource limited setting like ours, such criteria are often difficult to meet.
Conclusion
Significant ocular damage can occur in HIV infection before clinically apparent manifestations or opportunistic infections. This may have dire consequences for the subject and lead to considerable handicap. Hence, eye testing in HIV infection should include modalities like CS and OCT from an early stage.
Test used: Pearson correlation coefficient