Anaemia is the most common nutritional problem in the world. It is one of the leading causes of disabilities [1]. Anaemia at any age has significant negative impact on the health of an individual varying from poor scholastic performance and cognitive impairment in children to one of the major indirect causes of maternal mortalities [2].
The initiative to control anaemia started in India early in 1970 with National Nutritional Anaemia Prophylaxis’s programme (NNAPP) [3]. It was focused to improve the nutritional anaemia in children aged 1-11 years and women of child bearing age. In 1991, NNAPP was renamed as NNACP with new strategies to control nutritional anaemia. However, many evidences show that anaemia control program is not performing well in the country, due to various reasons [4]. Considering the magnitude of damage anaemia can cause to the individual and the community on one hand and clear cut mechanisms available for its control on the other, it is highly unacceptable to have anaemia when the nation is striving for sustainable development goals.
Kerala, a state in southern India, has a reasonably strong primary healthcare system with a good infrastructure of primary health centres [5]. Despite having a low per capita income, its social development indicators are at par with that of many developed countries.
One of the recent initiatives implemented in Kerala was supplementing weekly iron and folic acid tablets at schools [6]. Kerala is developing state specific targets for sustainable development goals related to health. It is important to know the exact prevalence of anaemia in the state and the trend in the prevalence of anaemia to further plan targeted interventions. There are many published studies and reports on anaemia in the state, but with a wide variation in the results. In this context, a systematic review was undertaken to find out the prevalence of anaemia and to identify the trend in the prevalence of anaemia in the state.
The aim of the review was to identify the prevalence of anaemia in Kerala and to comment on its trend across last 25 years.
Materials and Methods
The review was conducted based on the PRISMA guidelines [7]. A review protocol was developed, with search strategy and data collection methods. Population, Intervention, Comparison, Outcomes, and Setting (PICOS) elements to identify search terms were developed based on review questions. The PICOS identifiers in the research questions and related terms were used to search the Medline [Table/Fig-1].
PICOS identifiers from research questions (’key terms’) and database- and thesaurus- derived alternatives (’additional terms’) used to generate database searches.
| Variable | P | I | C | O | | S |
|---|
| Key terms | All population in Kerala | NA | NA | Prevalence | Anaemia | All |
| Additional terms generated | Kerala | NA | NA | Prevalence, rates, proportion, magnitude* | Anaemia, Iron deficiency Haemoglobin* | All |
indicate where all database terms based on the attached stem were included. Terms within each column were distinguished using the OR function and terms in different columns were combined using the AND function.
The search was carried out on 25th September 2016 and all studies including descriptive, cross-sectional, cohort and RCTs were included irrespective of the publication type (original article, short communication or letter to editor). Only studies published since 1990 to 2015 were included as our interest was in the recent situation, and earlier publications were difficult to access. Since the number of publications was less, we also searched Google scholar to find out more publications. Reference lists of included papers, as well as review articles/editorials identified in the searches, were scanned. We also looked for reports of major health surveys conducted in concerned websites and also in Google search engine.
Community based studies from any area of Kerala were included in the review. Studies of hospital/clinic-attending populations and studies focussing on any particular type of anaemia other than iron deficiency anaemia (e.g., sickle cell anaemia) were excluded. To determine study eligibility, the titles and abstracts of all search results were screened. Studies accepted at this point were reviewed fully. For papers of which full text were not freely available, concerned corresponding authors were contacted with a request to the full paper. Exclusions were made according to the criteria above and where the available data were not anaemia specific.
Two separate proformas were used to extract the quality related data and basic study data. Quality was assessed using the checklist based on centre for reviews and dissemination, University of York [7]. Checklist included information on clear objectives, appropriate methodology including design, adequate sample size, sampling techniques and data collection, appropriate analysis, risk of bias in selection and limitations discussed. Good, poor and not assessed were marked for each item in the checklist. Prevalence data was recorded separately for under five children, children 5-10 years, adolescents 11-19 years, pregnancy, lactation, women in reproductive age group 15-49 years and tribal groups. Grading was done for extracted quality data. When there was a major reason for concern regarding the validity of the study along with more than four out of eight ‘poor’/’not assessable’ ratings in the checklist, the study was excluded. The data were summarised in tables.
Results
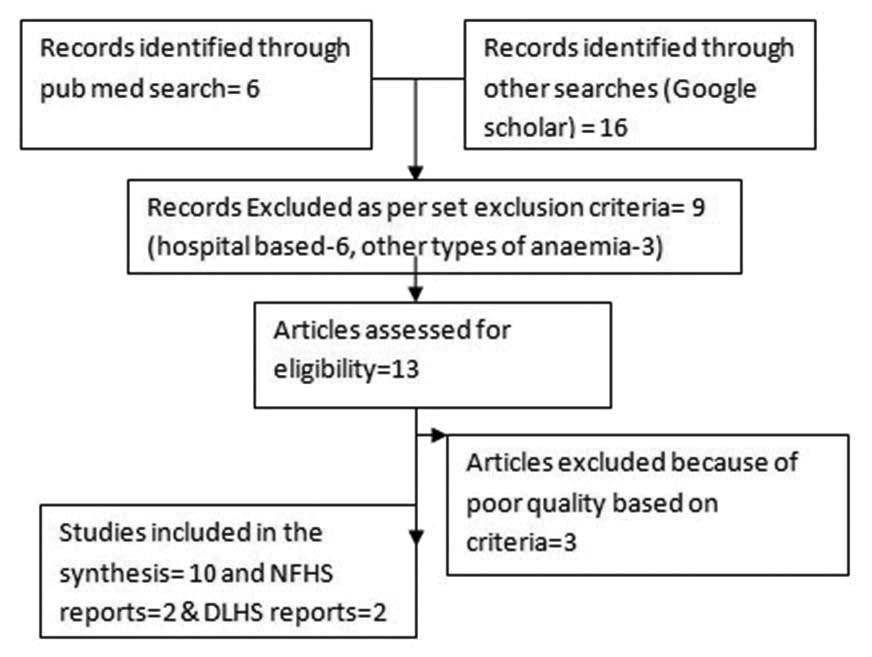
A total of 10 studies in addition to two major survey reports- NFHS and DLHS were included in the final analysis [8-19]. The details of search and studies included were given in [Table/Fig-2].
Flowchart describing details of papers included in the review.
All the studies focussed on a particular age group and none had reported prevalence in general population. There was one study among preschool children [10], one among tribal preschool children [15], one among 4th standard students [11], two among school children [12,14], one among medical students [13], two among women in tribal areas [18,19], one including pregnant women [16]. and one among women in reproductive age group [17]. Two studies done among adolescent school children included boys also [12-14]. NFHS-2 included assessment of anaemia among children 6–35 months of age and ever-married women 15–49 years of age. Anaemia testing was also done for men in NFHS-3. Anaemia testing was done for children, girls and women in DLHS-2, but not in DLHS-3. DLHS-4 included anaemia testing for children six months or older as well as women and men [8].
Most of the studies were focussed on a particular geographic area. Only the NFHS and DLHS surveys and studies by Agarwal KN et al., and Premananda Bharathi et al., involved participants from more than one district [16,17]. Variability of the techniques used to estimate anaemia among the studies made it difficult in estimating pooled anaemia prevalence. NFHS used Hemocue method for haemoglobin estimation while DLHS used Drabkin’s method using capillary blood for haemoglobin estimation. Six out of the ten studies [10,11,15,16,18,19] reviewed used cyanmeth haemoglobin method, one [12] used Sahli’s technique, one used sysmex auto analyser [13] and two [14,17] studies used hemocue method for haemoglobin estimation.
Cut offs used for defining anaemia was less than 11 g/dl for pregnant women and less than 12 g/dl for non-pregnant women in all studies, but DLHS-4 used a standard cut off of 11 g/dl for all age groups. Cut offs for defining anaemia among children and adolescents were according to WHO criteria (11.5 g/dl for children between 5-11 years, <12 g/dl for adolescent girls, <13 g/dl for adolescent boys) [20], Also cut offs for severe anaemia used were different in many studies which made it difficult to compare.
The details of anaemia prevalence from NFHS and DLHS reports were compiled in [Table/Fig-3].
Trend in the prevalence of anaemia in Kerala- results from NFHS and DLHS surveys.
| Variable | Under five children | Adloscent girls | pregnancy | Women in reproductive age group |
|---|
| NFHS-2 (1998-99) [9] | 43.9% | NA | 20.3% | 23.2% |
| NFHS-3 (2005-06) [9] | 44.5% | NA | 33.8% | 33% |
| DLHS-2 (2002-04) [8] | 59.6% | 90.4% | 90.1% | NA |
| DLHS-4 (2012-13 [8] | 48.5% | 31.3% | 34.6% | 32.7% |
NFHS data showed an increase in the prevalence of anaemia during pregnancy and women from 1998 to 2005. Even though DLHS data showed a drastic decline in the prevalence of anaemia in all age groups over 2002 to 2012, the cut off for DLHS-4 was different.
The details of studies including the year, study population, sample size and the technique used for haemoglobin estimation were compiled in [Table/Fig-4,5].
Studies on anaemia prevalence among children and adolescents in Kerala.
| Author | Year | Total sample | Study population | Method of Hb estimation | Prevalance of anaemia |
|---|
| Male | Female |
|---|
| George KA et al., [10] | 1996 | 3633 | Preschool- Anganwadi | Cyanmeth hemoglobin method (Indirect) | 10.25% | 12.55% |
| Manjula AA et al., [11] | 2003 | 865 | 4th standard school student- Calicut | cyanmeth hamoglobin (Indirect) | NA | 44.2% |
| Rakesh SR et al.,[12] | 2012 | 4813 | School children, Chithara Panchayat Kollam (5019 yrs) | Sahli’s | 67% | 77.5% |
| Manjula VD et al., [13] | 2013 | 183 | Female medical student Kottayam | Sysmex | NA | 19.1% |
| Rakesh PS et al., [14] | 2014 | 3200 | Adolescent School children, Kollam district | Hemocue | 301 | 31.2% |
| Philip RR et al., [15] | 2014 | 438 | Tribal pre-school children, Wayanad | Cyanmethhem oglobin (Indirect) | 95.7% | |
*separate values not available
Studies on anaemia prevalence among women in Kerala.
| Author | Year | Total sample size | Study population | Method of hameglobin estimation | Prevalece |
|---|
| Agarwal KN et al., [16] | 2005 | 244 | Pregrnant women- multi sage sampling | Cyanmeth haemoglobin (Indirect) | 57.8% |
| Bharti P et al., [17] | 2013 | 346 | Tribal women- Palakkad district | Cyanmeth haemoglobin (Indirect) | 22.4% |
| Sreelekshmy PR et al.,[19] | 2010 | 346 | Tribal women Palakkad district | Cyanmeth haemoglobin (Indirect) | 78.3% |
| Srinivasa BN et al., [18] | 2013 | 347 | Tribal women of 15-45 years of age - non pregnant, non lactating -Wayanad District | Cyanmeth haemoglobin (Indirect) | 96.5% |
Studies used Hemocue and Sysmex auto analyser method generally reported a lower prevalence of anaemia as compared to those used Drabkin’s method (cyanmethhaemoglobin) in corresponding age groups. Prevalence of anaemia among adolescents from recent study reports was around 31% and when applying WHO cut offs, there appears to have no gender difference [14]. Anaemia among tribal women and children were in the range of 78.3% to 96.5% [15,18,19]. The proportion of severe anaemia reported in all studies among school children and adolescents were less than 1% [10-15].
Discussion
A key finding of this review was the paucity of data and inconsistency in haemoglobin estimation methods and population characteristics. Because of these issues, we were unable to give an accurate estimate of anaemia prevalence or to draw conclusions regarding time trends of anaemia prevalence. We were not able to give any prevalence estimates with measures of confidence.
The proportion of severe anaemia among school children and adolescents in general population were less in recent studies as compared to studies published during 1990-2000. This gives an impression that the prevalence of anaemia is declining in the state, though there are no conclusive data to substantiate this. However anaemia among tribal women and children were much higher in the range of 78.3% to 96.5%.
Haemoglobin level is a surrogate indicator of the available iron in blood. Iron deficiency anaemia lies at the extreme low end of the iron status spectrum. Several studies have found differences in the haemoglobin results estimated by different methods. The International Nutritional Anaemia Consultive Group (INACG) and International Committee for Standardization in Haematology (ICSH) have recommended the direct cyanmethhaemoglobin as the method of choice and have suggested that all other methods should be adjusted to be comparable to this method [21,22]. However, Sari et al., found that indirect cyanmethaemoglobin method overestimated anaemia when compared to the direct cyanmethaemoglobin method [23].
The Sahli’s method has many disadvantages including subjective visual colour comparison. It is not sufficiently accurate because it shows wide scatter in interobservers and intraobserver results distribution. Sahli’s method had good sensitivity in detection of anaemic individuals, but low specificity and high rate of false positive results, which may leads to diagnosing healthy individuals as anaemic [24,25].
Many studies showed that haemoglobin levels measured by the Hemocue method are comparable with those determined by both the cyanmethaemoglobin and automated haematology analyser (Sysmex KX-21N) methods [23,26-28]. Some studies have shown that the Hemocue method overestimates the value of haemoglobin [29].
Though, there exists significant variation in anaemia estimates due to differences in methodologies and estimation techniques, all studies have shown a high proportion of anaemia. So itself efforts to urgently address the problem are required. WHO/UNICEF strongly advocate that when there is a prevalence of anaemia above 40%, a universal supplementation is required and it is not cost-effective to screen children for anaemia [20]. But latest estimates from Kerala regarding prevalence of anaemia among school children and adolescents showed it to be less than 40%. Do we need to universalise iron supplementation in the state need to be discussed.
Limitation
Even though through our systematic approach, we have identified most of the available data, there might be many unpublished results and results not available online regarding anaemia prevalence. We accessed only PubMed and Google scholar. The review was also constrained by the subjective assessment of quality assessment. Although, the data were not suitable for meta-analysis, the systematic approach is a useful and clear method for providing a data summary and clearly demonstrating where gaps exist. Accurate estimates of current anaemia prevalence are required for devising optimal strategies to mitigate the problem. In order to obtain a better understanding of the prevalence of anaemia in Kerala, it would be useful to use prospective and standardised data collection – preferably from samples of the entire population, including those that do not typically access healthcare – to assess prevalence and time trends.
Conclusion
The current prevalence of anaemia in Kerala is unclear. Though, there are many studies and reports regarding prevalence of anaemia in the state, those results could not be combined due to non uniform haemoglobin estimation methods. Standardised prospective study of general population including subgroups will be necessary.
*indicate where all database terms based on the attached stem were included. Terms within each column were distinguished using the OR function and terms in different columns were combined using the AND function.
*separate values not available