Harmonious facial aesthetics is considered as one of the goals of orthodontic treatment. Angle was the first who gave importance to the soft tissue profile [1]. He believed malocclusion could annihilate the profile of an individual. Anthropologists have measured the human skull and face for more than 100 years [2]. In 1931, Broadbent from USA and Hofrath from Germany introduced roentgenographic cephalometrics, which provided a method of obtaining the measurements of cranio-facial anatomy [3]. Today in clinical practice, cephalometrics constitutes a gold standard method [4] in obtaining information about the relationship between skeletal and dental structures but it might not be practical for large-scale epidemiologic studies. One of the major drawbacks of cephalometric radiography is the radiation dose absorption and secondly, landmark identification and evaluation of soft tissue measurements from frontal cephalograms. Where cephalometrics provided only hard tissue measurements and lateral soft tissue analysis, advent of a method for evaluation of frontal soft tissue characteristics was required. Other than cephalometric analysis, various other methods were used like anthropometry, two dimensional or three dimensional photogrammetry (scanning digital 3D photogrammetry) and three dimensional methods such as laser surface and three dimensional imaging techniques. Out of the methods mentioned two-dimensional photogrammetry has proved to be a quick, basic, non-invasive and cost-effective method which provides a permanent record of the face that can be accessed later. Photogrammetry is a science of making measurements from photographs. The method was developed by Sheldon WA and introduced in the field of orthodontics by Stoner MM who compared pre- and post- treatment profiles photographs of 34 patients exhibiting Class II div 1 and 2 and Class III malocclusion with ideal profiles [5,6]. Numerous studies have been conducted on comparing reference distances of soft tissue with that of lateral cephalograms [7-10]. The reliability of landmarks by superimposing the photograph and lateral cephalogram was evaluated by Philips C et al., [11]. They found drawbacks with the superimposition method because of lack of standardization in recording the photographs and magnification factor in cephalograms.
Studies comparing frontal photographs with frontal radiographs and comparing them with direct measurements have not been undertaken till date as a recent literature search in databases like PubMed and the Cochrane Review did not show results.
The aim of this study was to compare linear photogrammetric measurements taken from standardized frontal facial photographs of Indian population with measurements taken directly from the subject’s faces and frontal cephalograms.
Materials and Methods
A cross-sectional study was carried out in the Department of Orthodontics and Dentofacial Orthopaedics, Army College of Dental Sciences, Secunderabad from 21st August 2016 to 28th November 2016 among 30 individuals between 18-25 years. The study protocol was approved by the Institutional Ethics Committee of Army College of Dental Sciences, Secunderabad, Telangana, India. The procedure was explained to the patients and a written consent was obtained from them. Standardized frontal cephalograms and photographs were obtained from all subjects. Subjects with Class I occlusion and well-balanced faces of Indian origin with BMI under normal range (18.5–22.9 kg/m2) were included. All teeth were present till first molars. Subjects with facial and/or dental asymmetry on visual examination, history of orthodontic or orthognathic treatment and history of craniofacial trauma or congenital anomalies were excluded from the study. A brief questionnaire to determine the state of residence and origin of the patient was obtained.
Photographic Procedure
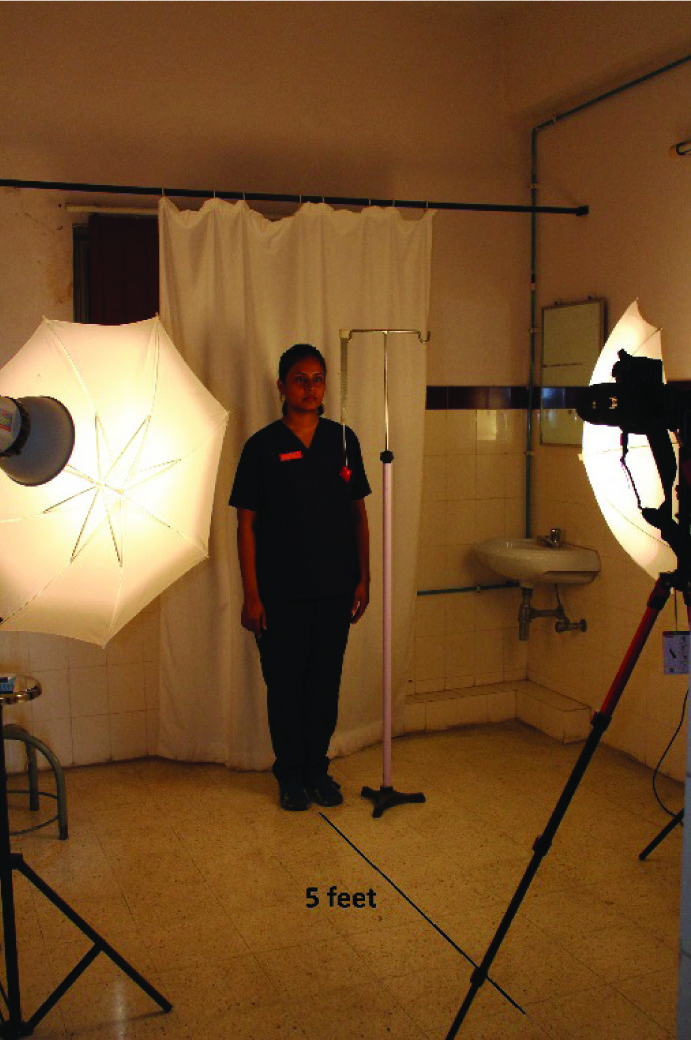
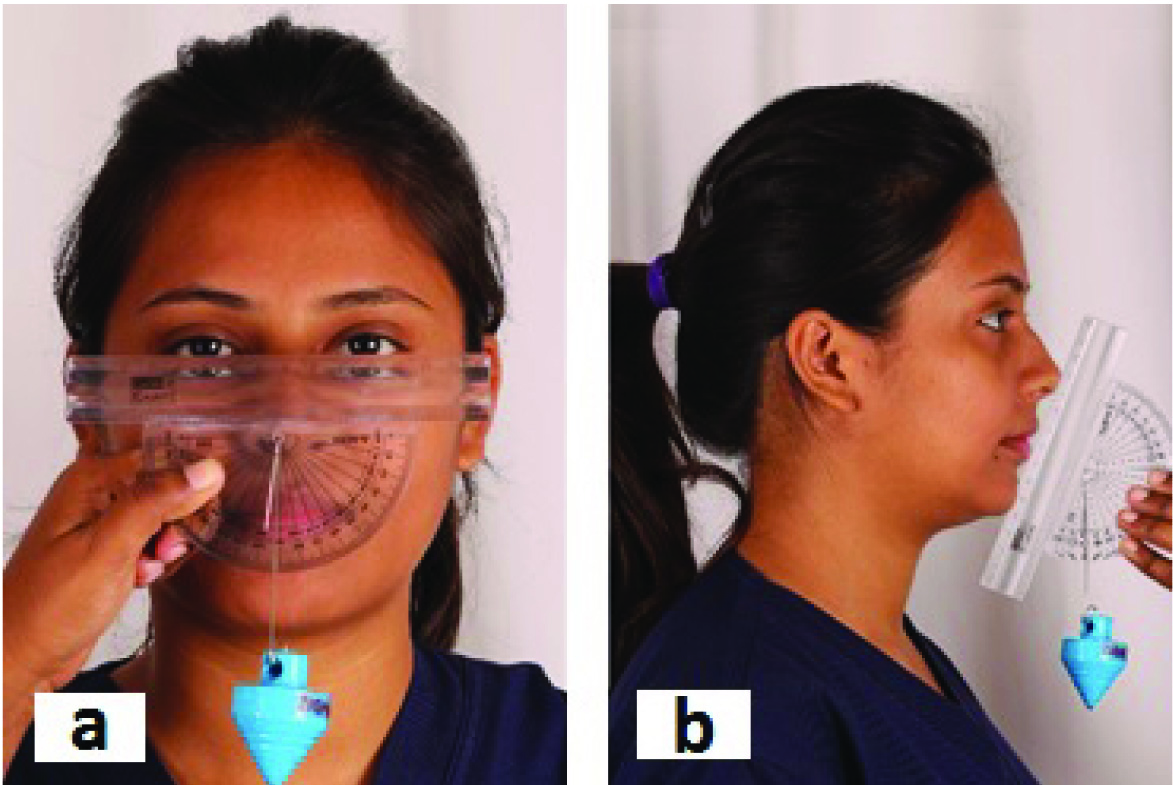
Frontal photographs were taken with the help of a digital camera (Canon EOS 1300D) mounted with a macro portrait lens (Canon EF 100 mm f/2.8 Macro USM). The distance between subjects and the camera was 5 feet [Table/Fig-1]. The subjects were photographed in Natural Head Position (NHP) with lips at rest. To obtain NHP, the subjects were asked to look straight in front of the camera. A modified protractor with a plumb line was used to ensure parallelism of interpupil line with the floor [Table/Fig-2a]. It was placed on the nose tip and soft tissue pogonion to record NHP angle [Table/Fig-2b].
Photographic room: Distance of 5 feet maintained between the subject and camera.
a) Modified protractor adapted to a plumb line to evaluate head posture. The protractor was placed parallel to the inter-pupil ear distance and the head was adjusted as such that the plumb line lies at 90 degrees. b) Recording NHP angle with the help of modified protractor.
A metallic scale was placed parallel to the mid-sagittal plane of the subject with a help of an adjustable rod. Stainless steel spokes were attached to the scale at a distance of 20 cm, which helped in indicating the true vertical [Table/Fig-3a]. Spokes were used for image calibration.
a) Metallic scale with stainless steel spokes attached to the scale at a distance of 20cm. b) Landmarks identified on face.
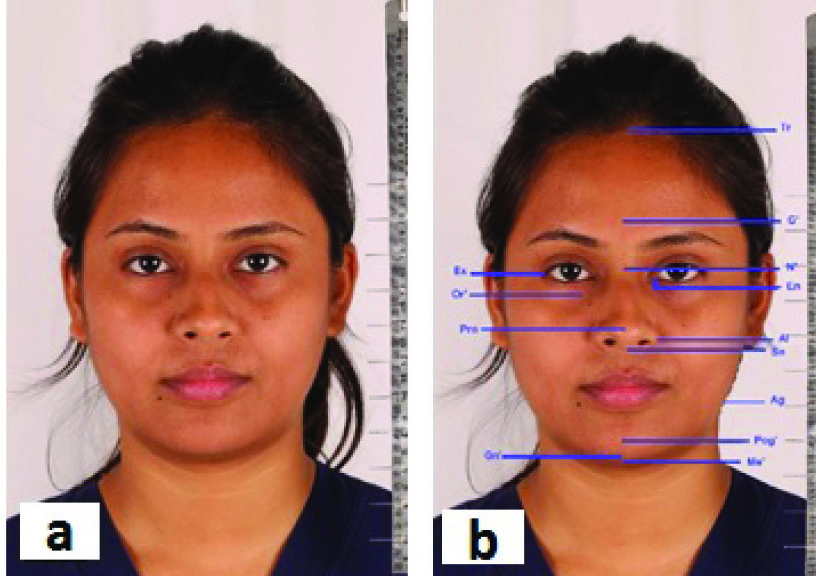
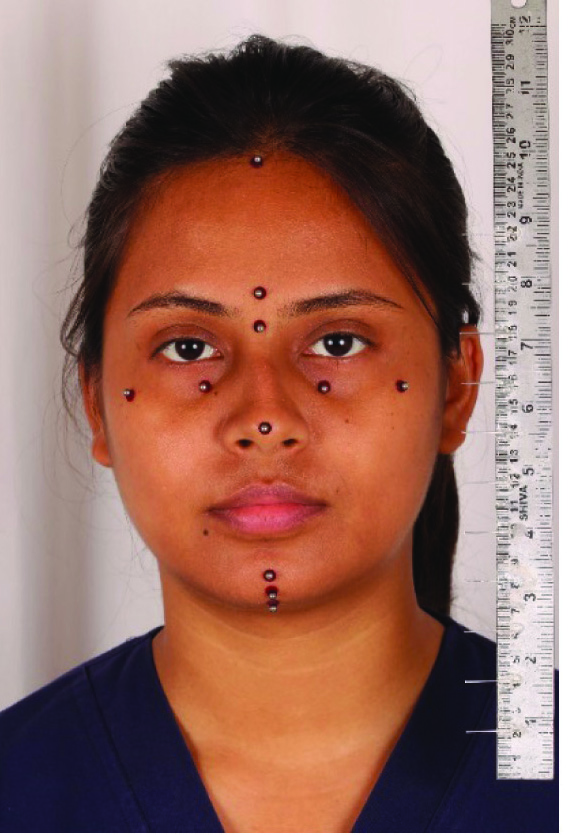
The facial landmarks were identified on the subjects face by palpating manually [Table/Fig-3b] followed by placement of adhesive steel balls of 1/8” for easy identification on photographs. The steel balls were placed at trichion (Tri), glabella (G), nasion (N), orbitale (O), zygoma (Zyg), gnathion (Gn), pogonion (Pog) and menton (Me) [Table/Fig-4].
Facial landmarks marked with steel balls.
Radiographic Procedure
Digital frontal radiographs were taken with an X Mind PanoD+ cephalostat with exposure parameters of 73 kv, 10 mA and 20 sec. The radiographs of the subjects were taken in NHP in standing position with lips at rest. The position of the subjects head was evaluated with the help of the same modified protractor to ensure NHP that was achieved at the time of recording the photograph.
The protractor was placed parallel to the inter-pupillary line and the head was adjusted such that the plumb line was at 90°. The protractor was then placed at the nose tip and soft tissue pogonion and the head adjusted to achieve the same NHP angle which was measured when photographs were recorded. As discussed above the scale was placed parallel to the mid-sagittal plane of the patient with a plumb line for image calibration.
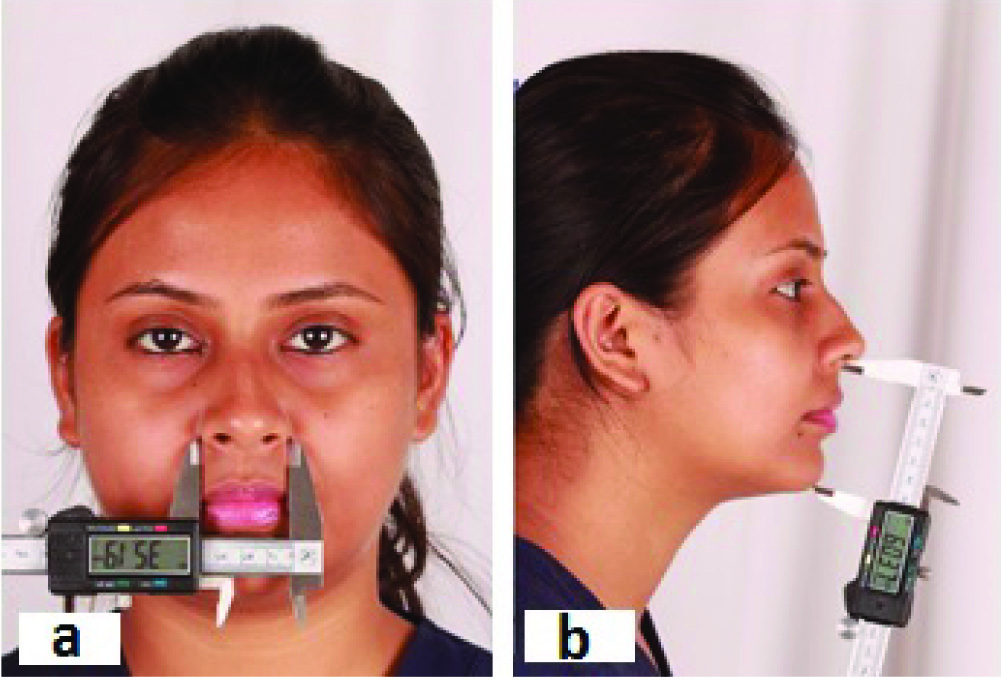
Direct Facial Measurements
The facial landmarks were palpated manually by the observer. Linear measurements were recorded on the subjects face with the help of a digital Vernier caliper in centric relation with relaxed lips and natural head orientation [Table/Fig-5]. Six horizontal and six vertical measurements were recorded [Table/Fig-6].
Horizontal a) and vertical b) measurements recorded with digital Vernier caliper.
Linear horizontal and vertical measurements.
| S. No. | Horizontal Measurements | Symobols |
|---|
| 1. | Endocanthion right – endocanthion left | Enr-Enl |
| 2. | Exocanthion right – exocanthion left | Exr-Exl |
| 3. | Orbitale right – orbitale left | Or-Ol |
| 4. | Bizygmatic width | Zygr-Zygl |
| 5. | Alar base width | Alar-Alal |
| 6. | Antegononial notch right – antegonial notch left | Agr-Agl |
| S. No. | Vertical Measurements | Symobols |
| 1. | Nasion-Subnasale | N-Sn |
| 2. | Subnasale-Menton | Sn-Me |
| 3. | Nasion-Menton | N-Me |
| 4. | Nasion-Pognoion | N-Pog |
| 5. | Subnasale-Pogonion | Sn-Pog |
| 6. | Pogonion-Menton | Pog-Me |
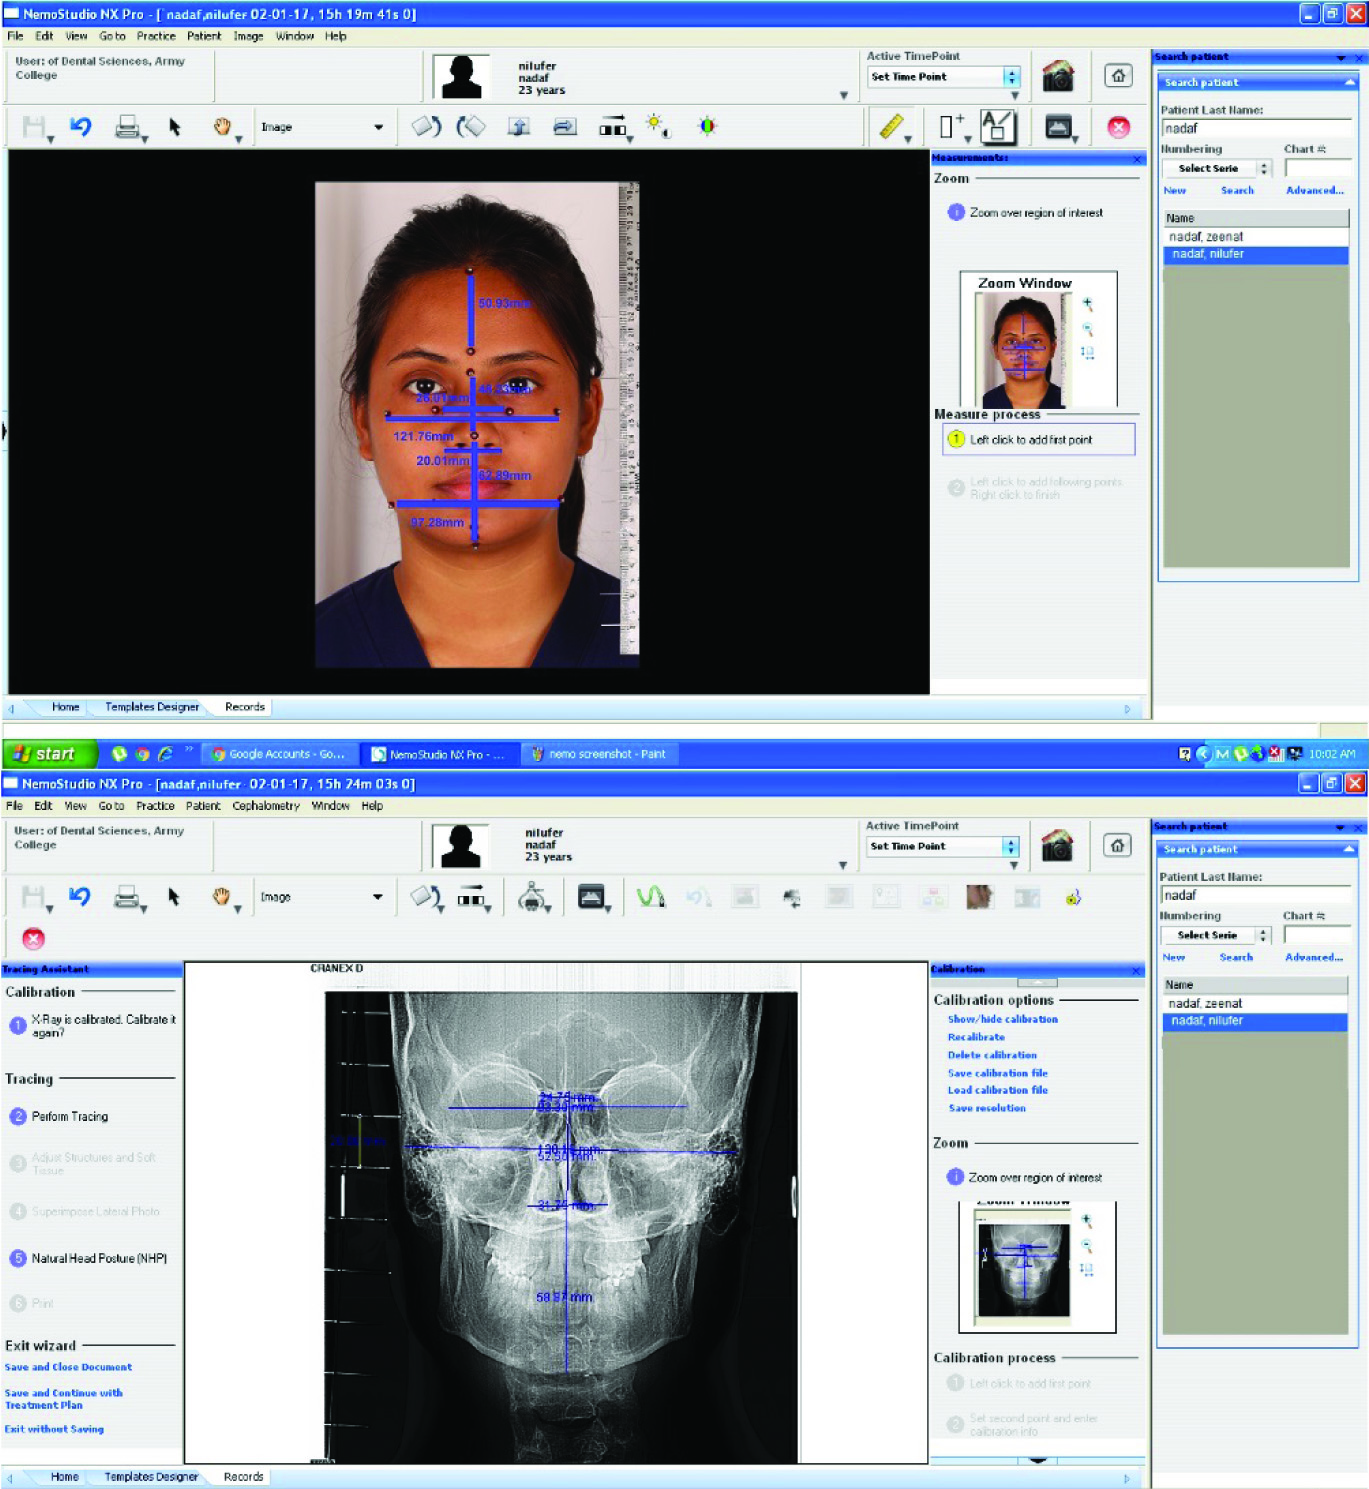
Computer Assessment
The photographic and radiographic records were analysed using Nemoceph software (Nemotech, Madrid, Spain) for Windows operating system. Photographic standardization was obtained keeping a distance of 5 feet between lens focal plane and subject similar to the distance in lateral cephalometric radiographs. Image calibration was performed in Nemoceph software prior to analysis with the inbuilt distance calibration mechanism. The program analysed the landmarks on photographs as well as cephalograms. The images were calibrated and measurements obtained with minimum error [Table/Fig-7].
Nemoceph software measuring facial parameters on photograph and radiograph.
Statistical Analysis
Descriptive statistical analysis (mean, standard deviation) of the linear horizontal and vertical measurements were carried out. The photographic, cephalometric and direct measurements were compared by one-way ANOVA. The three measurements were compared to assess the Pearson correlation coefficients. Correlation coefficient greater than r = 0.7 depicted strong correlation and a p-value <0.05 showed highly significant correlation. Bonferroni post-hoc test was done for pair wise comparisons.
Results
Means, standard deviations and standard errors of all measurements are summarized in [Table/Fig-8]. On assessment of horizontal parameters, highly significant correlation was evident with EnR-EnL and AgR-AgL and with N-Sn in vertical parameters (p<0.001). Significant correlation was found with AlaR-AlaL (p=0.004), OR-OL (p=0.0460), ZygR-ZygL (p=0.01), Sn-Me (p=0.0420) and Sn-Pog (p=0.0080).
Comparison of horizontal and vertical parameters by one way ANOVA.
| S.No. | Horizontal Parameters | Photographic method | Radiographic method | Direct method | p-value |
|---|
| Mean | SD | Std. Error | Mean | SD | Std. Error | Mean | SD | Std. Error |
|---|
| 1. | EnR-EnL | 31.68 | 3.91 | 1.24 | 24.88 | 3.04 | 0.96 | 28.30 | 2.95 | 0.93 | <0.001* |
| 2. | ExR-ExL | 95.40 | 4.46 | 1.41 | 100.52 | 12.18 | 3.85 | 99.70 | 8.16 | 2.58 | 0.247 |
| 3. | OR-OL | 48.87 | 3.59 | 1.14 | 50.96 | 3.79 | 1.20 | 48.40 | 4.05 | 1.28 | 0.046* |
| 4. | ZygR-ZygL | 121.67 | 6.45 | 2.04 | 117.32 | 7.50 | 2.37 | 126.15 | 5.27 | 1.67 | 0.010* |
| 5. | AlaR-AlaL | 35.23 | 3.77 | 1.19 | 29.72 | 1.68 | 0.53 | 34.40 | 1.17 | 0.37 | 0.004* |
| 6. | AgR-AgL | 97.20 | 5.90 | 1.87 | 77.55 | 5.38 | 1.70 | 86.80 | 3.42 | 1.08 | <0.001* |
| S.No. | Vertical Parameters | Photographic method | Radiographic method | Direct method | p-value |
| Mean | SD | Std. Error | Mean | SD | Std. Error | Mean | SD | Std. Error |
| 1. | N-sn | 57.57 | 3.1 | 0.98 | 54.34 | 3.0 | 1.02 | 51.35 | 2.94 | 0.93 | <0.001* |
| 2. | Sn-Me | 61.5 | 6.53 | 2.07 | | 56.20 | 3.33 | 1.05 | 4.65 | 1.47 | 0.0420* |
| 3. | N-Me | 95.4 | 4.46 | 1.41 | 100.52 | 12.18 | 3.85 | 99.70 | 8.16 | 2.58 | 0.2470 |
| 4. | N-Pog | 92.8 | 3.1 | 1.01 | 91.2 | 3.01 | 1.02 | 89.7 | 4.6 | 2.58 | 0.1280 |
| 5. | Sn-Pog | 59.74 | 6.13 | 1.94 | 54.45 | 3.48 | 1.10 | 54.45 | 4.14 | 1.31 | 0.0080* |
| 6. | Pog-Me | 9.52 | 1.93 | 0.61 | 9.67 | 2.27 | 0.72 | 10.75 | 1.65 | 0.52 | 0.0840 |
Denotes- significant values;
** denotes- highly significant values.
Pair wise comparison of three methods was done by Bonferroni post-hoc test [Table/Fig-9]. On evaluating horizontal parameters, EnR-EnL showed highest significance when comparison was done between photographs and radiographs (p<0.001) and radiographs with direct method (p=0.004). Also high significance was seen with ZygR-ZygL when photographs were compared with direct measurements and radiographs were compared with direct measurements (p=0.017).
Pair wise comparison by Bonferroni posthoc test for horizontal parameters and vertical parameters.
| S. No. | Horizontal Parameters | p value |
|---|
| Photographic vs. Radiographic | Photographic vs. Direct | Radiographic vs. Direct |
|---|
| 1. | EnR-EnL | 0.0001** | 0.0140 | 0.0040* |
| 2. | ExR-ExL | 0.7740 | 0.0486 | 1.0000 |
| 3. | OR-OL | 0.2660 | 1.0000 | 0.0690 |
| 4. | ZygR-ZygL | 0.3790 | 0.0090* | 0.0170* |
| 5. | AlaR-AlaL | 0.0220 | 1.0000 | 0.0010 |
| 6. | AgR-AgL | 0.001** | 0.0010** | 0.0070** |
| S. No. | Vertical Parameters | p value |
| Photographic vs. Radiographic | Photographic vs. Direct | Radiographic vs. Direct |
| 1. | N-sn | <0.001** | <0.001** | 0.001** |
| 2. | Sn-Me | 0.1030 | 0.2610 | 1.0000 |
| 3. | N-Me | 0.7740 | 0.0486 | 1.0000 |
| 4. | N-Pog | 0.6740 | 0.0462 | 1.0000 |
| 5. | Sn-Pog | 0.0640 | 0.0050* | 1.0000 |
| 6. | Pog-Me | 1.0000 | 0.0590 | 0.0820 |
denotes- significant values;
denotes- highly significant values.
Highest significance was shown by AgR-AgL with all the three methods (photograph versus radiograph p<0.001, photograph versus direct p= 0.001 and radiograph versus direct p=0.007).
In vertical parameters, strong significance was shown by Sn-Pog when photograph and direct method was compared (p=0.0050) and high significance was shown by N-Sn with all the three methods (photograph versus radiograph p<0.001, photograph versus direct p<0.001 and radiograph versus direct p<0.001).
Hence, it was concluded that AgR-AgL in horizontal parameters and N-Sn in vertical parameters are highly significant when compared with all the three methods.
Correlation assessment of horizontal and vertical parameters was done by Karl Pearson coefficient [Table/Fig-10]. In horizontal parameters, strong correlation was shown by ExR-ExL when radiographs with direct measurements were compared (r=0.9020) and ZygR-ZygL when photographs were compared with direct measurements (r=8380). AlaR-AlaL showed moderate correlation when photographs and radiographs and photographs and direct measurements were compared (r=0.6630, 0.6570).
Correlation among three methods of assessment of horizontal and vertical parameters by Karl Pearson’s coefficient method.
| S. No. | Horizontal Parameters | r Value |
|---|
| Photographic vs. Radiographic | Photographic vs. Direct | Radiographic vs. Direct |
|---|
| 1. | EnR-EnL | 0.6270* | 0.6860* | 0.6810* |
| 2. | ExR-ExL | 0.1070 | 0.0920 | 0.9020** |
| 3. | OR-OL | 0.7610** | 0.7010** | 0.7180** |
| 4. | ZygR-ZygL | 0.3220 | 0.8380** | 0.3080 |
| 5. | AlaR-AlaL | 0.6630* | 0.6570* | 0.4890 |
| 6. | AgR-AgL | 0.4350 | 0.3340 | 0.2500 |
| S. No. | Vertical Parameters | r Value |
| Photographic vs. Radiographic | Photographic vs. Direct | Radiographic vs. Direct |
| 1. | N-sn | 0.329 | 0.76** | 0.3570 |
| 2. | Sn-Me | 0.1940 | 0.3750 | 0.0910 |
| 3. | N-Me | 0.1070 | 0.0920 | 0.9020** |
| 4. | N-Pog | 0.2540 | 0.4820 | 0.4820 |
| 5. | Sn-Pog | 0.3200 | 0.7970** | 0.4270 |
| 6. | Pog-Me | 0.4930 | 0.7150** | 0.8270** |
denotes- significant values;
denotes- highly significant values.
EnR-EnL showed moderate correlation with all the three methods (photograph versus radiograph r=0.6270, photograph versus direct r= 0.6860 and radiograph versus direct r=0.6810) whereas OR-OL showed strong correlation with all the three methods (photograph versus radiograph r=0.7610, photograph versus direct r= 0.7010 and radiograph versus direct r=0.7180).
While assessing vertical parameters, N-Sn, Sn-Pog and Pog-Me showed strong correlation when photographs were measured with direct measurements (r =0.76, 0.7970 and 0.7150). Also strong correlation was found with N-Me and Pog-Me when radiographic measurements were compared with direct measurement (r= 0.9020, 0.8270).
High correlation was found for OR-OLr=0.76 (radiographic versus photographic), 0.70 (photographic versus direct) and 0.71 (radiographic versus direct) and a moderate correlation was found in EnR-EnLr =0.62 (radiographic versus photographic), 0.68 (photographic versus direct) and 0.68 (radiographic versus direct).
Discussion
Photogrammetry is very useful in determining facial asymmetry. A study by Taylor HO et al., using 3-dimensional photogrammetry for asymmetry determination in 100 subjects determined that asymmetry detection was relatively easy using the 3-dimensional method [12]. However, the video stereophotogrammetric method requires extensive equipment and is impractical to use in situations assessing a relatively large number of subjects. In clinical practice, cephalometric analysis constitutes the gold standard for diagnoses and treatment planning. However, use of photogrammetry in the field of orthodontics can aid in epidemiologic studies where a quick, easy and cost effective diagnostic tool is required. With increasing concerns about radiation safety and need to minimize radiation exposure to the extent possible, this technique is useful. Images can also be used multiple times for additional studies as and when required.
Our findings suggested that photographic analysis could be used as an alternative when cephalograms cannot be obtained due to lack of availability of equipment, concerns with radiation exposure and in analysis of large number of samples in epidemiological studies. Facial symmetry determination and analysis of facial proportion was assessed by Yeung CYC et al., in a study on 12-year-old Southern Chinese to determine norms [13]. The norms for the group were determined and sexual dimorphism between males and females was also evident. The study proves the reliability of the photogrammetric method.
Conversely, this method has some drawbacks, such as errors in head posture. A slight deviation from NHP may cause an error to occur. It is essential for the perioral muscles to relax while taking photographs as muscle constriction or lip straining may cause inadvertent error.
The age group in our study (18-25 years) was selected because majority of orthodontic patients fall under this category and age related changes have not yet started. The subjects selected had normal BMI as soft tissue thickness in obese patients could mask accuracy of identification of landmarks. Highly significant correlations (p<0.001) were found between photographic and radiographic method and Karl Pearson correlation coefficient ranged from 0.09 to 0.84 i.e., correlation was strong for few measurements i.e., OR-OL (orbitale rt- orbitale lt) r = 0.76, 0.70, 0.71.
De Carvalho et al., compared lateral cephalograms with profile photographs of 123 subjects and found A’N’B’ angle was most effective amongst the other measurements in explaining variability [8].
Moshkelgosha V et al., compared linear and angular measurements in frontal and profile photographs of Persian population and found sexual dimorphism in the nose, lips and chin [9]. Our study compared photographs, radiographs and direct measurements to find correlations.
Photographs with direct measurements were compared by Farkas LG et al., where they concluded the reliability of 26 landmarks out of 62 [14].
Enlow DH et al., conducted a study where photographs and radiographs of Black and White subjects were compared with each other. The study concluded correlation between the samples due to consistency of the soft tissue thickness [15].
Staudt CD et al., found good reliability (r=0.08) for ANB on comparing radiographs with photographs of 29 skeletal Class III and 13 Class I patients [16].
In 2005 Peng J et al., studied craniofacial anatomy correlation in female twins and concluded that there was a strong genetic component with vertical facial height measurement [17].
Future application of photogrammetric analysis can focus on genetic epidemiologic studies, as resemblance in facial appearance has been noticed within families.
Limitation
The sample size in the study was limited. Male and female comparisons were not made. Moreover, soft tissue thickness could not be considered in the study as it could show variations from patient to patient. Future studies should consider possible differences between sexes while formulating norms with a larger sample size.
Conclusion
Significant correlations were evident in horizontal measurements in the study. Interorbital distance, endocanthion distance and antegonial notch distances were similar. Vertically, nasal height showed strong correlation. The findings will be relevant while planning treatment in Indian population groups since normal values for Indian population are now available. Photogrammetry was found to be a quick, easy and cost effective, alternative diagnostic tool. Evaluation of facial measurements in large samples can be carried out accurately using this method. With increasing evidence on effects of radiation exposure, this non invasive method could effectively be used for facial assessment during treatment planning.
*Denotes- significant values;
** denotes- highly significant values.
*denotes- significant values;
**denotes- highly significant values.
*denotes- significant values;
**denotes- highly significant values.