Multiple genes are involved in type 2 diabetes, though the genetic causes are not clear [1-3]. These genes contributed to increased prevalence of type 2 diabetes mellitus in families. Family history of type 2 diabetes in parents resulted in early fasting hyperinsulinemia in non diabetic offspring [4]. The genetic components also contribute to heritability of insulin secretory deficiency [5,6] and metabolic changes [7], resulting in higher prevalence and aggregation of diabetes in families [8], especially among twins [9]. Non genetic inheritance factors may be epigenetic or non epigenetic mechanisms such as familial behaviour and culture. The reported increased maternal transmission of diabetes may result from effects of gestational diabetes on foetus or from maternally inherited mitochondrial genes [10,11].
Partitioning a sample population with reference to a biochemical marker is required for clinical analysis and diagnosis, and to make inferences of clinical or subclinical disease states. Fasting insulin is one such intermediate marker. Partitioning the fasting and post glucose load OGTT insulin is required for analysis of their relationships with other biochemical and clinical parameters [12-14], for establishment of the baseline status and the baseline reference intervals of insulin. Partitioning is also required to understand the heterogeneity and stratification of the intermediate marker with reference to multiple influences [15-18].
In this study, we analysed the relationship of fasting and post glucose load OGTT insulin, as both are likely to be influenced by family history of type 2 diabetes mellitus. If there is a relationship present, then it is likely that both fasting and post glucose load insulin may be partitioned according to family history of type 2 diabetes mellitus.
Materials and Methods
This observational, cross-sectional study was done at Amala Institute of Medical Sciences, Haryana, India, in a healthy cross section of participants aged 18 to 25 years. The duration of this study and sample collection was from May 2011 to October 2015. The total sample (n=90) included males (n=31) and females (n=59), and the difference in the number of males and females did not influence the outcome of the study.
Study was approved by the Institutional Research and Ethics Committees (AIMSIEC/01/2011 dated 9/3/2011). Informed written consent was obtained from each participant. Clinical evaluation of volunteers was done for inclusion of individuals without any disease. The participants should be on regular diet, exercise, rest, sleep; had no drugs for one week and all female participants were in the pre gestational period. Clinical biochemistry laboratory evaluation was done for further exclusion of unhealthy individuals at the subclinical level and for evaluating the characteristics of diabetes related variables. Exclusion criteria for these were: BMI >30 kg/m2, family history suggestive of obesity and type 1 diabetes, serum triglyceride >250 mg/dl (2.825 mmol/l), waist circumference ≥100 cm, fasting glucose ≥126 mg/dl (7 mmol/L), 2 hour glucose challenged or postprandial glucose >180 mg/dl (10 mmol/L), BP ≥140/90, serum alanine aminotransferase above 125 U/L, hs-CRP >5 mg/l, serum creatinine >1.3 mg/dl (114.9 µmol/L) in males and >1.2 mg/dl (106.1 µmol/L) in females. These abnormal cut off levels were designed for this study and permitted inclusion of individuals with consequences of increased insulin resistance and family history of type 2 diabetes mellitus but excluded the secondary clinical influences.
Blood sample (10 ml) was drawn without anticoagulants after a 10 to 12 hour overnight fasting, between 7.30 and 8.30 in the morning. It was transferred into plastic tubes, centrifuged immediately at 3500 rpm (Remi, India; Table top, swinging bucket rotor centrifuge) for 5 minutes to sediment cells before clotting. Plasma was transferred to glass tubes and incubated for 15 minutes to initiate clotting and clot was separated by a second centrifugation at 3500 rpm for 5 minutes. If clotting was observed after the first centrifugation in the plastic tube, then plasma was allowed to clot in the same tube for 15 minutes and again centrifuged at 3500 rpm for 5 minutes. This procedure reduced haemolysis. Cell lysis cause insulin degradation. All assays were done immediately after preparation of serum.
Analytical Control and Insulin Measurements
Immunochemistry assays were done by the autoanalysers Vitros ECi (Ortho Clinical Diagnostics, USA) and Access 2 (Beckman Coulter, USA). Clinical chemistry assays were done with the autoanalyser Vitros 5,1F S (Ortho Clinical Diagnostics, USA). Insulin assays were done with Access 2 machine with assay reagents and calibrators from Beckman Coulter. Immunometric assay method with magnetic beads coated with anti-insulin antibody was the principle of the insulin assay [19]. Limit of detection of insulin was taken as the lowest insulin concentration distinguishable from zero (calibrator as 0 pmol/L insulin) with 95% confidence, and was 0.21 pmol/L [19,20]. This level of insulin was sufficiently below the lower limit of range of fasting insulin and below the lowest calibrator above zero, of the linear six point insulin calibrator value (an example from a lot is 5.88 pmol/L). Insulin in μU/ml x 6 converted it to pmol/L [21]. The two level internal quality control reagents and the external quality assurance programs were from Biorad Laboratories, Irvine, CA, USA [22]. Claims of the manufacturers of instruments and reagents were validated by internal quality control samples assayed in duplicates for a minimum of ten days or often more. Cross reactivity of assayed serum insulin with proinsulin and C peptide were insignificant [19]. Even weak haemolysis in sample showed marked decrease in insulin due to degradation [19,21] and was the most important interference in the assay. Reference interval of fasting insulin (manufacturer’s) was 11.4 to 138 pmol/L [19].
Diagnostic criteria for diabetes mellitus laid by the WHO for fasting plasma glucose were ≥126 mg/dL (7 mmol/L). The criteria for 2 hour postprandial or post glucose load OGTT (75 g in 300 ml water for adults) value was ≥200 mg/dL (11.1mmol/L) [23]. Diabetes mellitus type 2 was differentiated from type 1, by the former having a minimum history of 6 months of glycaemic control by drugs, diet and exercise before insulin injection.
Participants in the sample population were partitioned into those without and with family history of type 2 diabetes mellitus in parents.
Statistical Analysis
Statistical analysis and calculations were done with SPSS, version 23.0 software or manually. Normality of distribution was estimated by Shapiro-Wilk test. Equality or homogeneity of variances of the groups compared was done by Levene’s test. Log10 transformations converted most of the positively skewed groups to Gaussian distribution and were of equal variances in the groups compared. When variables had Gaussian distribution (before or after transformation) and when there was equality of variance in the groups compared, parametric methods of analysis were used. Otherwise, non parametric methods were used. Differences of fasting insulin of different groups were compared by 95% confidence interval of mean, two-tailed Student’s t-test and Mann-Whitney U test [24-26]. There were four missing data in lipid profile (n=86), the missing data did not influence outcome of the study. The cut off for p-value as a measure of the level of significance was 0.05.
Results
Characteristics of some common diabetes related quantitative variables in the total sample (n=90) are given in [Table/Fig-1]. Mean values of all quantitative variables were within the healthy reference range. Ranges of all quantitative variables were also within the cut off levels permitted by the inclusion/exclusion criteria.
Characteristics of type 2 diabetes mellitus related parameters In the sample. OGTT is oral glucose tolerance test.
| Quantitative variables n = 90 (Standard units) (Conventional units) | Mean±SD in Standard units (conventional units) | Range in Standard units (conventional units) |
|---|
| Age (years) | 21.74±2.05 | 18 – 25 |
| BMI (kg/m2) | 20.71±2.89 | 15.47 – 27.11 |
| Waist circumference (cm) | 75.26±8.51 | 57.50 – 94.00 |
| Fasting glucose (mmol/L) (mg/dL) | 5.16±0.514 (92.92±9.26) | 3.97 – 6.87 (71.50 – 123.70) |
| 2 hour OGTT glucose, (mmol/L) (mg/dL) | 5.67±1.25 (102.25±22.56) | 2.49 – 9.76 (44.86 – 175.80) |
| Fasting insulin (pmol/L) (μlU/ml) | 34.65±17.03 (5.78±2.84) | 8.46 – 97.56 (1.41 – 16.26) |
| 30 minute OGTT insulin (pmol/L) (μlU/ml) | 382.40±246.66 (63.73±41.11) | 69.48 – 1373.40 (11.58 – 228.90) |
| 60 minute OGTT insulin (pmol/L) (μlU/ml) | 341.66±243.80 (56.94±40.63) | 67.32 – 1612.08 (11.22 – 268.68) |
| 120 minute OGTT insulin (pmol/L) (μlU/ml) | 224.24±159.07 (37.37±26.51) | 21.06 – 880.50 (3.51 – 146.75) |
| Total cholesterol (n = 86) (mmol/L) (mg/dL) | 4.58 ±0.727 (176.98±28.05) | 2.85 – 6.53 (110.00 – 252.00) |
| Triglycerides (n = 86) (mmol/L) (mg/dL) | 0.880±0.357 (77.88±31.64) | 0.42 – 2.51 (37 – 222) |
| LDL cholesterol (n = 86) (mmol/L) (mg/dL) | 2.84±0.663 (109.67±25.60) | 1.40 – 4.84 (54 – 187) |
| HDL cholesterol (n = 86) (mmol/L) (mg/dL) | 1.34±0.315 (51.67±12.14) | 0.73 – 2.20 (28 – 85) |
Visual examination of X-Y scatter diagram [Table/Fig-2] and calculation of Pearson’s correlation coefficient [Table/Fig-3] showed significant correlation (r=0.265; p=0.012) of fasting insulin and 30 minute insulin. Similarly, there were significant correlations of fasting insulin with 60 minute (r=0.335; p=0.001) and 120 minute (r=0.277; p=0.008) OGTT serum insulin.
X-Y scatter diagram of fasting insulin (0 minute) with 30 (a), 60 (b) or 120 (c) minute oral glucose tolerance test insulin levels.
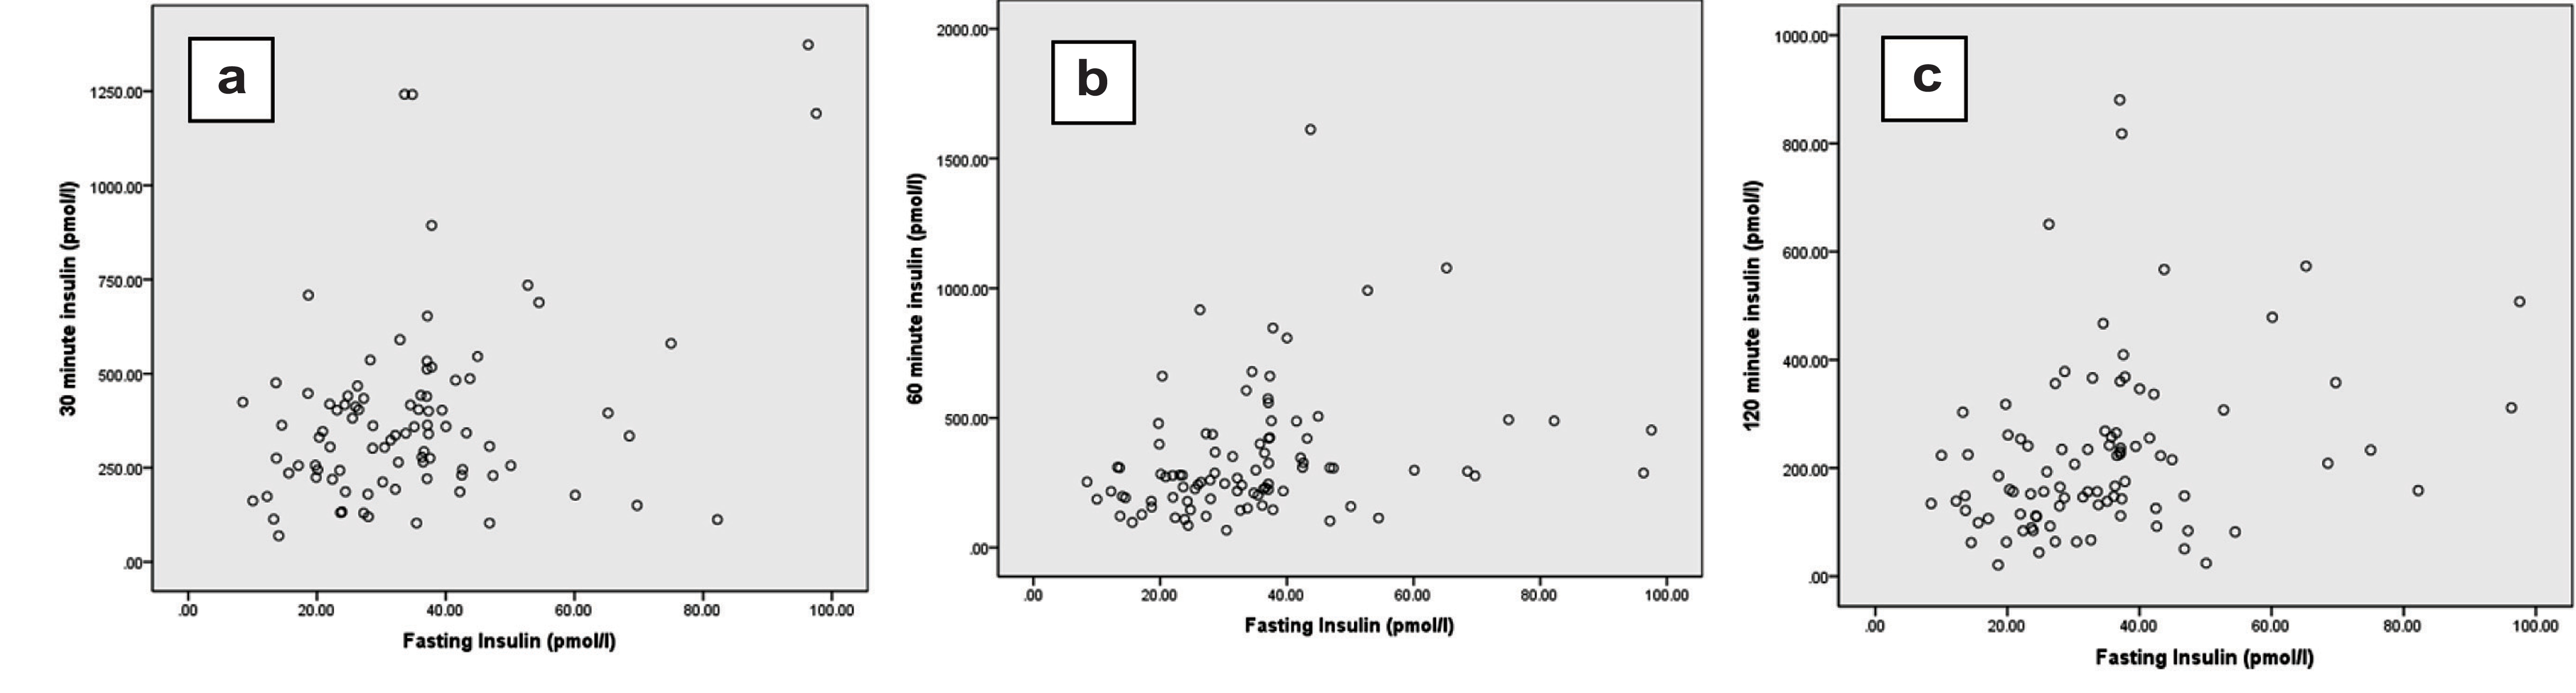
Pearson’s correlation of fasting insulin (Row No. 1) with 30, 60 or 120 minute (Row Nos. 2 – 4) OGTT insulin (after log10 transformation). At least one of the two correlating quantitative variable should have Gaussian distribution by Shapiro Wilk test.
| Row No. | Insulin from OGTT (n = 90) | 95% Confidence interval of mean | Shapiro Wilk test p (after log10 transformation) | Correlation coefficient (r) | Significanceof correlation p |
|---|
| 1. | Fasting pmol/L) | 31.08 – 38.22 | 0.236 | -- | -- |
| 2. | 30 minute (pmol/L) | 330.74 – 434.06 | 0.262 | 0.265 | 0.012 |
| 3. | 60 minute (pmol/L) | 290.60 – 392.73 | 0.840 | 0.335 | 0.001 |
| 4. | 120 minute (pmol/L) | 190.92 – 257.56 | 0.080 | 0.277 | 0.008 |
Insulin in groups without and with family history of type 2 diabetes in parents was compared. Fasting insulin in group with family history of diabetes were positively skewed. Log10 transformation converted the distribution of most of the samples to Gaussian and had equality of variance [Table/Fig-4]. Percent coefficient of variation (% CV) was found to be lowest in fasting insulin when compared with that of 30, 60 and 120 minute insulin. The lowest % CV was found in fasting insulin from groups with and without family history of diabetes.
Comparison of insulin concentrations in groups without and with family history of type 2 diabetes mellitus in parents. As groups were positively skewed, log10 transformation was done, followed by Student’s t test for Gaussian distributed insulin data or the non parametric Mann Whitney U test.
| Serum insulin (pmol/L) | Without family history of type 2 diabetes (n = 57) | With family history of type 2 diabetes (n = 33) | After log10 transformation |
|---|
| Mean ±SD (range) | coefficient of variation(%cv) | Mean ±SD (range) | coefficient of variation (%cv) | Shapiro-Wilk test for normality p | Levene’s test for equality ofvariances p | Student’s t test (or MannWhitney u test) p |
|---|
| Without Family history | With family history |
|---|
| Fasting insulin | 29.12±10.47 (8.46 – 54.48) | 35.95 | 44.20±21.59 (12.2 – 97.6) | 48.84 | 0.023 | 0.473 | 0.491 | <0.001 |
| 30 minute OGTT insulin | 363.98±220.07 (103.2 – 1241.8) | 60.46 | 414.22±287.78 (69.5 – 1373.4) | 69.48 | 0.225 | 0.940 | 0.390 | 0.574 |
| 60 minute OGTT insulin | 281.34±150.15 (67.3 – 661.2) | 53.37 | 445.86±328.91 (121.3 – 1612.1) | 73.77 | 0.680 | 0.164 | 0.544 | 0.002 |
| 120 minute OGTT insulin | 189.88±153.96 (21.06 – 880.5) | 81.08 | 283.59±152.17 (63.96 – 650.7) | 53.66 | 0.180 | 0.536 | 0.481 | <0.001 |
Mean fasting insulin was markedly increased in the group with family history of diabetes (p<0.001) but, there was no difference in 30 minute insulin in the groups with and without family history of diabetes mellitus (p=0.574). There was a good increase of 60 (p= 0.002) and 120 minute (p=0.001) OGTT insulin with family history of type 2 diabetes mellitus. These results indicated that fasting insulin showed a better difference between those with and without family history of diabetes mellitus.
Similar differences were also seen in 95% CI of mean of serum insulin [Table/Fig-5]. The CIs with and without family history of diabetes were far separated with fasting insulin, moderately separated with 60 and 120 minute insulin, but was overlapping in 30 minute insulin. These results indicated that there is better partitioning of fasting insulin than post glucose load OGTT insulin with family history of type 2 diabetes.
Comparison of 95% CI of mean insulin concentrations in groups without and with family history of type 2 diabetes mellitus.
| Serum Insulin (pmol/L) | 95% ci of mean |
|---|
| Without family history | With family history |
|---|
| Fasting insulin | 26.34 – 31.90 | 36.55 – 51.86 |
| 30 minute OGTT insulin | 305.59 – 422.37 | 312.18 – 516.26 |
| 60 minute OGTT insulin | 241.50 – 321.18 | 329.23 – 562.49 |
| 120 minute OGTT insulin | 149.03 – 230.73 | 229.63 – 337.55 |
Discussion
Partitioning insulinemia, one of the earliest clinically detectable parameters before onset of type 2 diabetes, was taken up for this study. Fasting glucose and fasting insulin are in a steady state influenced by insulin sensitivity, insulin uptake by tissues and insulin secretion by pancreas [12-14]. All these factors also affected the post glucose challenged OGTT insulin levels. When fasting insulin increased with insulin resistance, post glucose load insulin also increased [12,13]. When insulin resistance increased, insulin secretion also increased to compensate for it [27,28]. This leads to a negative hyperbolic relationship between insulin resistance and insulin secretion [12,13]. These relations between fasting insulin and post glucose challenged insulin are responsible for the correlation between them [Table/Fig-2,3].
Insulin resistance and beta cell insulin secretory dysfunction are the fundamental defects observed in type 2 diabetes. Insulin resistance increased insulin secretion and beta cell dysfunction decreased insulin secretion [12,13]. Both these activities influence fasting insulin in opposing directions and confound each other. It may be reasoned that this confounding of hyerinsulinemia by beta cell secretory dysfunction is the fundamental problem in clinical interpretation of fasting insulin levels.
In addition to the above factors, there is a large increase in glucose-induced insulin secretion during OGTT when compared to fasting insulin. The ability of beta cells to increase secretion of insulin depends on the status of insulin resistance and compensation of insulin resistance by beta cells [12,27,28]. But insulin secretory dysfunction decreased insulin secretion by beta cells. These activities increasing and decreasing insulin secretion act in opposite directions and cause increase %CV of serum insulin. The %CV was found to be lowest in fasting insulin [Table/Fig-4]. Therefore, fasting insulin was found to be more reproducible than glucose challenged insulin of OGTT.
Decrease in hepatic insulin uptake, clearance of plasma insulin and regulation of insulin degradation are considered as causes of hyperinsulinemia [29]. Hyperinsulinemia may be considered as a compensation for insulin resistance which also increases insulin secretion [12,27,28]. Hyperinsulinemia is strongly associated with metabolic syndrome, pathogenesis of type 2 diabetes and obesity [13,14].
Family history of type 2 diabetes was found to have an influence on serum insulin [4]. The influence was more markedly detected in fasting insulin. The decrease in coefficient of variation, standard deviation and standard error of the observed values can increase the significance of the difference between two mean values [Table/Fig-4,5].
Young adults between 18 and 25 years were selected for this study to decrease the influence of growth phase upto 18 years of age and environmental build up after 25 years of age [12-14].
Limitation
The 30 minute post glucose load OGTT insulin could not be partitioned, even though it correlated well with fasting insulin which could be partitioned. This early phase of glucose-induced insulin secretion is the most important and the early secretory phase of insulin. At present, we are unable to find a reason for the absence of influence by family history of type 2 diabetes on 30 minute OGTT insulin. The secretory phase of insulin has genetic influences and probably only the later phase of OGTT insulin, 60 and 120 minute, are influenced by family history of type 2 diabetes.
Conclusion
Fasting insulin correlated well with all post glucose load insulin of OGTT. Fasting, 60 and 120 minute OGTT insulin can be partitioned according to family history of type 2 diabetes mellitus. As the genetic influences are multifactorial, family history of type 2 diabetes would cause stratification and heterogeneity of insulin concentrations in the sample. Of the four insulin parameters, 0 (fasting), 30, 60 and 120 minute OGTT insulin, fasting insulin was better partitioned and could be used for baseline reference interval calculations.