Many pathologies of brain parenchyma are characterized by presence of calcifications and haemorrhages. Calcium is diamagnetic and due to presence of very few protons, it is difficult to detect on conventional MR sequences [1,2]. Whenever calcium is seen on conventional MR sequences, it has a variable signal ranging from high, low or mixed. Haemorrhages especially the chronic microbleeds associated with the chronic hypertension can also demonstrate a similar variability of the signal. From a clinical perspective, it is important to differentiate calcification and haemorrhage for appropriate diagnosis and optimal management [3]. CT has been considered since long. It is the gold standard in detecting calcification and has been widely used in clinical practice. Attenuation value of 100 Hounsfield units (HU) or more in a lesion signifies calcification. However, when attenuation value is <100 HU, this gold standard cannot be relied upon as there is an overlap between calcification and blood [4,5].
Gradient Echo Sequence (GRE) with its phase shift evolved as a valuable sequence in separating calcified lesions from those containing haemorrhages. In a GRE image the phase shift present, is representative of the average magnetic field of protons in a voxel depending on the local susceptibility of the tissues. The inherent advantage of GRE sequence lies in the shortening of T2 relaxation time and subsequent opposite magnetic susceptibilities gives the opposite phase deflections. The haemorrhagic foci appear as white dots while calcified areas are seen as black dots on the phase imaging on a left-handed system. However, GRE sequence suffers from severe susceptibility artifacts especially near the skull base, also the image is distorted in the presence of magnetic field inhomogeneity and metal [6-8].
The recent advances in MRI led to development of SWI which has emerged as a new technique for evaluating the differences in tissue susceptibilities. SWI is a fully velocity compensated MRI technique that enhances susceptibility-induced contrast by combining both magnitude and phase. The sensitivity of SWI to both paramagnetic and diamagnetic substances helps generate different phase shifts. Clinical utilization is possible by using special filtration techniques which can remove any phase variations. SW images can be displayed as a minimum intensity projection that provides high resolution delineation of the cerebral venous architecture, which is unavailable in other MRI techniques, including GRE. SWI is sensitive to deoxygenated blood and intracranially deposited mineral and, that is why it is applied to image pathologies including intracranial haemorrhage, traumatic brain injury, stroke, neoplasm, and multiple sclerosis [8-10].
Although artefacts due to susceptibility using SWI are significantly lower compared to GRE, the lesion visualization may still be impeded at the air and bone interfaces. In addition, variable signal on reverse phase SWI may hinder differentiation between calcification and microbleeds. Recently, there is growing interest in the application of DWI and Diffusion-Tensor-Imaging (DTI). In the region of interest, Averaged Diffusion Coefficient (ADC) values can be taken. This enables a quantitative and reproducible assessment of the diffusion changes in both areas of normal and abnormal signal seen on conventional MRI. The Mean Diffusivity (MD) values on DWI and DTI have been used in few studies as a quantitative parameter for observing changes in the calcified stage of neurocysticercosis and have been tried in microbleeds with variable results. It has been shown previously that there was a decrease in MD in calcified stage of neurocysticercosis while microbleeds have shown corresponding increase [11-15]. ADC and MD are used interchangeably in literature and have the same mathematical calculations.
The study was planned to study the role of magnitude and phase SWI and DWI in visualizing and differentiating calcification and haemorrhage in brain parenchyma. In addition, we planned using the ADC as an additional parameter for its potential applicability in the above differentiation.
Materials and Methods
The retrospective study was conducted between October 2013-December 2015 and was approved by the research and ethical committee of the institution. A total of 156 patients were enrolled based on the simultaneous availability of both CT and MRI cranium. Hundred patients were selected and divided into two groups with intracranial focal calcifications and chronic microbleeds as per the predefined criteria [Table/Fig-1]. Fifty six patients were excluded from the study due to the lack of any intracranial pathology and incomplete clinical details. Chronic microbleeds are perivascular accumulations of haemosiderin containing macrophages and are <10 mm in diameter on T2* GRE [16-18]. Patients of all age groups were included in the study. The routine informed consent was taken either from the patient or the guardian.
Criteria for detecting calcified foci and chronic microbleeds.
| Size | CT | MRI |
|---|
| T2 | Magnitude SWI | Phase SWI |
|---|
| Focal calcified lesions | <10 mm | > +100 HU, hyper- dense | Hypointense | Hypointense | Negative/ predominantly negative signal (in left handed system) |
| Chronic microhaem-orrhages | <10 mm | Not seen | Not seen/ Faintly seen | Hypointense | Positive/ predominantly positive signal (in left handed system |
MRI data acquisition was performed using a 1.5 Tesla scanner (Magnetom, Siemens, Erlangen, Germany) with circularly polarized head coil matrix. The head of the individual was strapped to avoid patient’s motion. All images were obtained in the axial plane including T1-weighted and T2-weighted sequences, SWI and DWI. Imaging parameters for various sequences were: axial Spin-Echo (SE) T1-weighted sequence (TR = 450–650 ms, TE = 10–20 ms, section thickness = 5 mm, matrix = 256 × 192, NEX = 2, FOV = 230 cm), axial T2-weighted sequence (TR = 3000–4500 ms, TE = 80–90 ms, echo-train length = 22–27, section thickness = 5 mm, matrix = 256 × 256, NEX = 2, FOV = 230 cm) and axial 3D SWI sequence was performed with the following imaging parameters: TR/TE 54/40; acquisition time 3:40 minutes; slice thickness 3 mm and flip angle 15°. DWI were obtained using an echo-planar sequence with a TE of 85 ms, acquisition time 4 minutes 44 seconds; 3 mm section thickness; 20 cm to 26 cm FOV, 128 x 128 matrix size, 25 directions, and a b-value of 1000 s/mm2 was used for all measurements. Sagittal and coronal T2WI images were also acquired as a part of protocol.
CT was performed with a 128 slice CT scanner with the following parameters: 300 mAs, 120 kV, 5-mm- thick sections, FOV 220 mm2 and 512 x 512 matrix. Data was reconstructed to a 0.6 mm section thickness.
Both qualitative and quantitative evaluation of the images was done. Two experienced independent radiologists did the qualitative evaluation of the focal calcification and chronic microbleeds for the assessment of signal intensities independently. Quantitative evaluation was done by taking single pixel values in the circular ROI on each sequence (Magnitude SWI, Phase SWI and DWI).
Statistical Analysis
The analysis included profiling patients on different demographic and aetiological parameters. The variables were expressed in terms of mean and standard deviation and analysed using student’s t-test. The qualitative variables were expressed in terms of percentage and analysed using Pearson’s correlation coefficient. Inter observer variabilities of the total susceptibility were assessed by using the Cohen’s kappa. The following criteria were used to assess the inter-observer agreement: agreement of less than 0.40 was considered poor; fair agreement for 0.40–0.59, good agreement for 0.60–0.74 and excellent agreement for greater than 0.74. Statistical Package for Social Sciences (SPSS) version 20.0 was used for analysis.
Results
Hundred patients included in the study, were divided into two groups based on the combined findings of CT and MRI, intracranial focal calcifications (n=50) and chronic microbleeds (n=50). The basic parameters that included demographic details, distribution and location of the intracranial focal calcifications and chronic microbleeds are summarized in [Table/Fig-2]. Intracranial calcifications were found in younger age group (32.9±16.5) as compared to chronic microbleeds. Intracranial physiological calcifications are all calcifications (age-related and neurodegenerative) that do not accompany any disease and for which no patholocial cause can be identified whereas pathological are those which are associated with any disease or pathological cause [19]. Physiological calcifications included one choroid plexus calcifications, four basal ganglia calcifications, five pineal gland calcifications, and three falx calcifications. Non physiological calcifications included 66 calcified granulomas and one case of tumoural calcification.
Demographic details, distribution and location of the intracranial focal calcifications and chronic microbleeds.
| Parameters | Intracranial calcifications (n=50) | Chronic microbleeds (n=50) |
|---|
| Age in years (Mean±SD) | 32.9 (±16.5) | 60.24 (± 15.7) |
| Sex | 38 (males) and 12 (females) | 33 (males) and 17 (females) |
| Number of subjects with types of intracranial focal calcifications/ chronic microbleeds | Physiological–5 | Hypertensive–35 |
| Non physiological–41 | Non hypertensive–13 |
| Both physiological and non physiological–4 | Tumoural–2 |
| No. of lesions in: | Subjects with non physiological calcification | Subjects with chronic microbleeds |
| Single | 29/45 (64.4%) | 3/50 (6%) |
| Multiple (>2) | 16/45 (35.6%) | 47/50 (94%) |
Signal characteristics and detection rate of intracranial focal calcifications on MRI:
Total 76 calcifications were detected on magnitude SWI [Table/Fig-3c] and phase SWI [Table/Fig-3d]. Largest proportion of calcifications was seen in frontal and parietal regions (64.6%). Majority of them were not visualized on T2WI.
Signal characterstics of intracranial focal calcification on MRI. Intracranial focal calcification is not detected on (a) T1WI. Intracranial focal calcification is well seen on (b) T2WI (arrow), (c) Magnitude SWI (arrow and (d) Phase SWI (arrow) as hypointense signal intensity and corresponding (e) CT image (arrow) shows size concordance with Phase SWI.
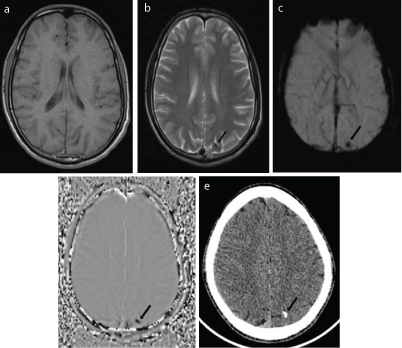
Only 30.3% were seen on first look on T2WI [Table/Fig-3b] and 48.4% were seen retrospectively. None of the foci were seen on T1WI [Table/Fig-3a], DWI and ADC. For the diagnostic accuracy, the two experienced radiologists, who were blinded to the subjects’ clinical information and diagnosis, independently evaluated the signal of the intracranial focal calcifications on the phase SWI sequences in two randomized sessions as mentioned in [Table/Fig-4]. There was good agreement found between the two observers for intracranial calcifications (κ = 0.70).
Signal characteristics of intracranial focal calcifications and chronic I microbleeds on phase SWI by two experienced observers.
| Signal | Intracranial focal calcification | Chronic microbleeds |
|---|
| Observer 1 | Observer 2 | Observer 1 | observer 2 |
|---|
| Hypointense | 69 | 70 | 8 | 10 |
| Mixed signal | 6 | 5 | 55 | 59 |
| Hyperintense | 1 | 1 | 182 | 176 |
| Cohen’s Kappa | 0.70 | 0.55 |
| Probable outcome | 96.05% | 78% |
| Strength of agreement | Good | Moderate |
Overall sensitivity of SWI in the detection of calcified foci was 93.9%, however for foci < 2.5 mm the sensitivity reduced to 47%. The size and location of calcifications on CT [Table/Fig-3e] were further correlated with T2WI, magnitude SWI and phase SWI sequences with respective correlation coefficient values of 0.81, 0.89 and 0.89. The maximal concordance was seen between CT and phase SWI. None of the intracranial calcifications were visualized on DWI and ADC.
Signal characteristics and detection rate of chronic microbleeds on MRI:
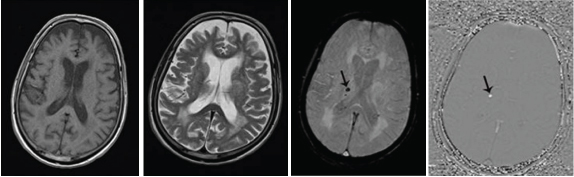
None of the chronic microbleeds were visualized on CT or conventional MR sequences {T1WI [Table/Fig-5a] and T2WI [Table/Fig-5b]}. A total of 245 chronic microbleeds were detected on SWI {Magnitude [Table/Fig-5c] and Phase [Table/Fig-5d]} in the 50 patients. None of the chronic microbleeds were visualized on DWI and ADC. Like in calcification group, the chronic microbleeds were also analysed by two experienced radiologists on the magnitude SWI and phase SWI who were blinded to the clinical details in two randomized sessions [Table/Fig-4]. There was moderate inter-observer agreeability of signal on phase SWI of small intracranial haemorrhages (κ = 0.5).
Signal characteristics of intracranial haemorrhagic focus on MRI. Intracranial small haemorrhagic focus is not detected on: (a) T1WI; and (b) T2WI. Hypointense signal is seen on (c) Magnitude SWI (arrow) and hyperintense signal on; (d) Phase SWI (arrow).
Quantitative analysis
Pixel values were computed for each subject in a circular ROI on each sequence (magnitude SWI, phase SWI and DWI). Average and standard deviation of pixel values were calculated as mentioned in [Table/Fig-6]. There was statistically significant difference between the intracranial calcifications and intracranial haemorrhages on phase SWI, (p<0.001, <0.05). No statistical significant difference was observed on magnitude SWI, DWI and ADC (p>0.05) [Table/Fig-6].
Quantitative analysis using student’s t-test.
| Average pixel values on various sequences | intracranial calcifications (Mean±SD*) | Chronic microbleeds (Mean±SD*) | T value | p- value | Significant (<0.05) |
|---|
| Magnitude SWI1 | 184.5±50.6 | 173.0±54.5 | 1.21 | 0.22 | Not Significant |
| Phase SWI | -312.5±187.5 | 541.9±301.7 | 19.61 | 0.0001 | Significant |
| DWI2 | 140.8±32.2 | 149.9±51.9 | 1.28 | 0.20 | Not Significant |
| ADC3 | 999±307.3 | 946.1±635.2 | 0.62 | 0.53 | Not Significant |
SD = Standard Deviation
= Susceptibility Weighted Imaging
= Diffusion Weighted Imaging
= Averaged Diffusion Coefficient
Discussion
The ability of a substance to get affected by external magnetic field is the magnetic susceptibility. Accordingly substances can be categorized as paramagnetic, diamagnetic or ferromagnetic. Magnitude SWI imaging is an MRI technique that exploits the magnetic susceptibility differences of blood, iron and calcification in various tissues. Phase images are sensitive to changes in the magnetic field due to components in tissues like deoxyhaemoglobin, haemotoma or calcification, and thus they can be used to differentiate the susceptibility differences among tissues. Paramagnetic subst-ances (deoxyhaemoglobin, haemosiderin and ferritin) distort the local magnetic field and cause different interactions between each nuclear spin of the tissue and the local magnetic field resulting in positive phase shift relative to surrounding parenchyma whereas diamagnetic substances, such as calcium and phosphorous gives negative phase shift in the left-handed MR system and opposite signals in the right-handed system [6].
A study by Zhu WZ et al., [20] showed that both calcification and haemorrhage manifested low signal on SWI. But they presented opposite signal features on the corrected phase images. Significant difference was found in average phase shift between calcification and haemorrhage (t=74.69, p<0.05). Another study by Barbosa JH et al., [21] in 2015 showed that SWI images demonstrated hyperintense signal at the calcification regions and the presence of haemosiderin deposits with hypointense signal. In our study, we observed that calcification and haemorrhage manifested as low signal on magnitude SWI. But they presented opposite signal features on the corrected phase images: diamagnetic susceptibility of calcification as low signal or mixed signal dominated by a low signal, but paramagnetic susceptibility of haemorrhage as high signal or mixed signal dominated by a high signal. Quantitative analysis showed that the average pixel values of intracranial focal calcifications (-312.5±187.5) had negative deflection whereas small intracranial haemorrhagic foci (541.9±301.7) had positive deflection on phase SWI. There was a significant difference in average pixel values of calcification and haemorrhage {t=19.5, p=0.0001 (p<0.05)}, suggesting that magnitude SWI with phase imaging is feasible for differential diagnosis of haemorrhage and calcification.
Most of the intracranial focal calcifications were not visualized on conventional MR sequences. None of the lesions was seen on T1WI. On T2WI, focal calcifications showed hypointense signal. In our study, most of the calcified lesions were not seen on T2WI. Only 30.3% of lesions were seen on first look on T2WI and 48.4 % were seen on retrospective evaluation of T2WI sequence. As compared to other studies, detection rate of intracranial calcification on T2WI was lower in our study. Holland BA et al., on a group of 50 subjects with intracranial calcified lesions detected by CT, raised a suspicion of the presence of intracranial calcification in approximately 60% of cases on MRI [22]. They found that nine of their 50 calcified lesions entirely escaped detection by conventional MR sequences. Another study by Zhu WZ et al., showed 73.2% detection rate of calcification by T2WI in their study [20].
CT is found to be very sensitive for detection and localization of intracranial calcifications [19]. Reportedly, detection rate of calcification by CT is 10 folds greater than that of routine MRI [23]. Size and location of calcified lesions showed maximal concordance between CT and phase SWI. In our study, about 93.9% of calcifications had been shown on MRI. Few lesions were obscured due to partial volume artefacts from bone (with associated susceptibility artefacts from air in the sinuses), especially in the temporal and frontal lobes because of the orbits and mastoid bones. The results of our study were better than the study conducted by Zulfiqar M et al., in which the sensitivity for detection of calcification by magnitude SWI was 86% [24]. However, in a study conducted by Wu Z et al., detection rate of calcification by magnitude SWI was better than our study and, also the location and size of calcifications perfectly matched with that of CT [1].
Chronic microbleeds are generally defined as asymptomatic small bleeds (diameter <5–10 mm) seen primarily with a MRI T2*-weighted scan. They are considered as a direct marker of vascular disease as they are associated with hypertensive vasculopathy, cerebral amyloid angiopathy, white matter lesions and lacunar infarcts [25-28]. Chronic microbleeds were not visualized on CT and conventional MR sequences. Magnitude SWI has been proved to be sensitive in detection of chronic microbleeds. They presented as high signal intensity or mixed signal intensity dominated by a high signal on phase SWI (in left handed system).
Recently differences in MD values in calcified stage of neurocysticercosis and microbleeds have been described [13-15]. ADC values were evaluated in present study to see if there were any differences between calcification and haemorrhage. Although there were changes in the ADC in presence of calcification and microbleeds compared to surrounding brain parenchyma, the difference in the mean values in the two groups was not statistically significant. Thus, this parameter was not useful to reliably differentiate between foci of calcification and microbleeds. This may be due to inability of the MR system to suppress the thermal and electronic noise as discussed in few of the previous studies [29,30].
Inter observer agreement was better in the detection of calcifications than haemorrhages with SWI phase imaging (k: 0.7 vs 0.5 respectively) as chronic microbleeds were paramagnetic as compared to calcifications which are diamagnetic and causes more distortion of local magnetic field at molecular level leading to different interaction between each nuclear spin of tissue [20].
Limitation
Our study has many limitations. Lesion detection in certain areas such as basifrontal, Paranasal Sinuses (PNS), adjacent to mastoids and close to skull vault was impeded by susceptibility artefacts. Large calcifications were excluded from the study due to aliasing artefacts in areas containing large amount of calcium. In addition, small calcified lesions (<2.5 mm) may escape detection by SWI. Quantitative analysis was done manually which may have inter and intra observer variations. Active haemorrhages consisting of various stages of haemoglobin degradation products were excluded from this study and study consisted of relatively homogenous microbleeds which were characterized by haemosiderin deposits. We planned the study with TE=40 ms on default settings of phase mask available on scanner which may have increased the susceptibility related artefacts. Distinction of cerebral microbleeds from flow voids was also difficult when they appear immediately adjacent to a small vessel.
To further improve the accuracy of MRI in the detection of calcifications and chronic microbleeds, newer technical advancements in SWI are needed. Detection can be improved by automated quantitative assessment of magnetic susceptibility and decreasing the susceptibility artefacts with the use of shorter TE, careful selection of mask and filters with larger window size. A 3D protocol also needs to be developed to facilitate the detection of small sized lesions, which are less than 2.5 mm.
Conclusion
Addition of SWI, in MRI protocol is required for detection of both intracranial calcification and chronic microbleeds and it also reasonably differentiates between the two entities.
*SD = Standard Deviation
1= Susceptibility Weighted Imaging
2= Diffusion Weighted Imaging
3= Averaged Diffusion Coefficient