Dermatophytes are the group of fungi which cause superficial mycoses in humans and animals. As dermatophytes utilize keratin as primary nutritional source, the infection is limited to the non-living cornified areas such as skin, hair and nails [1]. They belong to three major genera, Trichophyton, Microsporum and Epidermophyton, consisting of numerous species. Among them Trichophyton rubrum, an anthropophilic fungi is considered to be the leading aetiologic agent of chronic infections such as tinea cruris, tinea corporis, tinea pedis and tinea unguium worldwide and accounts for 80% of the reported onychomycosis cases [2]. The infection is generally superficial and easy to cure, except in immunocompromised individuals [3]. T. rubrum shows a huge variation in the phenotypic characteristics such as hyphal branching, macroscopic appearance, urease activity and susceptibility patterns to antifungal agents [4]. Patients ignorance and non-compliance of medication has led to the development of resistant by the organism to the drugs, that is attributed to the significant treatment failure in the past decade [5].
Though the infection is superficial, chronic infection further leads to reinfection in different anatomical sites. Hence, identifying the source of infection and mode of transmission is essential to prevent its transmission. The use of standard molecular techniques can differentiate strains among T. rubrum, which will help to identify if the post-treatment recurrent infection [5] is a relapse (same strain) due to treatment failure or co-infection (new strain).
Several molecular methods have been described previously to differentiate strains among T. rubrum isolates, but failed to serve the purpose [6-8]. Jackson CJ et al., have identified significant polymorphism in the NTS region of rDNA clusters of T. rubrum [9]. The NTS region consists of two tandem sub repeat elements (SREs), TRS-1 and TRS-2 [9]. The TRS-1 consists of multiple copies of 200bp tandem repeats with a 49 bp short repeat. Similarly, TRS-2 region consists of multiple copies of 77bp tandem repeat with a 46 bp short repeat [9]. Based on the copy number of the tandem repeats, the length of the TRS region varies. Individual amplification of these TRS regions will produce distinctive band patterns based on the size of the product which will help to identify strain-specific differences in the copy number. In the present study, an attempt has been made to differentiate strains of T. rubrum clinical isolates using NTS region SREs. The method involves amplification of TRS-1 and TRS-2 regions separately and combining the results, thereby subtyping the T. rubrum clinical isolates.
To the best of our knowledge, this is the first study to investigate the strain differences among T. rubrum clinical isolates using NTS region from Tamil Nadu, India.
Materials and Methods
A total of 210 clinical sample of patients from in and around Chennai district, showing lesions typical of dermatophytes infection based on the clinicians’ preliminary diagnosis from outpatient department of dermatology were sent to Mycology Unit, Department of Microbiology, Sri Ramachandra Medical Center, Chennai, India, from April 2011 to March 2013. Patients of all age groups and both sexes were included in the study.
All the isolates were grown in Sabouraud’s Dextrose Agar (SDA) with actidione. The culture characteristics were observed on SDA and Dermatophytes Test Medium (DTM). Microscopic characteristics were observed in Lactophenol Cotton Blue mount (LPCB). Those isolates which did not demonstrate proper microscopic characters in LPCB mount were subjected to slide culture technique with Oat Meal agar and observed. The isolates which were identified as T. rubrum were taken for molecular characterization.
The experimental procedure was approved by Institutional Ethics Committee of Sri Ramachandra University (Ref No: IEC-NI/10/DEC/20/41). Permission was obtained from the medical officer to utilize the clinical isolates from the Mycology Laboratory, Department of Microbiology, SRMC and RI, Chennai, Tamil Nadu, India.
DNA Isolation
DNA was extracted from all the T. rubrum isolates by conventional Phenol:Chloroform method with certain modifications [10]. Briefly, the culture was suspended in 400 μl lysis buffer {10mM TRIS, (pH - 8), 1mM EDTA (pH - 8), 3% SDS and 100 mM NaCl} in a 1.5 ml microfuge tube. About 20 μl of proteinase K (1 mg/ml) (Merck Genei) was added and incubated at 56°C for 30 minutes. It was boiled for one minute. About 400 μl of Phenol:Chloroform (Sigma) (1:1) mixture was added, vortexed and centrifuged at 10,000 rpm for 10 minutes. The aqueous layer was transferred to a new microfuge tube and equal volume of chloroform was added, vortexed and centrifuged at 10,000 rpm for 10 minutes. The aqueous layer was transferred to a new microfuge tube. DNA was precipitated using equal volume of ice cold isopropyl alcohol and washed twice with 70% ethanol. The pellet was suspended in 40 μl sterile nuclease free water and stored at -20°C until use.
Amplification of NTS Region [
9]
PCR amplification of both TRS-1 and TRS-2 region were performed individually in an Eppendorf Gradient master cycler (Eppendorf, Germany). Primers [9] TrNTSF-2 (5’-ACCGTATTAAGCTAGCGCTGC-3’) and TrNTSR-4 (5’-TGCCACTTCGATTAGGAGGC-3’) were used to amplify TRS-1 and primers TrNTSR-1 (5’-CTCAGTCGAACCGT- GAGGC-3’) and TrNTSC-1 (5’-CGAGACCACGTGATACATGCG-3’) were used to amplify TRS-2 region. The primers were synthesised from Sigma Aldrich, India. Each reaction mix contained 25 μl Red Dye PCR master mix (Merck Genei), 50 pmol forward and reverse primer each, 1 μl DNA template. The volume was made upto 50 μl with nuclease free water (Merck Genei).
PCR was carried out for both TRS-1 and TRS-2 regions with denaturation at 95°C for 30 seconds, annealing at 58°C and 55°C for 30 sec respectively and extension at 72°C for 90 seconds. The cycle was repeated 35 times. Also, an initial denaturation at 95°C for five minutes, and final extension at 72°C for 10 minute was done.
Agarose Gel Electrophoresis
Agarose gel (1.5%) was prepared in 1X TAE buffer and 1 μl of Ethidium Bromide (10 mg/ml) was added upon cooling, prior to casting. The amplified PCR products were electrophoresed for 45-60 minutes, at 50 V and visualised under UV light and photographed.
Results
Area Distribution
Patients were from in and around Chennai. Most of the patients were from West Chennai (WC) (26/70) and West Suburbs of Chennai (WSC) (21/70). Six patients from each Central Chennai (CC) and South Chennai (SC). Two patients from South-Western Suburbs of Chennai (SWSC) and one patient each from North Chennai (NC) and North Suburbs of Chennai (NSC). Apart from Chennai, seven patients were from outside Chennai [Table/Fig-1].
Demographic and patient details of T. ruburum with reference to subrepeat elements (TRS-1 and TRS-2) fingerprint type of each isolate.
| S.No | Strain ID | Age | Sex | Diagnosis | Location | Organism | TRS-1 | TRS-2 |
|---|
| 1 | TR-1 | 24 | M | T. corporis | CC | T.rubrum | 1 | I |
| 2 | TR-2 | 33 | F | T. corporis | SC | T.rubrum | 1 | I |
| 3 | TR-3 | 19 | M | T. corporis | WC | T.rubrum | 2 | I |
| 4 | TR-4 | 44 | F | T. corporis | Thiruvallur | T.rubrum | 1 | I |
| 5 | TR-5 | 23 | M | T. corporis | Arakkonam | T.rubrum | 1 | I |
| 6 | TR-6 | 58 | F | T. corporis | WSC | T.rubrum | 1 | I |
| 7 | TR-7 | 47 | M | T. unguium | SC | T.rubrum | 1 | I |
| 8 | TR-8 | 40 | F | T. corporis | WC | T.rubrum | 1 | I |
| 9 | TR-9 | 38 | F | T. manuum | WC | T.rubrum | 1 | I |
| 10 | TR-10 | 52 | M | T. corporis | WC | T.rubrum | 1 | I |
| 11 | TR-11 | 72 | M | T. cruris | WSC | T.rubrum | 1 | I |
| 12 | TR-12 | 32 | F | T. corporis | WSC | T.rubrum | 2 | I |
| 13 | TR-13 | 70 | M | T. unguium | Dindigul | T.rubrum | 3 | I |
| 14 | TR-14 | 80 | F | T. corporis | CC | T.rubrum | 1 | I |
| 15 | TR-15 | 50 | F | T. corporis | WC | T.rubrum | 1 | I |
| 16 | TR-16 | 35 | F | T. corporis | WSC | T.rubrum | 1 | I |
| 17 | TR-17 | 40 | F | T. corporis | WSC | T.rubrum | 2 | I |
| 18 | TR-18 | 29 | F | T. corporis | WSC | T.rubrum | 1 | I |
| 19 | TR-19 | 40 | F | T. corporis | Thiruvallur | T.rubrum | 1 | I |
| 20 | TR-20 | 72 | F | T. corporis | WC | T.rubrum | 1 | I |
| 21 | TR-21 | 45 | F | T. corporis | WSC | T.rubrum | 1 | I |
| 22 | TR-22 | 63 | M | T. corporis | WC | T.rubrum | 1 | II |
| 23 | TR-23 | 36 | M | T. corporis | Thiruvannamalai | T.rubrum | 2 | I |
| 24 | TR-24 | 68 | M | T. cruris | CC | T.rubrum | 1 | I |
| 25 | TR-25 | 27 | M | T. cruris | CC | T.rubrum | 1 | I |
| 26 | TR-26 | 41 | M | T. corporis | WSC | T.rubrum | 3 | I |
| 27 | TR-27 | 22 | M | T. manuum | WSC | T.rubrum | 2 | I |
| 28 | TR-28 | 52 | M | T. corporis | WSC | T.rubrum | 1 | III |
| 29 | TR-29 | 60 | M | T. corporis | SWSC | T.rubrum | 1 | I |
| 30 | TR-30 | 37 | M | T. corporis | SC | T.rubrum | 1 | I |
| 31 | TR-31 | 35 | M | T. unguium | WC | T.rubrum | 1 | I |
| 32 | TR-32 | 59 | F | T. corporis | WC | T.rubrum | 1 | I |
| 33 | TR-33 | 36 | F | T. corporis | WSC | T.rubrum | 1 | III |
| 34 | TR-34 | 26 | F | T. corporis | WSC | T.rubrum | 1 | I |
| 35 | TR-35 | 13 | F | T. corporis | WC | T.rubrum | 1 | I |
| 36 | TR-36 | 22 | M | T. corporis | WC | T.rubrum | 4 | I |
| 37 | TR-37 | 40 | F | T. corporis | WSC | T.rubrum | 1 | I |
| 38 | TR-38 | 33 | M | T. cruris | WC | T.rubrum | 2 | I |
| 39 | TR-39 | 27 | F | T. unguium | WC | T.rubrum | 1 | I |
| 40 | TR-40 | 55 | M | T. corporis | CC | T.rubrum | 1 | II |
| 41 | TR-41 | 56 | F | T. unguium | WC | T.rubrum | 1 | I |
| 42 | TR-42 | 22 | M | T. cruris | WC | T.rubrum | 1 | I |
| 43 | TR-43 | 50 | M | T. unguium | WC | T.rubrum | 5 | I |
| 44 | TR-44 | 23 | M | T. corporis | CC | T.rubrum | 1 | I |
| 45 | TR-45 | 62 | M | T. pedis | NC | T.rubrum | 1 | IV |
| 46 | TR-46 | 61 | M | T. corporis | NSC | T.rubrum | 1 | I |
| 47 | TR-47 | 28 | M | T. corporis | WC | T.rubrum | 1 | I |
| 48 | TR-48 | 14 | M | T. corporis | Kanchipuram | T.rubrum | 1 | I |
| 49 | TR-49 | 19 | M | T. corporis | SC | T.rubrum | 1 | I |
| 50 | TR-50 | 35 | F | T. pedis | WC | T.rubrum | 1 | I |
| 51 | TR-51 | 54 | F | T. unguium | WSC | T.rubrum | 1 | I |
| 52 | TR-52 | 55 | F | T. pedis | WSC | T.rubrum | 1 | I |
| 53 | TR-53 | 33 | M | T. unguium | SC | T.rubrum | 2 | III |
| 54 | TR-54 | 67 | M | T. cruris | WC | T.rubrum | 1 | I |
| 55 | TR-55 | 82 | M | T. corporis | WC | T.rubrum | 1 | I |
| 56 | TR-56 | 35 | M | T. corporis | WC | T.rubrum | 1 | I |
| 57 | TR-57 | 29 | M | T. corporis | WC | T.rubrum | 1 | I |
| 58 | TR-58 | 55 | F | T. corporis | WSC | T.rubrum | 1 | I |
| 59 | TR-59 | 35 | F | T. corporis | WSC | T.rubrum | 1 | I |
| 60 | TR-60 | 20 | F | T. corporis | SWSC | T.rubrum | 2 | I |
| 61 | TR-61 | 58 | M | T. corporis | Vellore | T.rubrum | 1 | I |
| 62 | TR-62 | 39 | M | T. corporis | WSC | T.rubrum | 1 | I |
| 63 | TR-63 | 33 | M | T. corporis | WC | T.rubrum | 1 | III |
| 64 | TR-64 | 14 | M | T. cruris | WSC | T.rubrum | 1 | I |
| 65 | TR-65 | 24 | M | T. cruris | WC | T.rubrum | 2 | I |
| 66 | TR-66 | 29 | M | T. cruris | WC | T.rubrum | 1 | I |
| 67 | TR-67 | 30 | F | T. corporis | WSC | T.rubrum | 1 | II |
| 68 | TR-68 | 21 | F | T. corporis | WSC | T.rubrum | 1 | I |
| 69 | TR-69 | 50 | M | T. cruris | WC | T.rubrum | 1 | III |
| 70 | TR-70 | 19 | M | T. corporis | SC | T.rubrum | 1 | I |
Clinical Manifestation
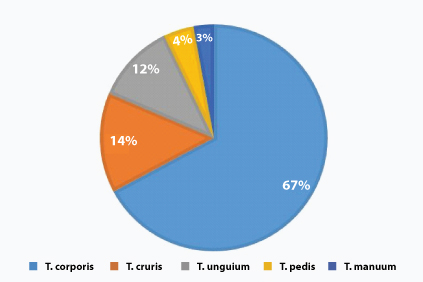
Samples were collected from patient’s various anatomical sites such as epidermal layers of skin, epilated hair and nail scrapings /clippings. Among them tinea corporis was predominant (47/70 samples) with (67%) of infection. Tinea cruris was observed in 10/70 (14%) samples. Tinea unguium was found in 8/70 (12%) samples. Tinea pedis and Tinea manuum were seen in three (4%) and two (3%) patients respectively [Table/Fig-2].
Clinical sites of T. rubrum infection.
Sex Distribution
In our study, it was found that males were infected more than the females. Out of 70 patients with T. rubrum infection, 41 were males and 29 were females.
Age Distribution
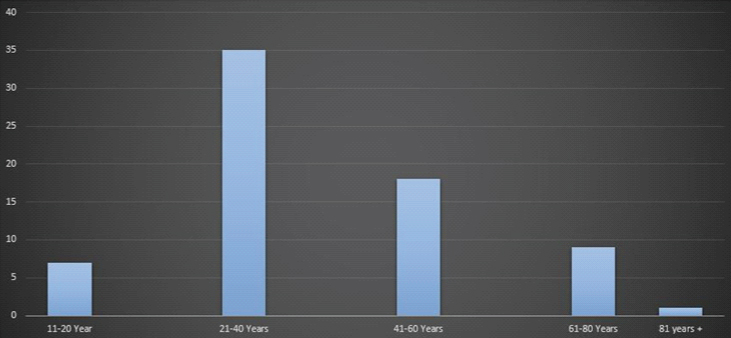
T. rubrum infection had a higher prevalence in adults (21-40 years) with 35/70 patients, followed by middle age group (41-60 years) with 18/70 patients, old age group (61-80 years) with 9/70 patients, young adult group (11-20 years) with 7/70 patients and very old age group (>81 years) with one patient [Table/Fig-3].
Age distribution among patients with T. rubrum infection.
Phenotypic Characteristics of T. rubrum
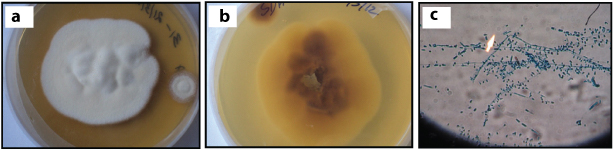
Colonies were fluffy to cottony, white and most of the isolates turned rose pink on aging [Table/Fig-4a], and the reverse showed wine red pigmentation [Table/Fig-4b]. Macroconidia were seen occasionally- thin walled, poorly differentiated with variable size, cylindrical to cigar-shaped. Microconidia were peg-shaped to pyriform, sessile alongside undifferentiated hyphae [Table/Fig-4c].
Phenotypic characters of T. rubrum: a) Macroscopic appearance of culture – obverse; b) Macroscopic appearance of culture- reverse; c) LPCB mount (arrow) showing microscopic features (x400 magnification).
Molecular Characterization of T. rubrum:
TRS-I and TRS-II were amplified in all the isolates producing a distinct banding patterns with each strain.
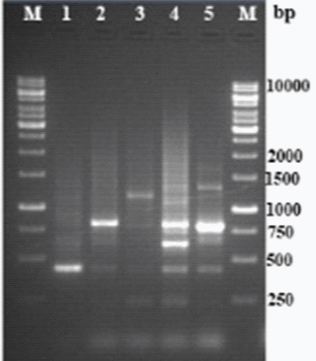
TRS-I: PCR targeting TRS-I loci produced five distinctive banding pattern [Table/Fig-5] with varying product sizes approximately 450bp to 1250bp [Table/Fig-6]. Multiple bands were observed in each type. The isolates were sorted based on the banding patterns.
Amplicon size and strain distribution with reference to TRS-1 SRE loci.
| Type | PCR band size (bp) | No. of Isolates | Percentage distribution |
|---|
| 1 | 450 | 57 | 81.0 |
| 2 | 850 | 9 | 13.0 |
| 3 | 1250 | 2 | 3.0 |
| 4 | Complex banding pattern | 1 | 1.5 |
| 5 | Complex banding pattern | 1 | 1.5 |
| Total | 70 | 100.0 |
PCR fingerprint of representative types of Trichophyton rubrum TRS-1 loci (Lanes: M – 1 kb DNA, 1 – TR-1, 2 – TR-3, 3 – TR-13, 4 – TR-36, 5 – TR-43).
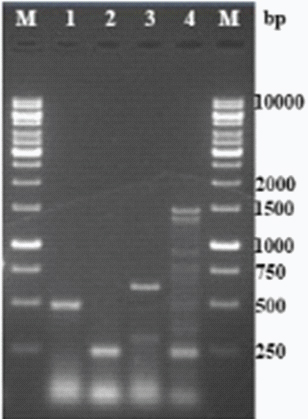
TRS-II: PCR targeting TRS-II loci produced four patterns [Table/Fig-7]. Single band in first two types, two bands in the third type and multiple bands in fourth type. The product size ranged approximately from 250bp to 1500bp [Table/Fig-8].
Amplicon size and strain distribution with reference to TRS-2 SRE loci.
| Type | PCR band size (bp) | No. of isolates | Percentage distribution |
|---|
| I | 500 | 61 | 87.15 |
| II | 250 | 3 | 04.30 |
| III | 600, 300 | 5 | 07.15 |
| IV | Complex banding pattern | 1 | 01.40 |
| Total | 70 | 100.0 |
PCR fingerprint of representative types of Trichophyton rubrum TRS-2 loci (Lanes: M – 1 kb DNA, 1 – TR-1, 2 – TR-22, 3 – TR-28, 4 – TR-45).
The variation in the whole NTS region was studied by combining the banding patterns of TRS-I and TRS-II loci. When both PCR patterns were combined, a total of nine types were observed from the 70 isolates [Table/Fig-9]. The variability in banding pattern produced by individual locus appeared to occur independently.
PCR fingerprint profile of whole NTS region (TRS-1 and TRS–2).
| S.No. | TRS-1 | TRS-2 | Combined type | No. of isolates | Percentage distribution |
|---|
| 1 | 1 | I | A | 49 | 70.0 |
| 2 | 1 | II | B | 3 | 4.3 |
| 3 | 1 | III | C | 4 | 5.8 |
| 4 | 1 | IV | D | 1 | 1.4 |
| 5 | 2 | I | E | 8 | 11.5 |
| 6 | 2 | III | F | 1 | 1.4 |
| 7 | 3 | I | G | 2 | 2.8 |
| 8 | 4 | I | H | 1 | 1.4 |
| 9 | 5 | I | I | 1 | 1.4 |
| | Total | 70 | 100.0 |
Discussion
Although infection with dermatophytes are not life threatening, it causes colossal damage to the economy of tropical countries such as India. Recent advancements in molecular typing has greatly influenced in the understanding of dermatophyte epidemiology. Several techniques have been developed to use DNA polymorphism as molecular markers in fungal infection. These techniques are employed to distinguish between different genera, species and also to identify the differences or relatedness across strains of same species [11].
T. rubrum is considered to be the most prevalent causative agent of dermatophytoses infection [9]. T. rubrum is known to have clonal reproduction property, i.e., it requires only one host to complete its life cycle, which actually helps the organism to maintain the clonal reproduction [12,13]. As the infection spreads very easily, it is important to track the source of infection and the route of spreading. This would eventually help in restricting the spread of infection. Typing the organism using phenotypic method will not be practically useful as the phenotypic characters change greatly upon repeated subculture [14].
Several molecular typing methods such as Random Amplified Polymorphic DNA (RAPD) [7,8,15], Amplified Fragment Length Polymorphism (AFLP) [6,16], Amplification of ITS region and sequencing [17] and Mitochondrial DNA (mtDNA) restriction analysis [12] were previously employed to type T. rubrum isolates. All these techniques are well versed in discriminating T. rubrum from other species and genus but lack discriminating potential to the strain level [6-8,12,15-17].
In an earlier study, Jackson CJ et al., have demonstrated variations upto strain level by analysing the polymorphism present in the NTS region [9,18,19]. Amplification of two different SRE’s TRS-1 and TRS-2 within NTS region produced distinctive banding patterns which are due to variation in the copy number of the SREs. Based on the number of repeats, the size of the PCR product and banding pattern varies. Several studies from different countries have followed the same method to evaluate the strain level variations in T. rubrum and found the method to be simple and reliable [9,18-20].
In the present study, PCR amplification of TRS-I region showed five types based on the different banding patterns [Table/Fig-6]. Type-1 was predominant with total of 57(81%) out of 70 isolates and had a band size of 450bp approximately. This was followed by type 2 with 9/70 (13%) isolates having a band size approximately of about 850bp. The third type was represented by two isolates (3%) with 1250bp and types 4 and 5 were represented by single isolate (1.5%) with complex banding patterns [Table/Fig-5].
Type one, two and three were analogous to the types one, three and five in a previous study conducted by Jackson CJ et al., [9]. The size of the PCR products from each of these types were equivalent to two, four and six copies of the TRS-I sub repeat elements respectively. Only Type-1 and 2 were found in other reports [18-20]. Apart from the specific sized band observed in all the types, there were presence of artefactual bands below the actual band. This may be due to incomplete amplification of the total number of TRS-1 region as all the repeat elements having a primer binding site and presence of 27bp palindromic sequence in each of the repeats which produces the stem-loop formation and incomplete amplicons [9,18].
PCR amplification of TRS-2 region produced four types [Table/Fig-8], of which Type-I was predominant with total of 61 (87.15%) out of 70 isolates, it had a band size of about 500bp. Followed by Type–III with 5/70 (7.15%) isolates having bands of size of approximately 600bp. Type–II had the band size of about 250bp which is different from the size of the sub repeat elements and accounted for 3/70 (4.3%) isolates. Type–IV was represented by only one (1.4%) isolate and produced complex banding pattern [Table/Fig-7]. In TRS-2 PCR amplification, type one and three were analogous to the types, one and two in the earlier study done by Jackson CJ et al., [9]. The size of the PCR products from each of these types were equivalent to two and three complete copies of the 77bp TRS-2 sub repeat elements respectively.
Amplification of both TRS-1 and TRS-2 regions have given straight forward results among clinical isolates by typing based on the number of repetitive elements. On combining both TRS-1 and TRS-2 loci types in NTS region showed a total of 9 types among 70 clinical isolates [Table/Fig-9]. Among which, type-A dominated with 49/70 isolates (70%), followed by type-E with eight isolates (11.5%). Type-C was represented by four isolates (5.8%), three isolates (4.3%) were of type-B, two (2.8%) were type G and the other four types-D,F,H and I were representated by one isolate each [Table/Fig-9].
There was no distinctive relationship between demographic region and the strain types. Amongst isolates in Chennai, Tamil Nadu region, the frequent strain was TRS-1, type-1 and found in all the four quadrants of Chennai city and also in the neighbouring regions [Table/Fig-1]. The second most predominant type was type-2 and was found mostly in West Chennai. Type-3 was present in Chennai and was also isolated from a patient who moved to Chennai from South Tamil Nadu. Other two types were isolated from west Chennai. The possible reason for this pattern is the duplication of TRS-1 copy number by unequal crossover [9]. Hence, strains with high copy TRS-1 region are less in numbers. Similar to TRS-1 region, TRS-2 type-I strain was predominant in whole of Chennai and neighbouring regions. Type-III strain was found mostly in west Chennai and Southern region which was represented by a single isolate. Even though, we couldn’t find any significant relationship with the demographic location and the prevalence of strains. Further study with the isolates from patients with recurrent infection will help to explore the variation in the copy number of subrepeat elements. Although, the present study produced results similar to previous studies [9,18-20] there were discrepancies between present and the earlier study done by Jackson CJ et al., in which none of the Indian isolates produced a common PCR type (Type-1) whereas in the present study, more than 80% of the isolates produced the commonest PCR type [9]. The possible reason for this difference may be due to less number of representative Indian isolates in the previous study or Tamil Nadu state in India might have large number of strains with a common PCR type.
Apart from T. rubrum, NTS region was also exploited for strain differentiation in other species of Trichophyton such as T. mentagrophytes [21], T.tonsurans [22], non-dermatophytic pathogens such as Aspergillus fumigates [23] and Candida krusei [24]. Although, RFLP [25], RAPD [6,9,18,19,25] and AFLP [6] can be used for genotyping, the results are either unreliable with poor reproducibility or the method is cumbersome, which eventually requires expertise to perform. Whereas, in PCR amplification of SREs in NTS region, the results were unchanged inspite of repeat subculture and individual DNA extraction over a period of 18 months (data not shown). Hence, the results were reliable, reproducible and simple to validate. This method is 100% reproducible in comparison with RAPD using two different primers (40% and 30% reproducibility respectively) [18]. As the method is simple and easy to perform, it can be adopted to differentiate the strains of various species for epidemiological purpose.
Limitation
The strain typing was done in a particular tertiary care center with a small number of isolates. To know the actual prevalence of strains in any particular region, a multicentric study with a greater number of isolate is required.
Conclusion
To conclude, the outcome has given a strong representation for using NTS region amplification in discriminating the T. rubrum clinical isolates with greater resolution and reproducibility. Hence, the method can be adapted as a tool for conducting epidemiology and population study in T. rubrum infections.