Worldwide, prostate cancer ranks as the second most common cancer in men and is sixth in number as cause of cancer death [1]. The incidence of prostate cancer in India as a whole was 3.7/100000 persons during the year 2008 [2]. The incidence rates of prostate cancer are constantly and rapidly increasing in all the population based cancer registries in India with the cancer projection data predicting doubling of cases by 2020 [3]. Incidence of this cancer varies widely with different geographical areas. The age adjusted incidence rate of prostate cancer in Delhi (10.66 per 100,000) in 2008 is more than that of Southeast Asia (8.3) and North Africa (8.1) but significantly lesser than North America (85.6), South Europe (50.0) and East Europe (29.1) [4,5]. Increasing life expectancy and lifestyle changes are possible causes for rise in prostate cancer. Wider use of Prostate Specific Antigen (PSA) in the screening for prostate cancer is also one of the reasons for increase in number of new cases [6].
Most of the cases are diagnosed based on elevated serum PSA level, which is followed by a TRUS guided biopsy. Some patients with elevated serum PSA may have negative or equivocal results at TRUS-guided biopsy. Of these, some patients tend to show rising PSA levels with possibility of cancer detection during repeat biopsies. Though, TRUS guided biopsies offer moderately invasive insight about the disease in the gland, there is significant morbidity because of complications such as infection, haematospermia, haematuria and rectal bleeding. Sextant biopsies also show reduced disease detection rate with repetition [7]. Hence, there has always been the need for better imaging options before proceeding for TRUS guided biopsy.
MRI of the pelvis and MRS of prostate have been used for assessing the prostatic lesions since the last decades of 20th century and the mid-1990s respectively [7,8]. DWI has been used in the diagnosis of prostatic lesions since the end of the last decade [9-11]. Though, endorectal coil MRI has been available since the early 90’s of the last century, results have not been very heartening till the advent of mp-MRI [12,13]. The current standard of practice for performance of prostate MRI is using the balloon endorectal coil (er-MRI) on 1.5 T or 3T MRI using pelvic phased-array coils with mp-MRI [14,15]. The mp-MRI includes high resolution T2 weighted images apart from at least two of the following functional MRI techniques {DWI, dynamic contrast-enhanced perfusion imaging (DCE) and MRS}. Here, we sought to establish the accuracy of T2 weighted images and non- contrast sequences (DWI and MRS) in the mp-MRI in differentiating benign and malignant prostate lesions.
Materials and Methods
This prospective study was carried out in the Department of Radiodiagnosis in the Government Kilpauk Medical College, Chennai, Tamil Nadu, India, between January 2016 and December 2016. The study was done following approval from Institutional Ethics Committee. Consent was obtained from all the patients before proceeding with the study.
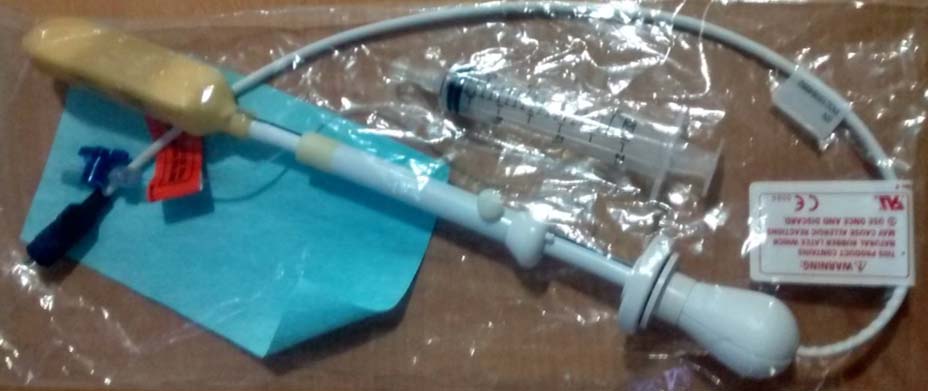
Thirty consecutive patients who were sent for prostate MRI were included in the study and evaluated by using 1.5 T whole body GE Signa HDXT MRI (GE Medical Systems, US). Patients referred for MRI had clinical suspicion of prostatic lesion and total serum PSA of >4 ng/ml done by electro-chemiluminescence immunoassay method. Four patients who had recent biopsy (less than six weeks) and hemorrhage, radiotherapy and those with other pelvic mass lesions infiltrating the prostate were excluded from the study. Patients were imaged in supine position with an endorectal phased-array coil. A disposable expandable endorectal coil [Table/Fig-1] was used in combination with the phased-array coil. Balloon in the endorectal coil was inflated with 70 ml-80 ml of air following anal insertion.
Axial and coronal high spatial resolution turbo spin echo T2 weighted sequences were acquired with following parameters (TR/TE 3400/120 ms, 3 mm section thickness, 0.5 mm spacing, 12 cm field of view and 256 ×256 matrix). Axial T1-weighted (TR/TE 500/8 ms) images were also obtained. DWI was obtained through a multi slice spin-echo single shot echo planar sequence in the transverse plane, using b values of 0, 500 and 1000 sec/mm2. A TR/TE of 4000/80 ms and slice thickness of 5 mm was used. The location, size and signal of the lesions on T2WI were evaluated. Morphological features like seminal vesicle invasion and neurovascular bundle were assessed on T2 weighted images to assess extracapsular extension. The signal intensity of the lesions on T2 weighted images were classified as either hypointense, hyperintense or mixed. The location of the lesions was classified as central, peripheral or both. The location was also classified as either in the apex, mid or base of the gland. DWI images and their corresponding ADC maps were assessed for signal intensity on images acquired at high b values. ADC measurements were acquired at high b values (1000 s/mm2). Three-dimensional MRS imaging was performed using the Prostate Spectroscopy and Imaging Examination (PROSE) sequence, which is water and fat suppressed point resolved spatially localized spectroscopy sequence. All 3D MR spectroscopy data were processed on a work station using specific commercially available software (Functool, GE Medical Systems) developed for 3D MRS studies. The ratios for the choline, creatinine and citrate resonances were calculated after baseline and frequency correction. Lesions with Cho+Cr/Ci ratios more than 0.75 were classified as malignant lesions according to the recent guideline [16]. All the patients underwent TRUS guided biopsy following MRI, based on the findings.
Statistical Analysis
Imaging diagnosis based on the signal change on T2 weighted images, DWI and Cho+Cr/Ci ratios were correlated with the histopathological findings using appropriate statistical analysis (Wilson Score, EPI). ROC curves were plotted for ADC values and Cho+Cr/Ci ratios and the AUC for both were calculated.
Results
Age of the 26 patients included in the study ranged from 37 to 86 years with mean age of 65.9 years.
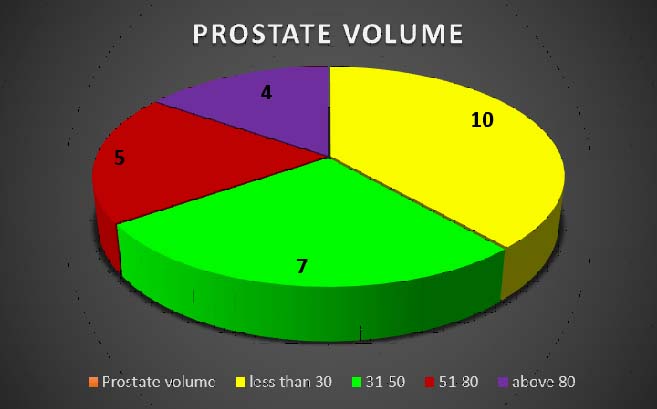
Prostate ranged in volume from 16 to 144 cm3 [Table/Fig-2]. Size of the lesions ranged from 5 mm to 40 mm. Of the 26 patients, seven had benign pathology and 19 had malignant pathology on the histopathological examination.
Pie chart showing prostate volume (in cm3).
Of the 26 patients, 12 patients had lesions in central zone and 12 had in peripheral locations. Two of them had lesions involving both central and peripheral locations. Thirteen patients had lesions in the right half, 11 in the left half and two had lesions involving both halves. Sixteen patients had lesions in the mid gland, six in the base and one in the apex. Three patients had lesions in all the three locations [Table/Fig-3].
Showing the location of the lesion in the prostate gland.
| Location of the lesion in the gland | Number |
|---|
| Central zone | 12 |
| Peripheral zone | 12 |
| Both central and peripheral zone | 2 |
| Apical | 1 |
| Basal | 6 |
| Mid | 16 |
| Apical, mid and basal | 3 |
| Right half | 13 |
| Left half | 11 |
| Both right and left half | 2 |
| Total | 26 |
Based on signal change on T2 weighted images, four were diagnosed as benign lesions [Table/Fig-4a-e] and 22 were malignant lesions. Sensitivity and specificity of the diagnosis of malignancy based on T2 signal were 94.7% and 42.9% respectively. Positive and negative predictive values were 81.8% and 75% respectively [Table/Fig-5].
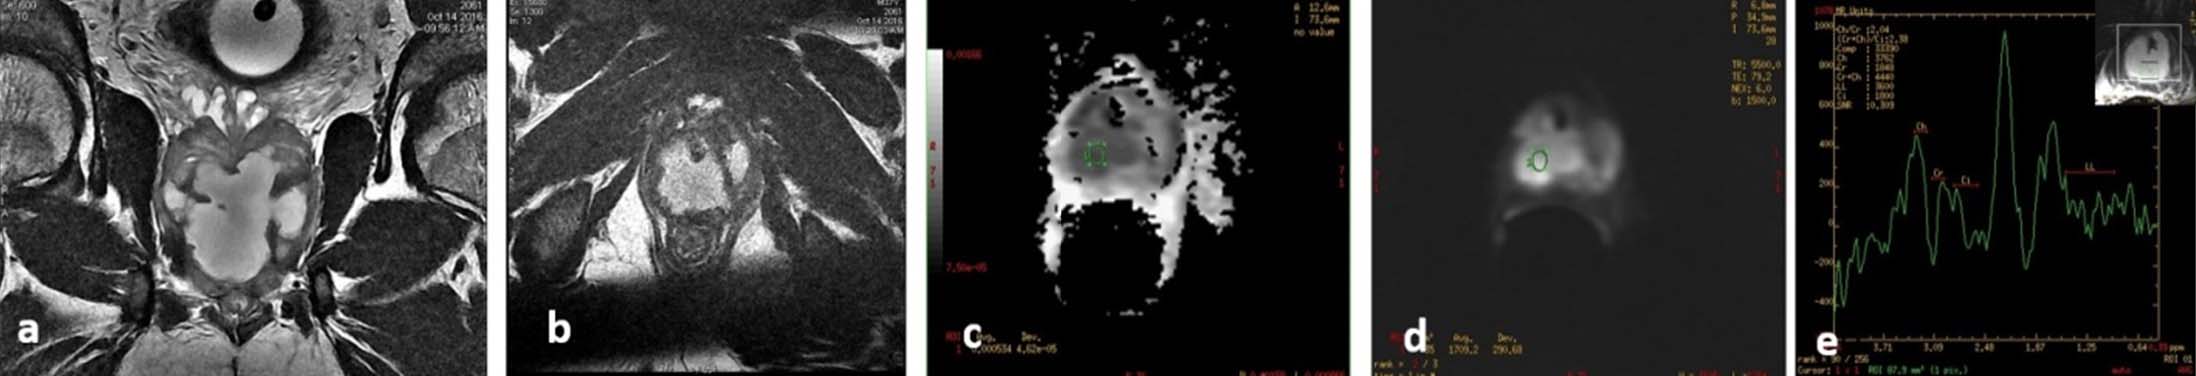
A case of prostatic abscess. a) Coronal and; b) Axial T2 sequences show irregular hyperintense lesion involving both halves of prostate suggestive of abscess; c,d) Diffusion and ADC sequences show restriction with low ADC of 0.5 x 10 -3 mm2/s; e). MRS showing significant lipid lactate peak.
Sensitivity, specificity, positive predictive value and negative predictive value of T2, DWI and MRS in predicting malignancy.
| Variables | T2W | DWI | MRS | Combined (T2 + DWI+ MRS) |
|---|
| Sensitivity | 94.7% | 89.5% | 84.2% | 94.7% |
| Specificity | 42.9% | 85.7% | 28.6% | 42.9% |
| PPV | 81.8% | 94.4% | 76.2% | 81.8% |
| NPV | 75% | 75% | 40% | 75% |
| Diagnostic accuracy | 80.8% | 88.5% | 69.2% | 80.8% |
Based on signal change on DWI images, eight were diagnosed as benign lesions and 18 were malignant lesions [Table/Fig-6,7a-d]. Sensitivity and specificity of the diagnosis of malignancy based on diffusion restriction were 89.5% and 85.7% respectively. Positive and negative predictive values were 94.4% and 75% respectively [Table/Fig-5].
Comparing the imaging diagnosis and HPE diagnosis of benign and malignant prostatic lesions.
| Imaging Diagnosis | HPE Diagnosis |
|---|
| Imaging diagnosis T2 signal | Malignant | Benign | Total |
| Malignant | 18 | 4 | 22 |
| Benign | 1 | 3 | 4 |
| Imaging diagnosi DW I | Malignant | Benign | Total |
| Malignant | 17 | 1 | 18 |
| Benign | 2 | 6 | 8 |
| Imaging diagnosis MRS | Malignant | Benign | Total |
| Malignant | 16 | 5 | 21 |
| Benign | 3 | 2 | 5 |
| Combined MR diagnosis | Malignant | Benign | Total |
| Malignant | 18 | 4 | 22 |
| Benign | 1 | 3 | 4 |
| Total | 19 | 7 | 26 |
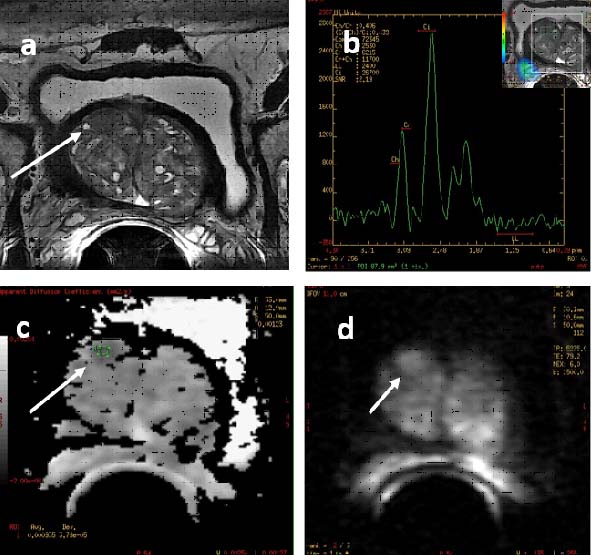
A case of prostatic malignancy. Axial (7a) T2 sequences show well defined hypointense lesion in the right half of mid gland involving both central and peripheral zones; 7b &7c Diffusion and ADC sequences show restricted diffusion with low ADC of 0.3 x 10⁻³ mm2/s; 7d. MRS showing significant increase in Cho+Cr/Ci ratio.
Based on Cho+Cr/Ci ratios on MRS, five were diagnosed as benign lesions and 21 were malignant lesions [Table/Fig-6]. Sensitivity and specificity of the diagnosis of malignancy based on MRS were 84.2% and 28.6% respectively. Positive and negative predictive values were 76.2% and 40% respectively [Table/Fig-5].
Imaging diagnosis based on combining all the three above parameters had sensitivity and specificity of 94.7% and 42.9% respectively. Positive and negative predictive values were 81.8% and 75% respectively [Table/Fig 6]. The accuracy was the same as that of the results based on T2 signal alone.
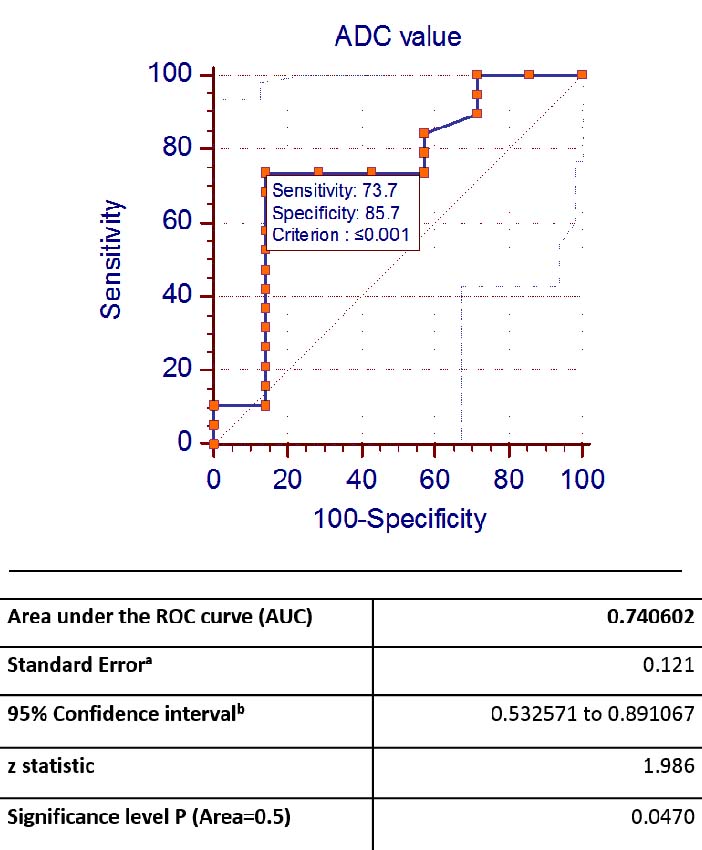
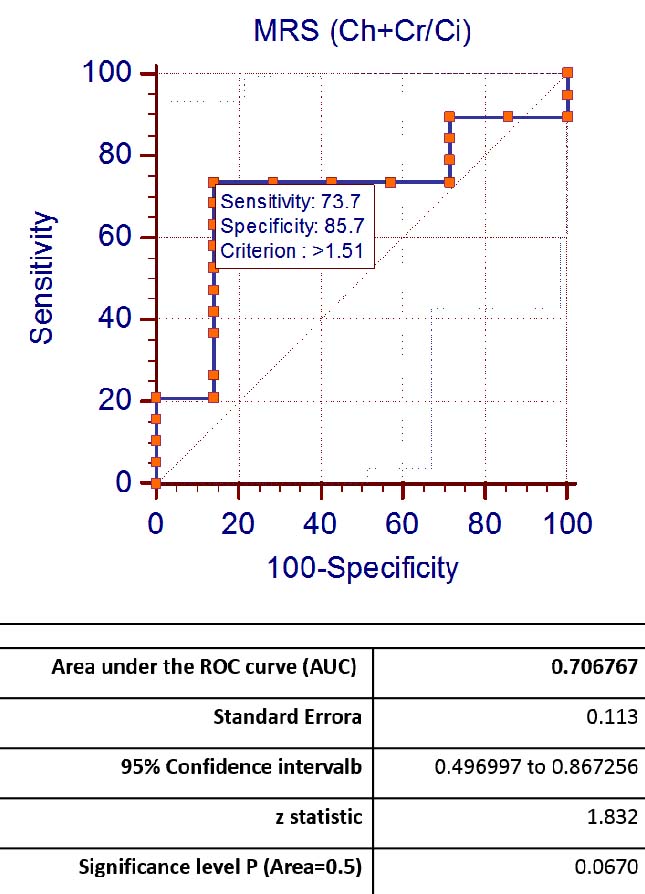
ADC values of the malignant lesions ranged from 0.396 to 1.36 x 10⁻³ mm2/s, with mean of 0.884 x 10⁻³ mm2/s. ADC values of the benign lesions ranged from 0.549 to 2.10 x 10⁻³ mm2/s, with mean of 1.19 x 10⁻³ mm2/s. Cho+Cr/Ci ratios of the benign lesions in this study ranged from 0.56 to 2.56 with mean of 1.34. Cho+Cr/Ci ratios of the malignant lesions in this study ranged from 0.46 to 8 with mean of 2.56 [Table/Fig-8]. ROC curves were plotted for ADC values [Table/Fig-9a] and Cho+Cr/Ci ratios [Table/Fig-9b]. The AUC for ADC and Cho+Cr/Ci was 0.74 and 0.70 respectively.
Showing the ADC values and Cho+Cr/Ci ratios of the benign and malignant lesions in the prostate gland.
| ADC values (in mm2/s) | Mean | Standard deviation | Cho+Cr/Ci ratios on MRS | Mean | Standard deviation |
|---|
| Benign lesions | 1.19 x 10⁻³ | 0.45 x 10⁻³ | Benign lesions | 1.342 | 0.605 |
| Malignant lesions | 0.884 x 10⁻³ | 0.24 x 10⁻³ | Malignant lesions | 2.560 | 1.985 |
Discussion
MRI is the most sensitive imaging technique for prostate cancer staging but the specificity remains low [17]. Prostate carcinoma in the peripheral zone usually appears as low signal intensity lesion on T2 weighted images. Other causes for similar low signal intensity include post biopsy bleed, hormonal treatment, post radiation fibrosis and chronic prostatitis. Though, the mainstay for local staging of prostate carcinoma disease is high resolution T2WI, lack of specificity has warranted the use of the mp-MRI which includes the addition of at least two of the following functional MRI techniques (DWI, DCE and MRS) [14,18].
We wanted to assess accuracy of the non-contrast sequences (DWI and MRS) in the mp-MRI in identifying and differentiating benign and malignant prostate lesions. There has been a similar study in Danish population by Thestrup KC et al., using bipartite MRI (T2 and DWI) in order to confirm the same [18]. In their study of 204 patients, they found that bipartite-MRI (bp-MRI) was as good as mp-MRI at detecting prostate carcinoma. Their study revealed a sensitivity of 94–96% for the bp-MRI and 93%–100% for the mp-MRI.
de Rooij M et al. in their meta-analysis of seven studies on accuracy of mp-MRI, found a high sensitivity and specificity (74% and 88%) respectively, with negative predictive value (NPV) ranging from 65 to 94% [19]. Zhang ZX et al., in their meta-analysis of 14 studies and 698 patients, found the mean cancer detection rate to be 37.5% (19.2%-68.3%). The sensitivity, specificity and PPV of mp-MRI in these studies were 57%, 90% and 17%-92% respectively [20].
In their study of 87 patients, Ganie FA et al., found that T2 weighted images when used alone had accuracy of 58.6%, sensitivity of 83.7%, and specificity of 34%. However, the overall sensitivity of combined endorectal coil MRI and MRS was 87.3%, specificity was 81.3% and accuracy was 86.2% [6].
In our study, the ADC vales of the malignant lesions were lower as compared to the benign lesions. Mean ADC value of the malignant and benign lesions were 0.884 x 10⁻³ mm2/s and 1.19 x 10⁻³ mm2/s respectively. Cho+Cr/Ci ratios of the benign and malignant lesions in our study were 1.34 and 2.56 respectively. Li B et al., in their 56 patients found that DWI was more efficient than MRS in detection of malignant lesions. Combined ADC and MRS performed significantly better than MRS alone in differentiating malignant and benign lesions [21]. The mean ADC value for malignant lesions was significantly lower than that for benign lesions (1.0603+0.1362 x 10⁻³ mm2/s compared to 1.7053+0.3225x10⁻³ mm2/s). The mean Cho+Cr/Ci ratios for malignant and benign lesions were 2.7062+2.1746 and 1.1197+0.8146 respectively [22]. These values were similar to the results in our study.
Emad-Eldin S et al., reported that the ADC values for the benign nodules and malignant lesions were 1.359+0.201 and 0.87+0.13 respectively. The accuracy, sensitivity and specificity for combined T2 with DWI were 90%, 85% and 95% (and higher than when T2 alone was used) [22]. Haider MA et al., and Yagci AB et al., also reported improved accuracy when DWI was used along with T2 weighted images [23,24].
Agarwal A et al., in their study of 50 patients with T2 and DWI with ADC, used a cut off value of 1.4 x 10⁻³ mm2/s to differentiate benign and malignant lesions. The sensitivity and specificity of the T2 and ADC values in predicting malignancy were 88% and 85% respectively. They postulated that benign lesions generally have an ADC value of >1.6 x 10⁻³ mm2/s. Malignant lesions generally have an ADC value of <1 x 10⁻³ mm2/s [25].
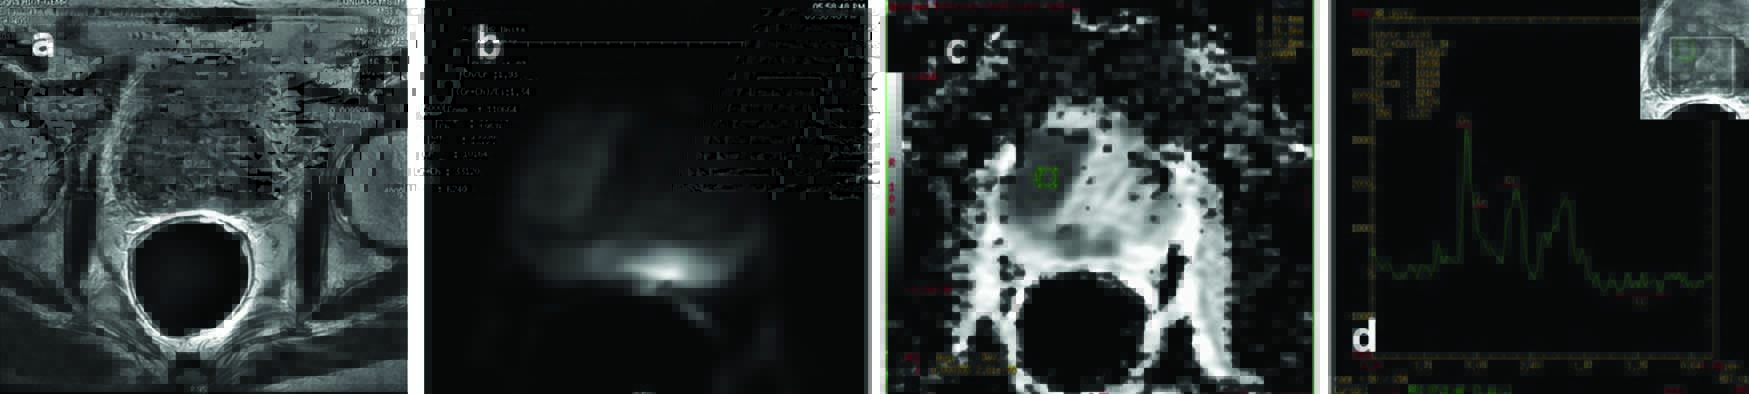
DWI shows better lesion detection especially in the post biopsy setting and is better in detecting seminal vesicle invasion, as depicted in one of our patients [Table/Fig-10a-d] [26]. It is also quite useful in visualizing prostate cancer treated with radiation and hormonal therapy [27].
A case of prostatic malignancy. a) Axial T2 sequences show well defined hypointense lesion in the right anterior aspect of the central mid gland in the background of benign prostatic hypertrophy showing scattered mixed nodular lesions; b) MRS of the lesion showed Cho+Cr/Ci ratio of 0.4 implying benign nature; c,d) Diffusion and ADC sequences showed restricted diffusion with low ADC value of 0.9x10⁻³ mm2/s suggesting malignancy. The nodule turned out to be malignant on HPE suggesting importance of DWI.
Riches SF et al., in their study of 20 patients with mp-MRI found that the combination of two functional parameters showed significant improvement in diagnosing prostatic cancer over use of any parameter alone. However, use of the third parameter did not increase the rate of detection [27]. Rais-Bahrami S et al., in their study of 143 patients found that bp-MRI was better in the detection of prostate malignancy with an AUC of 0.80 (in comparison 0.66 and 0.74 for PSA level and PSA density respectively) [28].
In our study, sensitivity and specificity (89.5% and 85.7% respectively) of the diagnosis of malignancy based on diffusion restriction were quite good. PPV and NPV were also very acceptable (94.4% and 75% respectively). Though, MRS had good sensitivity and PPV (84.2% and 76.2% respectively), specificity and NPV were poor (28.6% and 40% respectively). Imaging diagnosis based on combining T2, DWI and MRS had higher sensitivity and lower specificity than DWI alone (94.7% and 42.9 % respectively). PPV was lower at 81.8% and there was no change in the NPV (75%). Moreover, these values were the same as that of the results based on T2 signal alone. The diagnostic accuracy of DWI was 88.4 %. Hence, we would like to propose that DWI with ADC is the most important sequence in the mp-MRI and can be used in conjunction with T2 weighted images alone (avoiding MRS and DCE) to save time and cost. This proposal is similar to that made by Scialpi M et al., [29].
Limitation
Smaller sample size and unequal distribution of benign and malignant lesions within the group. We could not establish the cut off value of ADC to differentiate benign and malignant lesions as there was significant overlap of values in both groups.
Conclusion
Of the three functional MRI techniques (DWI, DCE and MRS) used in mp-MRI we sought to assess the accuracy of the non-contrast sequences (DWI and MRS) in identifying and differentiating benign and malignant lesions and found that sensitivity, specificity and predictive values of the diagnosis of malignancy based on diffusion restriction were quite good. Hence, T2 weighted images and DWI with ADC (with or without MRS) can be the workhorse for prostate cancer detection as a shortened mp-MRI and significantly reduce cost and time.