Thyrotoxicosis is the clinical spectrum due to increased activity of the thyroid hormones. The causes of thyrotoxicosis include those due to hyperfunctioning thyroid gland (hyperthyroidism) commonly due to Graves’s disease, toxic adenoma and toxic MNG, and those without hyperfunctioning thyroid gland which may be due to silent thyroiditis, subacute thyroiditis, and ingestion of excess thyroid hormone or drugs like amiodarone. It is extremely important to identify the aetiology, as the clinical presentation is more or less common, but the treatment and prognosis differs [1].
Thyroid scintigraphy plays an important role in determining various causes of clinical and subclinical thyrotoxicosis by measuring the functional status of the gland [2,3]. USG is another modality, which is simple and extremely useful. However, there is overlap in USG features of Grave’s and thyroidits and hence a 100% confirmation of cause may not be possible. The usefulness of ultrasonography with assessment of vascularity using colour flow Doppler has been described in literature which shows high diagnostic accuracy [4]. It is especially useful in situations when scintigraphy is contraindicated or is not available. We therefore conducted this study to assess the scintigraphic profile of thyrotoxicosis patients and to correlate it with biochemical and USG findings.
Materials and Methods
Study Design – Cross-sectional descriptive study.
Study was conducted at Command Hospital (SC), C/O AFMC Pune, Maharashtra, India, from September 2014 to February 2016 (18 months). Sixty consecutive patients of newly diagnosed thyrotoxicosis attending were included except pregnant women, patients, less than 18 years of age and those with prior thyroid disease or surgery.
Ethical consideration: Prior clearance was taken from the Institutional Ethical Committee and informed written consent was taken from all patients. Due care has been taken in following the principles laid down by the Declaration of Helsinki.
Laboratory Tests: Serum TSH levels and serum total T4 and total T3 levels were measured using fully automated analyser for radio immunoassay (Model SR 300, Stratec Germany) with reference values of 0.5–6.5 m IU/l, 4.6-13 µg/dl, and 78-182 ng/ dl, respectively.
Ultrasonography Thyroid: USG of neck was carried out by LOGIQ P5 (GE, Milwaukeee, USA) equipped with a 7-12 Mhz linear assay transducer. Standard techniques and parameters of real time gray scale evaluation and Doppler acquisition were followed while examining the patients.
The following vascularity patterns were analysed:
Pattern 0: absent intraparenchymal (or nodular) vascularity or minimal spots; Pattern I: presence of parenchymal (or nodular) blood flows with patchy uneven distribution; Pattern II: mild increase in the color flow Doppler signal with patchy distribution (for nodules: mainly peripheral); Pattern III: markedly increased color flow Doppler signal with diffuse homogeneous distribution (for nodules: intranodular and peripheral vascularity) [5].
A gland showing diffuse hypoechogenicity or normal echogenicity and Type II or III pattern vascularity was considered to be compatible with Grave’s disease and those with Type 0 or 1 vascularity was considered thyroiditis. The finding of a nodule with a solid component measuring >1 cm3 and Type II or III pattern vascularity, accompanied by a Type 0 pattern vascularity in the remaining parenchyma, was compatible with toxic adenoma. The finding of two or more macronodules was compatible with MNG.
Technetium 99 Scintigraphy: Thyroid scintigraphy was performed using a dual headed gamma camera (SPECT ECAM Siemens, Erlangen, Germany) with low-energy, high-resolution collimator with 20% energy window centered at 140 Kev and patient in supine position. The images were obtained after 20 minutes of intravenous injection of 370 MBq (10 mCi) of Tc-99m pertechnetate.
The number of counts present in the thyroid was determined by outlining a manual Region of Interest (ROI) drawn around the borders of the right and left lobe and their respective backgrounds.
Uptake was calculated with the following equation on the basis of thyroid and syringe image counts corrected for acquisition time and the decay of Tc-99m using the software application programmed in E-cam.
TC = counts in thyroid ROI; TP = thyroid ROI pixels; BC = counts in background ROI, BP = background ROI pixels; IC = corrected injection counts; Tc-99m uptake (%) = (TC - BC × TP/BP) × 100 /IC
Interpretation: Uptake value of 0.5%-3.75% was considered normal. Diffuse increase in uptake was compatible with Grave’s disease; hot nodule with suppression or decreased uptake in the remaining parenchyma with overall increased uptake was compatible with Toxic Adenoma (TA); more than one focal area of increased uptake accompanied by intervening cold areas or areas of decreased uptake was diagnostic of Toxic Multinodular Disease (TMD), and reduced or abolished uptake was indicative of thyroiditis.
Statistical Analysis
Data analysis was done by using Statistical Package for Social Sciences (SPSS) version 20. Qualitative data variables were expressed by using frequency and percentage (%). Quantitative data variables were expressed by using Mean and SD. Independent sample t-test was used to find the significant difference between mean TSH, T3, T4 and T3/T4 ratio with respect to Grave’s disease and thyroiditis. ANOVA test was used to compare the clinical findings in different aetiologies. Kruskal-Wallis H test was used to compare mean uptake with respect to thyroid scan findings. A p-value of <0.05 was considered as significant.
Results
Sixty newly diagnosed cases of thyrotoxicosis (34 males, 26 females; mean age 32 years) participated in the study of which 45 cases were of Grave’s disease, 10 cases of thyroiditis and five of cases toxic MNG.
The most common symptoms were palpitation (60%), weight loss (58.34%), fatigue (46.7%) and heat intolerance (41.67%). The most common physical findings were tachycardia (68.34%) and digital tremors (53.3%). The distribution of clinical findings in different aetiologies is depicted in [Table/Fig-1].
Clinical findings in different aetiologies.
| Thyroid Scan Findings | Total | p-value |
|---|
| Grave’s Disease | Thyroiditis | Toxic MNG |
|---|
| Weight loss | 28 | 4 | 3 | 35 | 0.597 |
| Palpitation | 28 | 6 | 2 | 36 | 0.584 |
| Fatigue | 21 | 4 | 3 | 28 | 0.796 |
| Heat Intolerance | 22 | 2 | 1 | 25 | 0.199 |
| Neck Swelling | 33 | 3 | 4 | 40 | 0.054 |
| Eye Signs | 6 | 0 | 0 | 6 | 0.759 |
| Tachycardia | 32 | 6 | 3 | 41 | 0.804 |
| Tremors | 28 | 2 | 2 | 32 | 0.058 |
| Moist hands | 20 | 2 | 2 | 24 | 0.434 |
ANOVA test was used to compare the clinical findings in different aetiologies with p-value <0.05 considered significant
Mean serum T3 and T4 values were higher in Grave’s disease as compared to Thyroiditis and toxic MNG. Serum T3/T4 ratio was higher in Grave’s disease with 66% having a value more than 20 as compared to thyroiditis (33.33%) and toxic MNG (0%). The biochemical parameters in different aetiologies are summarised in [Table/Fig-2].
Biochemical parameters in 60 patients with thyrotoxicosis.
| Parameter | Grave’s Disease | Thyroiditis | Toxic MNG | p-value |
|---|
| Total T3, mean (SD), ng/dl | 375(157) | 234(67.4) | 216(25.4) | <0.005 |
| Total T4, mean (SD), ug/dl | 17.4(4.3) | 15.0(2.7) | 16.44(0.7) | 0.269 |
| TSH, mean (SD), mIU/l | 0.016(.02) | 0.028(0.03) | 0.020(0.01) | 0.276 |
| T3 to T4 ratio >20, No. (%) | 29(66%) | 3(33.33%) | 0(0%) | 0.013 |
Abbreviations: T3, triiodothyronine; T4, thyroxine; TSH, thyrotropin.
MNG- Multinodular goitre; Reference range, T3:- 78–182 ng/dl.
T4:- 4.6- 13ug/dl; TSH:-0.5–6.5mIU/l.
Kruskal-Wallis H test was used to compare the biochemical variables in different aetiologies with p value <0.05 considered significant
Of 60 patients, USG classified 37 patients (61.7%) as Grave’s disease, 15 patients (25%) as thyroiditis, six (10%) patients as MNG and two patients as normal [Table/Fig-3]. Ultrasonography had a sensitivity of 81.82% and specificity of 93.75% in Identifying Graves disease and 100% sensitivity and 82.4% specificity in identifying thyroiditis. Overall sensitivity and specificity of USG in the differential diagnosis of thyrotoxicosis was 91% and 88% respectively [Table/Fig-4].
USG vs 99m Tc scintigraphy.
| USG Findings | Thyroid Scan findings | Total |
|---|
| Grave’s Disease | Thyroiditis | Toxic MNG | Normal Study |
|---|
| Grave’s Disease | 36 | 0 | 1 | 0 | 37 |
| Thyroiditis | 6 | 9 | 0 | 0 | 15 |
| MNG | 1 | 0 | 4 | 1 | 6 |
| Normal Study | 1 | 0 | 0 | 1 | 2 |
| Total | 44 | 9 | 5 | 2 | 60 |
Ultrasound Thyroid: Overall sensitivity and specificity.
| Study | No of cases | Sensitivity | Specificity |
|---|
| Donkol RH et al., [13] | 26 | 88.9 | 87.5 |
| Kumar KV et al.,[6] | 65 | 96 | 95 |
| Kurita S et al.,[12] | 75 | 84 | 90 |
| Present study | 60 | 91 | 88 |
The average scintigraphic uptake was significantly higher in Grave’s disease (15.74% ± 8.64) compared to thyroiditis (0.63 ± 0.6) and toxic MNG (11.46 ± 8.47) and had an inverse relation to age. Two patients had essentially normal study.
Discussion
Clinical findings helped in arriving at an aetiological diagnosis only in six patients of Grave’s disease who presented with ophthalmopathy.
The average TSH value did not vary significantly in the study groups. Though the mean serum T3, T4 values and T3/T4 ratio were higher in Grave’s disease as compared to thyroiditis and toxic MNG there was a marked overlap between the conditions when using the T3 to T4 ratio as a criterion in differentiating aetiology of thyrotoxicosis, as also observed by others [6,7].
The usefulness of USG thyroid with colour flow studies in differentiating different aetiologies of thyrotoxicosis has been reported by various authors and has been incorporated as a standard of care [8-10].
The USG findings compared to 99mTc scintigraphy are depicted in [Table/Fig-3]. The sensitivity and specificity of USG in the differential diagnosis of thyrotoxicosis in various studies is summarised in [Table/Fig-4].
In our study, the sensitivity of USG in identifying Graves’s disease was 81.82% with a specificity of 93.75%, positive predictive value of 97.3% and negative predictive value of 65.22%. Six patients of Graves’s disease were labeled as thyroiditis by USG who had Pattern 0 and 1 vascularity. Patients with mild untreated Grave’s disease can demonstrate intrathyroid hypovascularity, which is also a feature typical of thyroiditis [11]. This might have led to the diagnosis of thyroiditis in patients with Grave’s disease.
In the case of thyroiditis, the USG had a sensitivity of 100%, with a specificity of 82.4%, positive predictive value of 60% and negative predictive value of 100%.
Kurita S et al., after studying 75 patients with thyrotoxicosis, demonstrated 84% sensitivity and 90% specificity of US Doppler in the differential diagnosis of thyrotoxicosis [12]. Donkol RH et al., studied 26 patients with thyrotoxicosis. They used pertechnetate scintigraphy as gold standard in differentiating two types of thyrotoxicosis (Grave’s disease and thyroiditis), the reported sensitivity and specificity of US Doppler were 88.9% and 87.5% respectively with positive predictive value of 94.1% and negative predictive value of 77.8% [13].
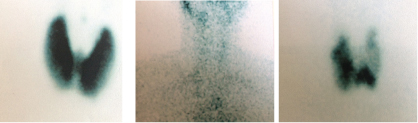
In our study, thyroid scintigraphy diagnosed 44 cases of Grave’s disease who had diffuse increased uptake; [Table/Fig-5a] shows scintigraphy pattern of a typical case of Grave’s disease, nine cases of thyroiditis with reduced uptake; [Table/Fig-5b] shows scintigraphy pattern of a typical case of thyroiditis and five cases of toxic MNG with multiple focal areas of increased uptake as shown in [Table/Fig-5c] In our study, two patients had normal uptake, one patient had an uptake of 0.5% with USG showing no abnormality, on follow up without treatment he became clinically and biochemically euthyroid and was diagnosed to have thyroiditis. Resolving phase of thyroiditis can show normal vascularity and normal uptake as reported by Hisaoka T et al., [14]. Other patient had an uptake of 2.4% with borderline TSH values and minimal symptoms. However, on follow up he had worsening course both clinically and biochemically with a repeat scan showing increased uptake (7.4%). He was diagnosed as Grave’s disease and started on antithyroid drugs with good clinical response.
(a) 99mTc scintigraphy showing diffuse uptake in Grave’s disease; (b) 99mTc scintigraphy showing minimal uptake in thyroiditis; (c) 99mTc scintigraphy showing multiple focal increased uptake in toxic MNG. (All Images left to right)
The study done by Ikekubo K et al., of 201 patients over a period of four years, revealed 24 patients of Grave’s disease with normal (<2.5%) uptake values who had less prominent clinical and laboratory findings [15]. Early phase of Grave’s disease has been described as reasons for the low uptake.
Limitation
The sample size was limited to duration of study, which was one and half year.
The study was conducted in a tertiary care centre catering to Armed forces personnel and their families in the Maharashtra, Andhra and Telangana areas. The families most of the times are treated at their local center itself. The serving personnel are compulsorily referred to tertiary care centre. Hence, there would be male preponderance of patients and the profile obtained in the study cannot be extrapolated to general population.
Conclusion
Tc-99m scintigraphy is a simple, cost-effective and most accurate method to investigate the functional status of thyroid gland and hence, in pinpointing the aetiology of thyrotoxicosis. The clinical and biochemical parameters don’t aid much in the differential diagnosis of thyrotoxicosis. Sonography of thyroid has reasonable sensitivity and specificity in differentiating the aetiologies, and may be used routinely and in situations where scintigraphy is not available or feasible.
ANOVA test was used to compare the clinical findings in different aetiologies with p-value <0.05 considered significant
Abbreviations: T3, triiodothyronine; T4, thyroxine; TSH, thyrotropin.MNG- Multinodular goitre; Reference range, T3:- 78–182 ng/dl.T4:- 4.6- 13ug/dl; TSH:-0.5–6.5mIU/l.Kruskal-Wallis H test was used to compare the biochemical variables in different aetiologies with p value <0.05 considered significant