Vit D, a fat soluble secosteroid, circulates in the body bound to Vit D binding protein, a globulin synthesized in the liver. Vit D is hydroxylated in the liver to 25- hydroxy vitamin D (25[OH] D) and further hydroxylated in the kidney to 1,25- dihydroxy vitamin D (1,25[OH]2D) which is the active form of Vit D. It moderates cell growth and differentiation and regulates gene transcription by binding to the Vit D Receptor (VDR) [1].
VDR is present in more than 30 different tissues which signifies the importance of Vit D in humans [2]. For the past 30 years, many researches have shown that endogenous 25(OH) D and 1,25(OH)2D are very stable in serum or plasma [3] and have suggested circulating levels of serum 25(OH)D as the best method to assess Vit D nutritional status [4,5].
PTB is associated with weight loss, nutritional deficiency and impaired metabolism [6]. In the prebiotic era, sun exposure, TB sanatorium and cod liver oil were commonly used to treat patients infected with TB. All these incidentally are good sources of Vit D [2,7]. DOTS is the current treatment modality for TB which comprises of administration of anti-tubercular drugs in two phases, intensive phase and continuous phase [8]. With the advent of effective antituberculosis drugs, enthusiasm for treating TB with the earlier Vit D rich modalities subsided [9]. Impaired metabolism in PTB may possibly worsen the effects of VDD [6]. In TB, liver functions may be hampered by diffuse hepatic involvement, granulomatous hepatitis or local abscess formation [10].
Previous reports on the interaction between Vit D and anti-tubercular drugs have shown that, rifampicin causes an accelerated loss of Vit D due to increased clearance as it acts as an agonist to pregnane X receptor and inducing the activity of CYP3A4 and limiting the formation of active one alpha 25(OH)2D3 [11]. CYP3A4, a hepatic cytochrome P450 enzyme is involved in drug metabolism, and catabolism of Vit D via a similar pathway as CYP24A1 (an enzyme catalysing the hydroxylation steps of Vit D2 and Vit D3) [12]. Isoniazid causes impairment of 25-hydroxylation leading to impaired Vit D action [13,14], although pyrazinamide, isoniazid and rifampicin have all been associated with hepatotoxicity and the risk is enhanced when these drugs are used in combination. Studies have reported 1–31% of TB patients experience drug related hepatotoxicity following TB treatment [15]. However, isoniazid and ethambutol have been associated with acute kidney injury, rifampin is the most common as reported by most studies [16,17]. Immune responses to TB are influenced by a variety of factors, including younger age [18], diabetes mellitus, tobacco smoking, alcohol, immunosuppressive drugs [19], HIV status, and concurrent infections. Cachexia has been linked to poor prognosis and is a major risk factor for mortality [20]. All these factors are also associated with VDD [21]. The underlying mechanism of how Vit D metabolisms could be linked to the pathophysiology of PTB is complex and not fully understood. This research was carried out to study the changes in Vit D levels in active PTB, the effect of DOTS on Vit D status and alterations in hepatic and renal profiles possibly contributing to the effects.
Materials and Methods
A non randomised controlled trial was carried out from January 2014 to April 2015, consisting of 44 cases of newly diagnosed PTB as defined by Revised National Tuberculosis Control Program (RNTCP) regimen on the basis of sputum smear positivity for acid fast bacilli, Mycobacterium tuberculosis on Ziehl-Neelsen staining and corroborating it with their chest X-ray findings [22]. Patients recruited were of both sexes in the age group of 18 to 60 years from in and around Mangalore, Dakshina Kannada district, encompassing different socio economic backgrounds, from the DOTS centres in Government Wenlock Hospital and Kasturba Medical College Hospital- Attavar, Mangalore, Karnataka, India. Multi drug resistance cases, patients with extra pulmonary tuberculosis, malignancy, diabetes mellitus, renal failure, HIV infection and patients on Vit D or mineral supplementation and immunosuppressive drugs were excluded from the study. Adherence to treatment and follow up of the patients was upheld with the help of DOTS workers for a period of six months till the completion of DOTS therapy. Patients who converted to Category II (2 nos) and those deceased (2 nos) were excluded from analysis. As the objective of the study was to know the effect of DOTS on VDD status in PTB patients, the study was double blinded for both the patients and investigators. Samples were collected before and after treatment but were processed only after completion of treatment to avoid bias and study the effect of DOTS on Serum Vit D levels in PTB.
The study protocol was approved by the Ethics Committee of Kasturba Medical College, Mangalore, Manipal University, Karnataka, India. All participants gave written informed consent to participate in the study and to donate blood samples.
DOTS Treatment
RNTCP, a Government of India initiative working as per the WHO recommendations, implemented DOTS plus facility in the country [23]. The regimen consists of two months of intensive therapy with HRZE followed by continuation with RH for four months {Isoniazid (H), Rifampicin (R), Pyrazinamide (Z), Ethambutol (E) to the Category I patients} [22].
Biochemical Analysis
Four ml of blood sample was collected in sterile plain vacutainer under aseptic conditions from all the subjects. Plasma was separated, labeled and stored at -20oC. Sample collecting procedure was repeated after the patients completed their treatment duration of six months. All the samples were stored at -20oC and the Vit D estimation was done after completion of the study.
Vit D estimation was done by Enzyme-Linked Immunosorbent Assay (ELISA) based on the principle of sandwich technique with commercially available kit on ELx800, BIO-TEK® INSTRUMENTS, INC. Serum 25(OH)D levels from 0-10 ng/ml range were considered as severe Vit D deficiency,11-20 ng/ml as Vit D deficiency, 20-29 ng/ ml as insufficiency, and ≥ 30 ng/ml as sufficiency [24].
Liver function tests: Total bilirubin, direct bilirubin, total protein, serum albumin, alanine aminotransferase, aspartate aminotransferase and alkaline phosphatase were estimated on Hitachi p800 e117 automated analyser using Roche kits (Mannheim Germany) at central laboratory, Kasturba Medical College Hospital, Ambedkar circle, Mangalore, Karnataka, India. Serum globulin was calculated as follows: Serum globulin = serum total protein – serum albumin.
Renal function tests: Serum urea and serum creatinine were estimated on Hitachi p800 e117 automated analyser using Roche kits (Mannheim Germany) at central laboratory, Kasturba Medical College Hospital, Ambedkar circle, Mangalore, Karnataka, India.
Statistical Analysis
The data was analysed using the statistical package IBM SPSS version 20. Comparison of normally distributed parameters before and after DOTS was done by Students’ paired t-test while non- normally distributed parameters were analysed by Wilcoxon Signed Rank test. Vit D was correlated with the other parameters using Pearson’s Correlation test. Independent students’ t-test was used to compare the parameters between two groups. A p<0.05 was considered statistically significant.
Results
A total of 44 patients were inducted in the study. Of them, two patients died and two were excluded since they were shifted to Category II treatment under DOTS as they remained sputum positive after two months of the intensive phase of treatment. The mean age of the study group comprising of 31 males and nine females was 43±13 years. Data of the 40 patients was analysed and the results are presented. Mean Vit D levels were 20.74 ng/ml (normal >30 ng/ml) at the time of diagnosis, which after completion of six months of therapy reduced to 17.49 ng/ml (p-value=0.041). [Table/Fig-1] demonstrates the demographical and biochemical parameters of the patients before and after DOTS treatment.
Baseline characteristics of the patients before and after DOTS.
| Parameters | Before DOTS (n=40)(mean±SD) | After DOTS (n=40)(mean±SD) | p-value |
|---|
| Weight (kg) | 50.47±9.6 | 51.9±9.33 | < 0.001* |
| BMI (kg/m2) | 17.25±2.5 | 17.79±2.57 | < 0.001* |
| Vitamin D (ng/dl) | 20.74±10.27 | 17.49±9.7 | 0.041* |
| Total bilirubin (mg/dl) | 1.54±1.71 | 1.31±1.42 | 0.244 |
| Direct bilirubin (mg/dl) | 0.79±1.06 | 0.62±0.91 | 0.217 |
| Total protein (gm/dl) | 6.5±1.33 | 6.3±0.92 | 0.318 |
| Albumin (gm/dl) | 3.29±1.16 | 3.12±.68 | 0.329 |
| Globulin (gm/dl) | 3.23±0.51 | 3.16±0.55 | 0.379 |
| AST (U/L) | 56±68 | 45±26 | 0.212 |
| ALT (U/L) | 45±40 | 41±24 | 0.469 |
| ALP (U/L) | 121±88 | 112±57 | 0.372 |
| Urea (mg/dl) | 39.53±20.3 | 43±20.5 | 0.003* |
| Creatinine (mg/dl) | 1.06±0.45 | 1.13±0.44 | 0.022* |
*indicates p<0.05 and the parameters show a statistically significant difference. Students’ paired t-test.
Abbreviations: BMI: Body mass index, AST: Aspartate transaminase, ALT: Alanine transaminase, ALP: Alkaline phosphatase.
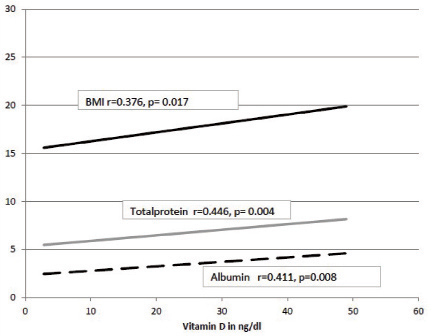
On individual observations, 87% of the PTB patients were Vit D insufficient before treatment. There was a significant increase in weight, BMI, urea and creatinine after DOTS. [Table/Fig-2] shows correlation of Vit D with all the parameters. Vit D was positively correlated with BMI, total protein and albumin before DOTS [Table/Fig-3], and negatively correlated with creatinine after DOTS.
Correlation of Vit D with anthropometric and metabolic parameters before and after DOTS.
| Parameter | Baseline (n=40) | After DOTS (n=40) |
|---|
| r | p | r | p |
|---|
| Weight (kg) | 0.119 | 0.464 | -0.043 | 0.793 |
| BMI (kg/m2) | 0.376 | 0.017* | 0.242 | 0.133 |
| Total bilirubin (mg/dl) | 0.035 | 0.831 | -0.030 | 0.854 |
| Direct bilirubin (mg/dl) | 0.002 | 0.988 | -0.016 | 0.920 |
| Total protein (gm/dl) | 0.446 | 0.004* | 0.208 | 0.199 |
| Albumin (gm/dl) | 0.411 | 0.008* | 0.210 | 0.192 |
| Globulin (gm/dl) | 0.236 | 0.143 | 0.174 | 0.283 |
| AST (U/L) | -0.133 | 0.414 | -0.154 | 0.344 |
| ALT (U/L) | -0.144 | 0.377 | -0.044 | 0.788 |
| ALP (U/L) | -0.239 | 0.137 | -0.226 | 0.161 |
| Urea (mg/dl) | -0.084 | 0.607 | -0.178 | 0.271 |
| Creatinine (mg/dl) | -0.179 | 0.269 | -0.315 | 0.047 |
*indicates p<0.05 and the parameters show a statistically significant difference. Pearson’s Correlation test
Abbreviations: BMI: Body mass index, AST: Aspartate transaminase, ALT: Alanine transaminase, ALP: Alkaline phosphatase.
Correlation of Vit D with BMI, total protein and albumin before DOTS.
Though there was a decrease in mean Vit D after treatment, it was observed to have increased in 30% of the study group as compared to their baseline levels. To analyse the variation, the study subjects were divided into two groups.
Group I: Patients in whom Vitamin D reduced after DOTS (n=28) Group II: Patients in whom Vitamin D raised after DOTS (n=12)
The mean age of Group I and Group II was 45.89±11.4 and 35.08±12.62 respectively which clearly shows that Group II consisted of younger subjects. [Table/Fig-4] shows comparison of parameters before and after DOTS in Group I and Group II. BMI increased in both the groups. Haemoglobin decreased significantly in Group I after DOTS. In Group II, AST, ALT and ALP-values reduced after DOTS. Before DOTS, creatinine level was significantly lower in Group II. After DOTS, urea and creatinine levels were significantly less in Group II.
Comparison of the parameters before and after DOTS in Group I and Group II.
| Parameter | Group I (n=28) | Group II (n=12) |
|---|
| Before DOTS | After DOTS | p-value | Before DOTS | After DOTS | p-value |
|---|
| Weight (kg) | 50.92±10.77 | 52.32±10.37 | 0.010* | 49.41±6.70 | 51.08±6.59 | ≤0.001* |
| BMI (kg/m2) | 17.32±2.66 | 17.84±2.67 | 0.008* | 17.09±2.32 | 17.68±2.39 | ≤0.001* |
| Vitamin D (ng/ml) | 22.15±11.14 | 14.46±8.45 | <0.001* | 17.43±7.27 | 24.56±9.14 | ≤0.001* |
| Hb (mg/dl) | 11.38±1.89 | 11.01±1.06 | 0.026* | 10.5±2.33 | 10.9±2.33 | 0.319 |
| Total bilirubin (mg/dl) | 1.61±1.82 | 1.47±1.6 | 0.536 | 1.36±1.44 | 0.93±.35 | 0.279 |
| Direct bilirubin (mg/dl) | 0.79±1.05 | 0.70±1.06 | 0.859 | 0.78±1.13 | 0.43±0.36 | 0.267 |
| Total protein (gm/dl) | 6.73±1.44 | 7.16±3.75 | 0.378 | 6.03±0.91 | 6.16±0.75 | 0.397 |
| Albumin (gm/dl) | 3.42±1.27 | 3.75±2.85 | 0.323 | 2.99±0.77 | 2.98±0.75 | 0.929 |
| Globulin (gm/dl) | 3.31±0.55 | 3.4±0.99 | 0.585 | 3.04±0.32 | 3.18±0.28 | 0.179 |
| AST (U/L) | 48.5±36.8 | 45.4±26.67 | 0.552 | 74.91±110.9 | 44.25±25.58 | 0.286 |
| ALT (U/L) | 40.71±31.46 | 41.28±27.06 | 0.886 | 54.91±56.77 | 41.83±17.28 | 0.342 |
| ALP (U/L) | 116.77±75.96 | 118.7±62.12 | 0.835 | 129.41±115.8 | 96.33±42.97 | 0.169 |
| Urea (mg/dl) | 43.03±21.58 | 46.58±22.79 | 0.020* | 31.33±14.58 | 34.75±10.29 | <0.001* |
| Creatinine (mg/dl) | 1.17±0.48 | 1.23±0.47 | 0.126 | 0.80±0.22 | 0.91±0.23 | 0.074 |
*indicates p<0.05 and the parameters show a statistically significant difference. Independent students’ t-test.
Abbreviations: BMI: Body mass index, AST: Aspartate transaminase, ALT: Alanine transaminase, ALP: Alkaline phosphatase.
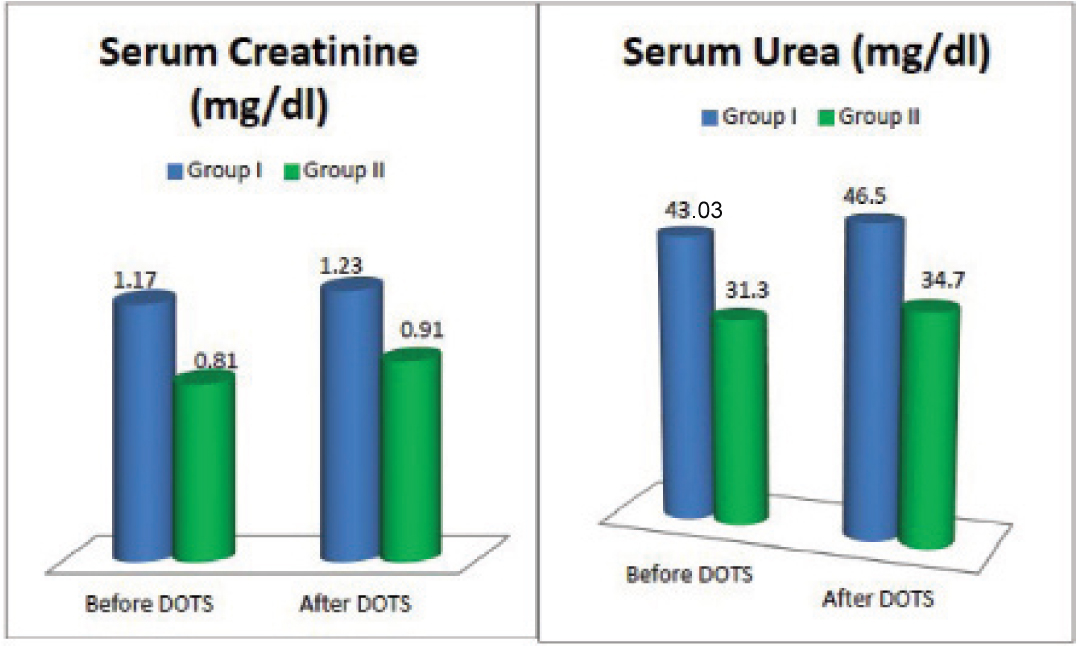
[Table/Fig-5] depicts renal functions in Group I and Group II before and after DOTS. In Group II serum creatinine and urea levels were lower than Group I at the time of diagnosis. There was an increase in serum creatinine and urea levels after DOTS in both the groups.
Renal functions in Group I and Group II before and after DOTS.
Discussion
This study aimed at understanding the Vit D status in active PTB at baseline and after DOTS therapy. The mean concentration of Vit D levels of the study subjects was 20.74±10.27 ng/ml at the time of diagnosis. Similar findings were reported by Sita- Lumsden A et al., who measured Vit D in patients with TB (n=178) and compared it with their healthy contacts (n=130) [9]. The Vit D deficient status at the time of diagnosis may be attributed to the fact that 25-hydroxy vitamin D is low in patients with active TB owing to the effect of inflammatory processes on Vit D metabolism.
It was observed that 87% of the study subjects had hypovitaminosis D (less than 30 ng/ml) at baseline, whereas Friis H et al., with a study group of 655 patients diagnosed with PTB reported hypovitaminosis D in 41.2% patients [5]. This study confirms previous studies that, patients presenting with active TB have significantly lower mean concentrations of serum 25- hydroxycholecalciferol [5,25]. Goswami R et al., reviewed and reported that VDD increases the susceptibility of individuals infected with TB, turning it into an infective disease [2], which is supported by Ralph AP et al., [14]. VDD has been implicated as a risk factor for the development of TB, though a recent supplementation trial showed no clinical impact [26].
The study group consisted of majority of males (77.5%) which is in accordance with the WHO global tuberculosis report 2014 stating most of the TB cases occur in men. Study by Nursyam EW et al., stated that females were more resistant to TB due to higher Vit D response [27]. In our study Vit D was lower in males when compared to females and Vit D reduced significantly in males after DOTS (p-value≤0.001)
Mean Vit D concentration was 17.49±9.7 ng/ml after DOTS which is a significant reduction (p-value=0.041), 85% of the subjects remained Vit D deficient. The decrease in Vit D levels in this study subjects may be due to effects of anti-tubercular drugs, rifampicin which causes accelerated loss of Vit D due to increased clearance [11,12] and isoniazid which causes impairment of 25-hydroxylation leading to impaired Vit D action [13,14]. Kim JH et al., studied effects of Vit D in 165 TB patients of ethnic Korean population reported a non significant decrease in Vit D after treatment (p-value=0.522) [21]. To determine the factors influencing the Vit D status, Vit D was correlated with other study parameters. A significant positive correlation was found with BMI, total protein and albumin before DOTS [Table/Fig-3]. Nursyam EW et al., and Mupere E et al., reported that 41% and 71.6% respectively of their TB study subjects to be in low nutritional status defined by BMI <18.5 kg/m2. We report 70% were malnourished (BMI <18.5 kg/m2) which may be attributed to decreased appetite and increased catabolism during TB [27,28]. Weight and BMI increased significantly [Table/Fig-1] after effective treatment. Vit D showed a significant positive correlation with BMI [Table/Fig-2,3] which supports the beneficiary effect of supplementation of Vit D. Bhargava A et al., assessed the nutritional status of 1175 PTB patients from central India before and after completion of therapy and reported an increase in weight in PTB patients who completed TB treatment successfully (number=765) [29].
Ralph AP et al., proposed a theory, a factor common to both TB and Vit D, Vit D Binding Protein, which might be lower at diagnosis of TB, its function could be changed and affect Vit D binding, it can stimulate macrophages, and transport immune active molecules [14]. Even though not statistically significant Vit D showed a positive correlation with globulin in our study subjects [Table/Fig-2].
The study shows a positive correlation of Vit D with total protein and albumin, markers of synthetic function of liver [Table/Fig-2]. Hassen et al., suggested malnutrition as a risk factor for anti TB drugs induced hepatotoxicity, which leads to depletion of glutathione stores, rendering patients more vulnerable to oxidative injuries, and lowers the pace at which the liver metabolize drugs [15]. This could be a reason for impaired 25 hydroxylation of Vit D in the liver and thereby decrease in mean Vit D after DOTS.
Micronutrient supplements in TB patients reduced the risk of early recurrence in study population of Nansera D et al., emphasizing the role of nutritional support [30]. The addition of vit D in the therapy of moderate advanced PTB had been proven to show a significant difference in sputum conversion compared with placebo. The percentage of radiological improvement was also higher in the Vit D group. Sputum conversion was not influenced by haemoglobin level, calcium level, lymphocyte count, age, or sex [27]. Almost all patients were anaemic at the time of diagnosis in a study by Nansera D et al., [30]. In this study, the entire population was anaemic and it remained so even after the treatment.
Anaemia in TB may largely be due to chronic inflammation. Anaemia is a highly common haematologic complication among TB patients and is a strong risk factor for mortality. In the studies reviewed by Ralph AP et al., spontaneous improvement in Vit D during TB treatment in some instances was noted, which was attributed to the elimination of infection [14]. Tostmann A et al., reported an increase Vit D levels after two months of treatment in 81 PTB patients [31], which they attributed to improved nutrition and increased sunlight exposure. Accordingly on individual observation in our study group, 30% of the study group showed an increase in Vit D levels as compared to their baseline values. To analyse the variation, the study subjects were divided into two groups. Group I: Patients in whom Vitamin D reduced after DOTS (n=28), Group II: Patients in whom Vitamin D raised after DOTS (n=12). The mean age of Group I and Group II was 45.89±11.4 and 35.08±12.62 respectively, it was strikingly clear that raise in Vit D was seen in a younger age group (p-value-0.011).
In Group I, Vit D values reduced from a mean of 22.15±11.1 at baseline to 14.46±8.4 after DOTS (p-value≤ 0 .001) [Table/Fig-4]. In Group II, Vit D values rose from 17.43±7.27 to 24.56±9.14 (p-value≤0.001) after treatment. The lower Vit D at the time of diagnosis in Group II can be explained by the deranged liver function in them. AST, ALT and ALP, marker enzymes of liver function, were elevated in Group II at the time of diagnosis and reduced by 40.93%, 23.8% and 25.5% respectively after treatment indicating normalisation of liver functions. The improvement in the liver function could be attributed to the younger age of the patients. The improved liver function in this group could have led to better 25 hydroxylation of Vit D in liver. Whereas appreciable change in liver function was not noted in Group I.
Urea and Creatinine levels rose after DOTS from their baseline values in both the groups which may be caused by the toxic effect of rifampin on the kidneys, reported by some studies [16,32]. In Group II, urea and creatinine levels remained in the normal range even though there was a slight increase after DOTS as opposed to Group I where the values were in the higher range before and after DOTS [Table/Fig-4].
On comparison of the parameters among the two groups before and after DOTS, in Group I, at the time of diagnosis, creatinine level was significantly high (p-value = 0.016), and after DOTS both urea (p-value = 0.03) and creatinine (p-value = 0.006) levels were significantly higher [Table/Fig-5]. A significant increase in BMI was noted in Group I (p-value=0.008) and Group II (p-value≤0.001) after the completion of treatment when compared with their baseline values [Table/Fig-4].
Vit D deficiency was seen in PTB patients at the time of diagnosis and Vit D reduced after DOTS thus assert the need for Vit D supplementation in those patients.
Limitation
To know the effect of DOTS on vit D status in PTB patients ideally a Randomized controlled trial should be done. Since, it is not ethically possible to have controls who are not on Anti-Tubercular Therapy (ATT), a Non Randomized controlled trial was undertaken.
Conclusion
In conclusion, low serum Vit D status might be associated with a higher risk for TB. Therefore, it may be important to measure serum Vit D levels in TB patients, since Vit D deficiency can occur without any symptoms and can deteriorate upon TB treatment onset. In light of our present findings, results from previous studies, and the current worldwide epidemic of Vit D insufficiency, it would be advisable to recommend Vit D supplementation in TB patients for better outcome. Future studies are required to evaluate the role of Vit D supplementation in TB treatment and prevention, and to determine the appropriate dose and duration for Vit D intake.
*indicates p<0.05 and the parameters show a statistically significant difference. Students’ paired t-test.
Abbreviations: BMI: Body mass index, AST: Aspartate transaminase, ALT: Alanine transaminase, ALP: Alkaline phosphatase.
*indicates p<0.05 and the parameters show a statistically significant difference. Pearson’s Correlation test
Abbreviations: BMI: Body mass index, AST: Aspartate transaminase, ALT: Alanine transaminase, ALP: Alkaline phosphatase.
*indicates p<0.05 and the parameters show a statistically significant difference. Independent students’ t-test.
Abbreviations: BMI: Body mass index, AST: Aspartate transaminase, ALT: Alanine transaminase, ALP: Alkaline phosphatase.