Flexible flat foot is characterized by medial rotation and plantar flexion of the talus, eversion of the calcaneus, collapsed medial arch and abduction of the forefoot [1,2].
In clinical practice flat foot may be diagnosed through different procedures, such as clinical diagnosis [3], radiological study [4] and footprint analysis [5].
Footprint analysis using a pedograph is a simple, swift, and cost-effective method. The three measurements habitually used in the diagnosis of flat foot using a pedograph are: Clarke’s angle [6] the Chippaux-Smirak index [7] and the Staheli index [8].
Prevalence changes with age, the type of population studied and the presence of other pathologies. Some studies show prevalence between 26.5% [12] and 19.0% [13] and other studies on patients with associated comorbidity report a prevalence of 37% [14].
Flat foot has been associated to family history, the use of footwear in infancy, obesity and urban residence [15], and it has also been associated with age [16], gender [17] and foot length [18].
The presence of flat foot has also been associated with the presence of different states of health [19], the presence of pain, and the fatigue in women [12]. Other studies, however, find no relationship of pain or functionality with the changes in the foot [20,21].
We conducted this study, in order to determine the variables associated with the prevalence of flat foot in a random population sample, and the impact on quality of life, dependence, foot pain, disability and functional limitation, using specific and generic questionnaires.
Materials and Methods
A cross-sectional study was conducted between November 2009 and July 2012 from a random population sample from Cambre (A Coruña-Spain) (Cambre Local Council; http://www.cambre.org/).
The sampling frame consisted of individuals resident in Cambre who were identified through the National Health System card census. In Spain, the National Health System has universal coverage, and almost all Spanish citizens are beneficiaries of public health services. The inclusion criteria were being 40 years of age or above and providing informed consent. The sample was randomly selected, after being stratified by age and gender. The sample subjects were sent a personal letter explaining the aim of the study and the explorations to be carried out. They were then contacted by telephone to arrange an appointment at the health center.
The sample size was calculated taking into account the total population of the municipality (n=23,649) after stratification by age and gender. Finally, a total of 835 people were included in the study. This sample size (n=835 people; 445 aged 40-64 years old and 390 aged 65 years and older) makes it possible to estimate the parameters of interest with a confidence of 95% (α=0.05) and a precision of ±3.4%. The general characteristics of a different sample from the same population have already been described above [22].
For each person included in the study, the following variables were studied: anthropometric variables (age, gender, body mass index), study of chronic comorbid diseases (comorbidities) using the Charlson comorbidity index [23], quality of life (SF-36 questionnaire) [24], Foot Health Status Questionnaire (FHS) [25], Foot Function Index (FFI) [25] Barthel index [26], Lawton index [27], and podiatric examination. The podiatric examination was carried out by an experienced podiatrist.
Flat foot Diagnostic
Study of the footprint were obtained with a pedograph. The footprints were obtained by placing a reticulated piece of rubber sheeting, tensed and impregnated with ink, between the subject’s foot and a piece of stretched paper. In order to obtain the footprint, a footprint ink mat was used.
To study the footprint by pedograph, three footprint measurements were used: Clarke’s angle, the Chippaux-Smirak index, and the Staheli arch index [6,8].
The specific methods of measurements of these index were described previously [28].
The study complies with the principles laid down in the Declaration of Helsinki. Informed consent was obtained from all the participants in the study. Confidentiality was preserved in accordance with the current Spanish Data Protection Law (15/1999). Patient and ethical review approval was obtained previously (code 2008/264 CEIC Galicia.
Statistical Analysis
The quantitative variables are expressed as mean±standard deviation (SD); the qualitative variables are expressed as an absolute value (n) and the percentage, with the estimation of the 95% Confidence Interval (CI). Comparisons for quantitative variables were made with the Student’s-t or Mann Whitney test, depending on which was appropriate subsequent to the verification of normality using the Kolgomorov-Smirnov test. Qualitative variable associations were analysed using the Pearson Chi-Square test. In order to account for different variables, a logistic regression analysis and linear regression analysis was used to examine factors associated with events of interest. All statistical analyses were performed using SPSS version 19.0.
Results
The general characteristics studied in the sample, according to the different variables, are shown in [Table/Fig-1]. The mean age was 61.70±11.60 years of age, with a prevalence of overweight of 42.2% and a median for Charlson’s Comorbidity index of 2.0.
Distribution of patients according to demographic characteristics and comorbidity.
| Variables | n | Mean±SD | Median | Minimum-Maximum |
|---|
| Age (years) | 835 | 61.70±11.60 | 63 | 42-91 |
| BMI (kg/m2) | 835 | 29.18±4.74 | 28.65 | 19.13-64.09 |
| Charlson comorbidity index | 786 | 2.31±1.89 | 2 | 0-14 |
| n | % | 95% CI | |
| Gender |
| Male | 369/835 | 44.2% | (40.76;47.62) | |
| Female | 466/835 | 55.8% | (52.38;59.34) | |
| Age Groups | | | | |
| <65 years | 445/835 | 53.3% | (49.85;56.74) | |
| 65 years and over | 390/835 | 46.7% | (43.26;50.15) | |
| BMI Categories |
| Normal weight (18.5 kg/m2≤BMI<25 kg/m2) | 140/832 | 16.8% | (14.17;19.36) | |
| Overweight (25 kg/m2≤BMI<30 kg/m2) | 369/832 | 44.2% | (40.19;47.62) | |
| Obesity(BMI≥30 kg/m2) | 323/832 | 38.7% | (35.32;42.05) | |
| Smoking habit | | | | |
| Former smoker | 212/835 | 25.4% | (22.38:28.40) | |
| Yes | 136/835 | 16.3% | (13.72;18.52) | |
| No | 213/835 | 58.3% | (22.49;28.53) | |
| Charlson comorbidity index |
| Diabetes | 100/815 | 12.3% | (9.71;14.24) | |
| COPD | 55/816 | 6.7% | (4.84;9.33) | |
| Peripheral vascular disease | 48/818 | 5.9% | (4.11;7.39) | |
| Pepticulcer | 46/818 | 5.6% | (3.69;6.85) | |
| Leukaemia | 44/812 | 5.4% | (3.69;6.85) | |
| Myocardial infarction | 37/819 | 4.5% | (2.97;5.89) | |
| Liver Disease | 26/814 | 3.3% | (1.88;4.35) | |
| Connective tissue disease | 21/818 | 2.6% | (1.39;3.68) | |
| Cerebrovascular disease | 14/818 | 1.7% | (0.75;2.61) | |
| Moderate to severe Chronic Kidney Disease | 9/815 | 1.1% | (0.32;1.84) | |
| Congestive Heart Failure | 7/819 | 0.9% | (0.16;1.52) | |
| Dementia | 6/819 | 0.7% | (0.09;1.35) | |
| Metástatic | 1/813 | 0.1% | (<0.01;0.66) | |
| AIDS | 1/814 | 0.1% | (<0.01;0.66) | |
| Peripheral disease | 0/819 | - | - | |
| Hemiplegia | 0/819 | - | - | |
This study revealed that the prevalence of flat foot was 26.62% [Table/Fig-2].
Description of the sample according to type of footprint and presence of different foot pathologies.
| Anthropometric variables | n | Mean±SD | Median | Minimum-Maximum |
|---|
| Foot size (cm) | 812 | 24.92±1.66 | 24.75 | 20.50-29.80 |
| Fore foot width (cm) | 796 | 9.37±0.62 | 9.40 | 7.55-11 |
| Left footprint | n | % | 95% IC | |
| Normal Left footprint | 413/803 | 51.4% | (47.91;54.95) | |
| Left flat footprint | 174/803 | 21.7% | (18.76;24.59) | |
| Left cavus footprint | 216/803 | 26.9% | (23.77;30.03) | |
| Right footprint |
| Normal right footprint | 385/793 | 48.50% | (45.01;52.09) | |
| Right flat footprint | 184/793 | 23.20% | (20.20;26.20) | |
| Right cavus footprint | 224/793 | 28.20% | (25.05;31.44) | |
| Flat foot | 213/800 | 26.62% | (22.49;28.52) | |
| Unilateral | 72/213 | 33.8% | (27.215;40.39) | |
| Bilateral | 141/213 | 66.2% | (59.61;72.78) | |
| Hallux Abductus Valgus | 325/805 | 40.4% | (36.92;43.82) | |
| Unilateral | 38/325 | 11.7% | (8.04;15.34) | |
| Bilatateral | 287/325 | 88.3% | (84.66;91.95) | |
| Hallux Rigidus | 97/801 | 12.11% | (9.79;14.43) | |
| Unilateral | 32/97 | 32.99% | (23.12;42.86) | |
| Bilateral | 65/97 | 67.01% | (57.14;76.88) | |
| Hallux Extensus | 109/805 | 13.5% | (11.11;15.97) | |
| Unilateral | 13/109 | 11.93% | (5.39;18.47) | |
| Bilateral | 96/109 | 88.07% | (81.53;94.61) | |
| One or more claw toes Left |
| Yes | 297/836 | 36.9% | (32.22;38.83) | |
| No | 507/836 | 63.1% | (57.27;64.02) | |
| One or more claw toes Right |
| Yes | 290/836 | 36.1% | (31.40;37.97) | |
| No | 513/836 | 61.4% | (58.01;64.72) | |
In the bivariate analysis, the presence of flat foot is significantly associated with age, comorbidity, BMI and foot size. Among patients diagnosed with flat foot, there was a higher mean age (65.73 vs. 61.03 years of age), a higher comorbidity index (2.99 vs. 2.09), a higher BMI (31.45 kg/m2 vs. 28.4045 kg/m2), and a larger foot size (25.16 cm vs. 24.82 cm). In the bivariate analysis, neither forefoot width nor sex was associated with the presence of flat foot [Table/Fig-3].
Differences between the presence or not of flatfoot and different variables.
| Variables | Flat Foot |
|---|
| Yes | No | |
|---|
| Mean(SD)* | Mean(SD) | p | Crude OR | Adjusted OR**(95% C.I.) |
|---|
| Age (years) | 65.73(11.04) | 61.03(11.45) | <0.001 | 1.037 | 1.029(1.012-1.046) |
| Charlson comorbidity index adjusted for age | 2.99(2.11) | 2.09(1.75) | <0.001 | 1.275 | |
| Charlson comorbidity index | 0.92(1.49) | 0.50(0.98) | <0.001 | 1.335 | 1.217(1.042-1.421) |
| BMI (kg/m2) | 31.45(5.55) | 28.40(4.17) | <0.001 | 1.147 | 1.137;(1.094-1.181) |
| Forefoot width (cm) | 9.42(0.64) | 9.41(2.01) | 0.983 | 1.001 | |
| Foot size(cm) | 25.16(1.66) | 24.82(1.65) | 0.011 | 1.131 | 1.287(1.102-1.504) |
| n (%) | n (%) | p | | |
| Age Groups | | | <0.001 | | |
| 40-64 years | 86/425(20.22%) | 339/425(79.8%) | | 1 | |
| ≥ 65 years | 127/375(33.9%) | 248/375(66.1%) | | 2.019 | |
| BMI Categories | | | <0.001 | | |
| Normal weight (18.5 kg/m2≤BMI<25 kg/m2) | 23/135(17%) | 112/135(83%) | | 1 | |
| Overweight (25 kg/m2≤BMI<30 kg/m2) | 57/351(16.2%) | 294/351(83.8%) | 0.832 | 0.944 | |
| Obesity (BMI≥30 kg/m2) | 133/312(42.6%) | 179/312(57.4%) | <0.001 | 3.618 | |
| Gender | | | 0.419 | | |
| Male | 99/353(28%) | 254/353(72%) | | 1 | 1 |
| Female | 114/447(25.5%) | 333/447(74.5%) | | 0.878 | 1.618(0.963-2.717) |
SD*: Standard Deviation
Adjusted OR*: Adjusted Odds Ratio by age of the patient. Charlson’s comorbidity score. BMI. foot size and gender.
After conducting a multivariate logistic regression analysis, the following variables were observed to have an independent effect associated with the presence of flat foot: BMI (OR=1.137), age (OR=1.029), mean foot size (OR=1.287) and comorbidity (OR=1.217) [Table/Fig-3]. That is, the higher the value of the different variables described above, the greater the possibility of flat foot.
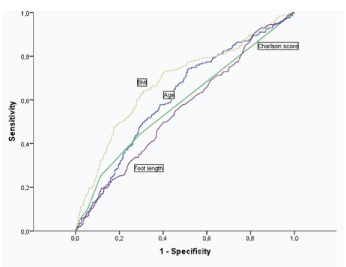
If we study the Area Under the Curve (AUC) to predict the presence of flat foot according to each of the aforementioned variables, those which best predict said possibility are BMI (AUC=0.683) and age (AUC=0.614).
The scores for the different questionnaires used to measure foot function; quality of life and dependence, according to the presence or absence of flat foot in the entire sample were studied, and stratified by sex, as shown in [Table/Fig-4].
Differences between the presence or not of flatfoot stratified by sex according to the questionnaires studied.
| Total Sample(n=835) | Flat Foot | Female (n=466) | Male (n=369) | p |
|---|
| p | Flat Foot | p | Flat Foot |
|---|
| Yes | No | Yes | No | Yes | No |
|---|
| Mean(SD) | Mean(SD) | Mean(SD) | Mean(SD) | Mean(SD) | Media (SD) |
|---|
| SF-36 |
| Physical summary | 53.72(8.25) | 54.55(7.78) | 0.189 | 53.06(9.60) | 55.48(7.95) | 0.017 | 54.48(6.29) | 53.34(7.37) | 0.148 |
| Mental summary | 47.25(9.55) | 48.53(8.48) | 0.086 | 48.14(9.94) | 48.49(8.98) | 0.744 | 46.22(9.02) | 48.60(7.80) | 0.015 |
| Barthel index | 97.38(11.23) | 99.43(4.03) | 0.052 | 96.80(12.42) | 99.41(3.23) | 0.112 | 97.95(9.97) | 99.46(4.83) | 0.183 |
| Lawton index | 6.14(1.89) | 6.52(1.57) | 0.040 | 7.54(1.51) | 7.87(0.63) | 0.104 | 4.74(0.96) | 4.91(0.42) | 0.188 |
| Foot Health Status Questionnaire |
| Foot pain domain | 86.91(29.63) | 90.52(17.62) | 0.024 | 82.12(22.56) | 86.90(19.97) | 0.047 | 92.47(10.19) | 95.28(12.49) | 0.132 |
| Function domain foot | 90.30(19.64) | 94.36(14.55) | 0.006 | 86.51(21.96) | 92.13(16.81) | 0.014 | 94.71(15.53) | 97.30(10.19) | 0.129 |
| Footwear domain | 60.07(37.38) | 68.44(35.60) | 0.004 | 53.95(37.79) | 64.48(35.77) | 0.008 | 67.26(35.75) | 73.62(34.77) | 0.130 |
| General foot health domain | 48.88(21.66) | 53.67(20.89) | 0.005 | 44.19(22.99) | 49.89(21.02) | 0.021 | 54.34(18.66) | 58.63(19.67) | 0.064 |
| Foot function Index | 7.63(13.93) | 5.22(11.58) | 0.055 | 9.76(13.53) | 12.73(6.86) | 0.082 | 4.91(14.06) | 2.84(9.17) | 0.178 |
SF -36, Bartheland Lawton index, Foot Health status questionnaire and Foot function index.
SD: Standard Deviation
In described table it can be observed that patients suffering from flat foot have significantly lower scores in the different quality of life domains in the FHSQ than non-sufferers. These values are consistent both in men and women, being, in turn, significantly lower in females, and close to significant levels in males.
It can also be seen that the FFI is higher in patients suffering from flat foot than in non sufferers, with described difference being on the borderline of statistical significance. This index shows that the higher the score, the worse the foot function. Neither the dimensions of the physical and mental summary of the SF-36 nor of the Barthel index were altered significantly with flat foot.
Although in the bivariate analysis significant differences have been found between the values on the Lawton scale and suffering from flat foot or not, the dependence for instrumental activities (Lawton Scale) is not related with the presence of flat foot, rather with age comorbidity.
Different scores in the FHSQ and in the FFI were modified by the presence of flat foot, the extent to which this effect is maintained after taking into consideration other variables (e.g., age, gender and comorbidity) was studied with different regression models which are shown in [Table/Fig-5].
Multiple linear regression to predict the different dimensions of foot health status questionnaire and the FFI adjusting for gender, age, comorbidity and presence of flatfoot.
| Variables | Linear regression model to predict dimension score foot pain FHSQ |
|---|
| B | Standard error | Beta | t | p |
|---|
| Gender | -9.225 | 3.743 | -0.249 | -7.016 | <0.001 |
| Age | -0.007 | 0.060 | -0.004 | -2.134 | 0.913 |
| Charlson Score | -1.284 | 0.602 | -0.080 | -2.134 | 0.003 |
| Flat Foot | -2.931 | 1.510 | -0.070 | -1.942 | 0.053 |
| Variables | Linear regression model to predict dimension score function foot FHSQ |
| B | Standard error | Beta | t | p |
| Gender | -5.872 | 1.148 | -0.183 | -5.116 | <0.001 |
| Age | -0.054 | 0.053 | -0.039 | -1.029 | 0.304 |
| Charlson Score | -1.009 | 0.525 | -0.073 | -1.922 | 0.055 |
| Flat Foot | -3.329 | 1.317 | -0.092 | -2.528 | 0.012 |
| Variables | Linear regression model to predict score footwear dimension FHSQ |
| B | Standard error | Beta | t | p |
| Gender | -10.305 | 2.591 | -0.142 | -3.977 | <0.001 |
| Age | -0.519 | 0.119 | -0.165 | -4.351 | <0.001 |
| Charlson Score | 1.286 | 1.185 | 0.041 | 1.086 | 0.278 |
| Flat Foot | -6.897 | 2.979 | -0.084 | -2.315 | 0.021 |
| Variables | Linear regression model to predict overall health score foot dimension FHSQ |
| B | Standard error | Beta | t | p |
| Gender | -9.214 | 1.527 | -0.215 | -6.035 | <0.001 |
| Age | -0.094 | 0.070 | -0.051 | -1.336 | 0.182 |
| Charlson Score | -1.248 | 0.699 | -0.068 | -1.786 | 0.074 |
| Flat Foot | -3.614 | 1.752 | -0.075 | -2.063 | 0.039 |
| Variable | Linear regression model to predict final score of the Foot Function Index |
| B | Standard error | Beta | t | p |
| Sexo | 4.400 | 1.031 | 0.177 | 4.269 | <0.001 |
| Edad | 0.056 | 0.049 | 0.051 | 1.155 | 0.249 |
| Charlson score | 1.242 | 0.489 | 0.112 | 2.540 | 0.011 |
| Pie plano | 1.821 | 1.187 | 0.066 | 1.534 | 0.126 |
After performing described regression, it can be observed how, after adjusting or taking into consideration the age, gender and comorbidity, the presence of flat foot continues to modify the score of the different dimensions in the FHSQ.
With regard to the functionality measured by the FFI, it can be seen that the presence of flat foot is in turn close to being significant and has a positive regression coefficient, which would seem to imply that the presence of flat foot increases the score in the FFI and hence it reduces functionality [Table/Fig-6].
Area under the curve (AUC) to predict flat foot according to different variables.
Discussion
Flatfoot is a biomechanical disorder frequently seen in clinical practice.
This study reveals that the prevalence of flat foot was 26.62%. Described finding is practically identical to a study conducted in Japan on a sample of 242 women and 98 men, in which a prevalence of 26.5% was observed, along with how said finding is related with obesity and the effects of pain and functionality [12].
Similar findings regarding the prevalence of flat foot can be found in other publications. In other population studies (Springfield, Massachusetts) the prevalence of flat foot was 19.0% (20.1% in females and 17.2% in males) [13]. Another study conducted in the Boston area found a prevalence of 20% in women 17% in men [11]. There are even studies, conducted in a diabetic population on a sample of 230 patients, which refer to a prevalence as high as 37% [14].
It would seem clear that the characteristics and age of the population under study were determinant in said prevalence. Thus, we also observed that in a sample of 2,100 Saudi Arabian army recruits aged between 18 and 21, a prevalence of 5% was found, and the factors associated to its presence were family background, the use of footwear in infancy, obesity and urban residence, with no differences being found in functionality or foot discomfort [15].
Another study conducted in India reveals how the use of footwear at early ages, along with obesity and ligamentous laxity, increases the prevalence of flat foot [29].
Another study conducted in Nigeria on 560 children aged between six and 12 years shows that although in the univariate analysis an association was found with type of footwear and age, after taking both into consideration, only age remained as a variable associated the presence of flat foot [16].
Urban residence as a risk factor for the prevalence of flat foot has also been described in a study conducted on children in the Congo, where, after studying 1,851 footprints from 906 girls and 945 boys aged between three and 12 years, it was observed that prevalence diminishes with age, is higher in urban areas and in the masculine sex, and that the use of footwear has little influence on said prevalence [17].
This study shows how the BMI, comorbidity and foot size are associated with the prevalence of flat foot. There are variability in the literature review. A number of studies describe how this foot disorder increases with age [17], other studies describe how flat foot diminishes with age, after adjusting for other covariates [18], and others indicate that neither age, gender nor BMI are related with flat foot [19].
Studies conducted in primary schools identified gender and being overweight as risk factors for flat foot [20,21], while studies on adolescents [22] and pre-school children [23] detected flat foot associated to an increase in the BMI.
The association between foot length and the presence of flat foot has also been referred to in the literature [24], although there are also authors who refute the existence of any such association [19].
In the adult population, this disorder has also been found to be associated with race and with concomitant foot disorders [19,30-32].
A number of studies also describe different radiological findings in the morphology of the foot according to different ethnic groups [33,34].
Others indicate how the different radiological morphology (angle of the talus with the first metatarsal) is related with the symptomatic presence or absence of flat foot [34].
Even though obesity has repeatedly been associated with the presence of flat foot [35], not all studies point towards this association [36].
In some articles, not only is the association of flat foot with characteristics (e.g., age, sex, BMI and concomitant illness) indicated, but also as a modifier of health [19].
Thus, there are studies of 97,279 military recruits which associate flat foot with localised knee pain [37].
As we have previously mentioned, in the article which finds a prevalence of flat foot identical that in our study [12] it can also be seen how said alteration is also associated with the presence of pain and fatigue in women.
Other studies conducted on recruits to the Australian armed forces show how foot disorders are not related with pain, lesions or foot function, although flat foot is associated with a subjective sensation of physical health lower that those with normal feet [21].
In another work studying an adult population in Boston (n=784) no association was found between foot alternations, pain and function [20].
Other studies find an association between the presence of flat foot and accidents arising in the training of professionals in the armed forces [38], although this finding is not consistent in all publications [39].
Flat foot was also found to be associated with disability in workers with spondylarthrosis [40] and in fractures of the lower limbs [41].
This study, conducted on a random population sample, shows that quality of life and foot function in patients with flat foot is lower that in those who do not suffer from the disorder, and that said effect remains after adjusting for age, sex and comorbidity using the FHSQ and FFI questionnaires. The use of specific instruments for measuring the disorder is important, as in this work, general health questionnaires, such as the SF-36, have not shown any differences between sufferers and non-sufferers of flat foot. Similar results were found by other authors, who observed no differences between patients with foot disorders and not using the SF-36 and a quality of life measuring instrument [42].
The SF-36 is sensitive to the changes, but it is a generic questionnaire. The SF-36 is described as a useful tool for detecting changes in results subsequent to Hallux valgus surgery [43].
Other authors have described a progressive reduction in the components of the SF-36 as the severity of the Hallux valgus increases [44].
The use of specific questionnaire for studying quality of life and foot function is extensively documented in the literature [25,45,46].
The changes noted in quality of life by the FHSQ questionnaires and the foot disorder has also been described in the literature [45,47,48].
The validity of the Spanish versions of the FHSQ and the FFI has been addressed in the references [49,50].
Thus, it seems reasonable to have observed in this study that the use of specific questionnaires on the foot reveal significant differences which other, more generic, questionnaires have failed to detect.
Limitation
The study was performed with a random population sample in which the response rate for the population aged 40 to 64 years was 74.83% and for the 65 years or older age group was 65.02%. Approximately 33% of the losses were due to the impossibility of finding people using the health-care identification provided by the National Health System. Most of these losses in the oldest age group were as a result of the patient having died by the time of the appointment.
According to the literature, this response rate can be considered good. In a recent systematic review of 34 population-based epidemiologic studies of foot and ankle pain prevalence, the median response rate was 60.1% (range, 6.2%–94.9%). In other contexts, some authors, such as Babbie ER, state: “a review of the published social research literature suggests that a response rate of at least 50 percent is considered adequate for analysis and reporting [51].
To minimize the information bias, we used validated questionnaires (SF-36), and the examination was performed by previously trained podiatrist. This study focused on biomechanical alterations of the foot and not on alterations of the skin or nails, which are also important problems in podiatric medical conditions.
In other to take into a count confounding variables, like comorbidity, age, and gender multiple regressions analysis was performed.
Conclusion
Flat foot was associated with age, Charlson’s Comorbidity Index, BMI and foot size. The SF-36, Barthel and Lawton questionnaires remained unaltered by the presence of flat foot. The FHSQ and FFI questionnaires did prove to be sensitive to the presence of flat foot in a significant manner.
SD*: Standard Deviation
Adjusted OR*: Adjusted Odds Ratio by age of the patient. Charlson’s comorbidity score. BMI. foot size and gender.
SF -36, Bartheland Lawton index, Foot Health status questionnaire and Foot function index.
SD: Standard Deviation