CKD is an emerging health problem worldwide. Due to increasing prevalence of conditions like diabetes mellitus and hypertension among the global population, there has been an increase in the number of individuals affected with CKD.
One of the major concerns of CKD is the associated morbidities and mortalities. Most patients are diagnosed during the End Stage Renal Disease (ESRD) of CKD and often succumb due to complications even with initiation of dialysis, as a result of delayed intervention [1]. Therefore, early diagnosis and timely intervention is needed to prevent disease progression.
Current assessment of renal function mainly involves estimation of serum or urinary markers and, in some cases, radiological and histopathological studies.
SCr is being commonly used by physicians to monitor renal disease progression and treatment response due to the ease of estimation. Several formulae are also available to calculate eGFR based on a single SCr value.
However, SCr is not very sensitive in diagnosing early stages of kidney disease. It is known that more than 50% reduction in Glomerular Filtration Rate (GFR) is needed before SCr level increases above the normal upper reference range [2].
Among the several novel biomarkers discovered, SCysC has been proposed to be a promising marker which can help detect early nephropathy. Human SCysC is a low molecular weight cysteine protease inhibitor produced by almost all nucleated cells present in the body. It is filtered freely in the glomerulus, gets reabsorbed in the proximal tubules and degraded [3]. SCysC is superior to SCr in the estimation of renal function as it is not influenced by age, sex and body mass [4]. However, studies have shown that use of glucorticoid drugs [5], altered thyroid status [6], pregnancy [7], malignant conditions [8], liver disorders [9] and cardiovascular abnormalities [10] can also bring about alterations in SCysC level.
This study was undertaken to determine and compare the levels of SCr and SCysC in CKD subjects across various severity groups based on eGFR.
Materials and Methods
The study was carried out at Justice KS Hegde Charitable Hospital, Mangalore, Karnataka, India by the Department of Biochemistry, on 120 subjects diagnosed with CKD who visited the Nephrology OPD between October 2014 and June 2016. The study protocol was approved by the Institutional Ethical Committee. Informed consents were obtained from all the study participants. A diagnosis of CKD was made by the nephrologist based on the National Kidney Foundation Kidney/Disease Outcome Quality Initiative guidelines [11]. CKD subjects aged between 35-70 years were included in the study. Individuals with cardiovascular disorders, thyroid disorders, chronic illnesses, malignancies, liver diseases, myopathies, subjects on glucocorticoid therapy and pregnant women were excluded from this study.
A sample of 5 ml venous blood was collected from each subject and drawn into a plain serum vacutainer. The sample was allowed to clot for 30 minutes and centrifuged to obtain serum. Serum samples were stored at -20 degree Celsius until analysis. Biochemical parameters analysed were SCr and SCysC. SCr was estimated by modified Jaffe’s method [12] and SCysC was estimated by particle enhanced immunoturbidimetric method [13] in ROCHE COBAS c311 clinical chemistry automated analyser. Estimated GFR was derived using CKD epidemiology collaboration group 2009 creatinine based formula [14] as mentioned below:
eGFR = 141 x min(SCr/κ, 1)α x max(SCr /κ, 1)-1.209 x 0.993Age x {1.018 if female} x {1.159 if Black}
Where, eGFR (estimated glomerular filtration rate) = ml/min/1.732 m2
SCr = Standardized serum creatinine in mg/dl
κ = 0.7 (females) or 0.9 (males)
α = -0.329 (females) or -0.411 (males)
min = indicates the minimum of SCr/κ or 1
max = indicates the maximum of SCr/κ or 1
age = years
Based on the eGFR [11], CKD subjects were further categorized into groups [Table/Fig-1].
Categorization of chronic kidney disease subjects [11].
| Groups | Number of subjects | CKD stage | Severity | eGFR (ml/min/1.732m2) |
|---|
| A | 30 | Stage 1 + Stage 2 | Kidney damage with normal / mild decrease in GFR | ≥60 |
| B | 30 | Stage 3 | Moderate decrease in GFR | 30 – 59 |
| C | 30 | Stage 4 | Severe decrease in GFR | 15 – 29 |
| D | 30 | Stage 5 | Kidney Failure | < 15 |
Statistical Analysis
Statistical analysis was done using SPSS version 22.0. Normality of data was determined using Kolmogorov Smirnov test. As the levels of SCr, SCysC and eGFR did not follow normal distribution, data were summarised as median and interquartile range. Comparison study was done using Kruskal Wallis test and post-hoc analysis was done using Mann-Whitney U test with Bonferroni correction. Correlation studies were done using Karl Pearson’s test. Statistical significance was considered at p-value < 0.05.
Results
A total of 120 CKD were selected for the study, out of which 97 were males and 23 were females. The age of the study participants ranged from 35-70 years with the mean age being 56.96±10.47 years. The demographic parameters of the study subjects in each group are listed in [Table/Fig-2].
Demographic parameters in CKD groups.
| Parameter | Groups |
|---|
| A | B | C | D |
|---|
| Gender | | | | |
| No. of males (%) | 26 (86.7%) | 23 (76.7%) | 26 (86.7%) | 22 (73.3%) |
| No of females (%) | 4 (13.3%) | 7 (23.3%) | 4 (13.3%) | 8 (26.7%) |
| Mean age (in years) | 55.73±9.31 | 57.53±9.48 | 59.13±10.55 | 55.43±12.37 |
Among CKD subjects, 53 (44.2%) had hypertension, 28 (23.3%) had diabetes mellitus, 35 (29.2%) had hypertension as well as diabetes mellitus. Four CKD subjects (3.3%) had history of other diseases. Three of them had a past history of acute glomerulonephritis and one had adult polycystic kidney disease.
The participants were further divided into four groups based on eGFR. Each group comprised of 30 subjects. The median values of SCr in groups A, B, C and D were 1.01, 1.68, 2.92 and 7.25 mg/dl respectively. An increase in SCr was observed from Group A to Group D which was statistically significant (p<0.001). Median SCysC level in groups A, B, C and D were 1.34, 1.93, 2.69 and 4.69 mg/l respectively. Significant increase in SCysC level was observed from Group A to Group D (p< 0.001) [Table/Fig-3].
Biochemical parameters and estimated GFR in CKD Groups.
| Parameters | Groups (n)eGFR (ml/min/1.732 m2) |
|---|
| Medianinterquartile range[minimum-maximum] |
|---|
| A (30)(eGFR ≥ 60) | B (30)(eGFR 30-59) | C (30)(eGFR 15-29) | D (30)(eGFR < 15) | p-value |
|---|
| Serum Creatinine(mg/dl) | 1.010.88-1.13[0.70 -1.33] | 1.68 a**1.41 – 2.02[0.98 – 2.35] | 2.92 b**2.48 – 3.55[2.18 – 4.12] | 7.25 c**5.76 – 11.08[3.61 -15.35] | <0.001 |
| Serum Cystatin C(mg/l) | 1.341.18 – 1.63[0.79-2.83] | 1.93 a**1.75 – 2.38[1.14 – 4.28] | 2.69 b**2.31 – 3.14[2.00 – 4.24] | 4.69 c**3.59 – 5.49[2.01- 7.36] | <0.001 |
| eGFR (ml/min/1.732 m2) | 80.0071.25 – 87.50[60.00 – 100.00] | 43.00 a**35.75-49.25[30.00-58.00] | 21.50 b**18.00 – 25.25[16.00-27.00] | 7.50 c**5.00 – 9.25[3.00- 14.00] | <0.001 |
Abbreviations: eGFR, estimated glomerular filtration rate; n, number of CKD subjects.
a - Group B vs Group A, b - Group C vs Group B, c - Group D vs Group C.
** p-value < 0.001
It is interesting to note that while the median SCr level (1.01 mg/dl) among subjects having kidney damage with normal to mild decrease in eGFR (≥60 ml/min/1.732 m2) was within normal reference range (0.7–1.4 mg/dl), the median SCysC level (1.34 mg/l) was much above the upper reference limit as mentioned in the reagent kit insert, i.e., 1.09 mg/l.
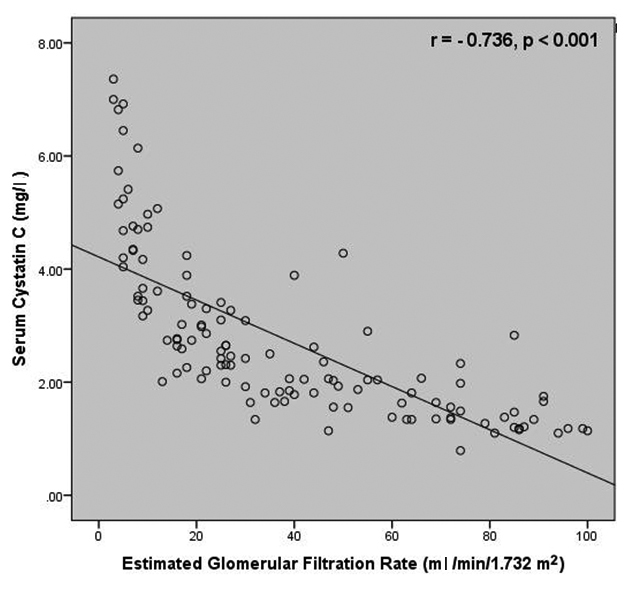
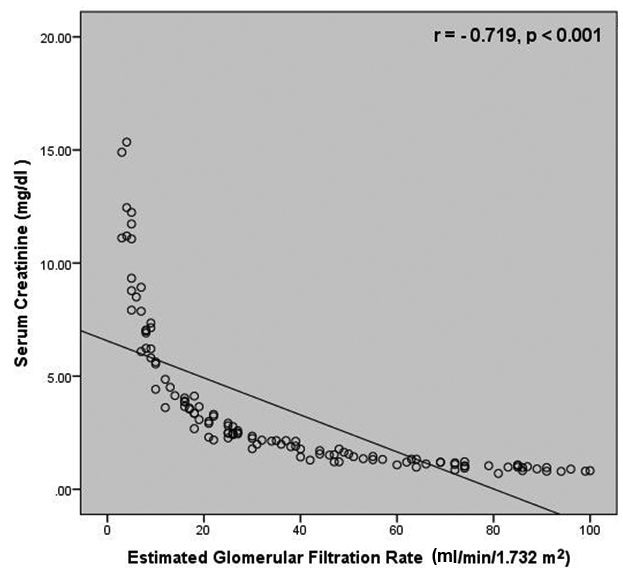
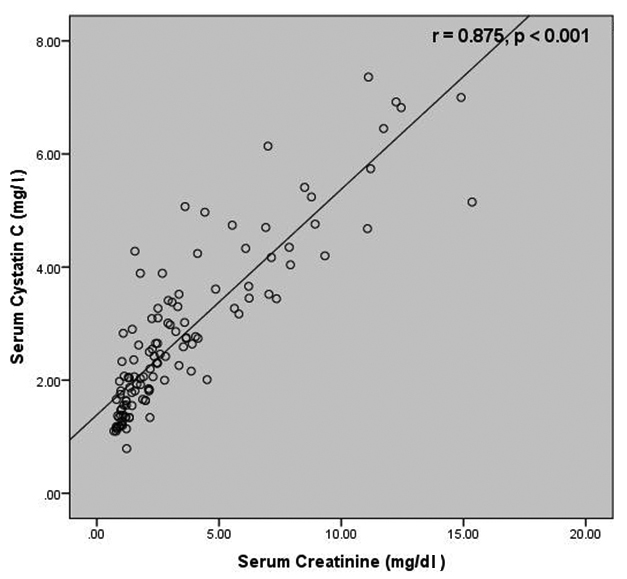
Correlation studies revealed a negative correlation between SCysC and eGFR (r=-0.736, p<0.001) as well as between SCr and eGFR (r=-0.719, p< 0.001) [Table/Fig-4,5]. A strong positive correlation was present between SCr and SCysC (r = 0.875, p< 0.001) [Table/Fig-6].
Correlation between serum cystatin C and estimated glomerular filtration rate among the study subjects.

Correlation between serum creatinine and estimated glomerular filtration rate among the study subjects.

Correlation between serum creatinine and serum cystatin C among the study subjects.

Discussion
Detection of CKD during early stages is essential. At present, SCr and GFR are the two parameters being used to diagnose, evaluate prognosis and monitor the response to treatment. Low cost, ease of estimation and specificity makes SCr a better parameter to rely on. However, SCr has certain drawbacks. In this study, an alternate marker, SCysC with relatively few disadvantages has been studied and compared with SCr.
An increasing trend in both SCysC and SCr levels were observed from Group A to Group D (p <0.001), indicating an inverse relationship of both the parameters with eGFR. A similar trend was observed in a study done by Kumaresan R and Giri P on CKD subjects [15].
Correlation studies revealed a comparatively better correlation between SCysC and eGFR than between SCr and eGFR. These findings are in accordance with the findings obtained by Hojs R et al., who reported a higher correlation between SCysC and measured GFR (r=-0.792, p<0.05) when compared to SCr and GFR (r=-0.666, p<0.05) [16]. More recently, in a study carried out by Dhupper V et al., a stronger correlation was reported between SCys and eGFR (r = -0.877, p<0.001) in comparison with SCr and eGFR (r = -0.777, p<0.001) [17].
A strong positive correlation existed between the SCr and SCysC levels which was statistically significant in this study, similar to the findings of the studies carried out by Dhupper V et al., and Tsai JP et al., who reported a positive correlation between SCr and SCysC (r=0.665 and r=0.870 respectively) [17,18].
SCr and SCysC prove to be reliable markers of renal impairment. In this study, both SCr and SCysC were significantly elevated across CKD groups. However, in CKD subjects with normal/ mild reduction in eGFR (eGFR ≥ 60 ml/min/1.732 m2), SCysC level was found to be more than the upper reference limit while SCr level was well within the normal reference range. A normal serum creatinine level, during the early stage of kidney disease, does not necessarily indicate normal renal function.
Limitation
The limitation of this study was the small sample size. The results, thus obtained, cannot be applied to the general population at large. Also, further studies need to be done to evaluate the effect of treatment (medications or dialysis) on the levels of SCr and SCysC in these patients during subsequent follow up.
Conclusion
Though, SCysC assays are quite expensive compared to conventional SCr assays, SCysC estimation can still be used as an adjunct to screen patients when SCr level is inconclusive especially in individuals with long duration, poorly controlled diabetes mellitus or hypertension.
Abbreviations: eGFR, estimated glomerular filtration rate; n, number of CKD subjects.
a - Group B vs Group A, b - Group C vs Group B, c - Group D vs Group C.
** p-value < 0.001