Imatinib, a tyrosine kinase inhibitor, is the cornerstone in the treatment of CML [1,2]. Earlier CML was treated with Busulphan which normalised only the peripheral counts, while hydroxyurea in addition showed mild regression of the marrow changes also. Interferon α (IFN α) had similar effects to hydroxyurea but it caused progression of myelofibrosis. None of the earlier drugs reduced the disease burden by reducing the Ph+ stem cells [3]. Imatinib selectively targets bcr/abl tyrosine kinase and also inhibits other tyrosine kinases namely Platelet Derived Growth Factor (PDGF) and stem cell factor (c-kit) which affects the non-neoplastic marrow elements also [2]. Hence the morphological changes produced by Imatinib are different from Hydroxyurea and Interferon alpha.
Although Imatinib is now being commonly used, scant literature is available on the bone marrow morphological changes in CML-CP patients treated with Imatinib, especially from India.
The present study aimed to document the morphological changes produced in the bone marrow during Imatinib therapy. This sequential analysis was done following the NCCN protocol so as to detect early resistance to Imatinib.
Materials and Methods
This was a hospital based longitudinal study, conducted over a period of 18 months. The study was cleared by the institutional ethics committee for human research. Written informed consent was obtained from all patients for inclusion in the study. Seventy five patients of CML-CP were enrolled, of which 52 patients were taken prospectively and 23 retrospectively (started imatinib within one month). All were Ph+ (Conventional cytogenetics & RT-PCR).
CML patients who had received IFN-alpha or Hydroxyurea prior to starting Imatinib therapy or were Ph-, in the accelerated or blastic phase, were excluded from the study.
Detailed history was taken and clinical examination was done in all patients. All patients received 400-600mg of Imatinib daily throughout the study period.
Complete blood counts were performed at presentation, 2 weeks, 1 month, 3 months, 6 months and at 12 months (Automated haematology analyser LH 500) and Wright’s stained peripheral smears were examined in all cases. Complete Haematological response was defined by WHO Criteria [4].
Bone marrow examination was done at presentation and repeated at 6 months and 12 months of therapy. Bone marrow aspiration and imprints were stained by Wright’s stain. Bone marrow biopsies were fixed in 10% buffered formalin; decalcified in EDTA for 48 hours, paraffin embedded using standard procedures and stained with Haematoxylin and Eosin (H&E) to assess the morphology. The bone marrow features were evaluated independently by two observers. Semi quantitative evaluation of different cell lineages was performed by a scoring system. Score 0: The parameters assessed show no increase/decrease in comparison with normal state, +1/-1: The parameters assessed show increase/ decrease as compared to normal state respectively.
Gomori’s reticulin stain and Masson Trichrome were performed on bone marrow biopsy sections to demonstrate myelofibrosis [5]. Grading of reticulin fibrosis was done using Standard Criteria [6].
Statistical Analysis
Descriptive statistics using frequencies (%) and proportions were done. Repeated ANOVA test was used for assessing the significance of Imatinib in reducing myelofibrosis.
Results
Seventy five patients enrolled in the study were followed over a period of 18 months. Haematologic parameters were available in 70 patients at ≥1 month and 3 months and in 56 patients at 6 months and ≥12 months. Second bone marrow biopsy at the end of 6 months was available in 48 patients. Third bone marrow biopsy at the end of 12 months and beyond was available in 30 patients only. One patient expired, 1 developed pancytopenia and 2 patients had deranged prothrombin time so biopsy was deferred. Two patients refused to undergo bone marrow biopsy. One patient restarted therapy after a gap of 1 year post diagnosis and hence was excluded. Remaining patients were lost to follow up.
The median age at presentation was 30 years with a range of 18-75 years. There were 44 males and 31 females, M:F ratio being 1.4:1. Clinical features at presentation included pallor (32%), weakness (36%), fever (25.3%), weight loss (25.3%), abdominal pain (82.7%) & bleeding (4%). Lymphadenopathy & hepatomegaly were seen in 13.3% & 52% patients respectively. All patients presented with varying degree of splenomegaly which was mild, moderate and severe in 33.3%, 61.3% and 5.4% respectively.
Haematologic Response
The median time to CHR was 28 days. However, in a single patient it was seen as early as 15 days [Table/Fig-1]. Out of the 14 cases who did not respond at 3 months, 6 cases continued to show no response even at the end of 12 months.
Extent of Complete Haematological response (CHR) during sequential follow up in CML patients on Imatinib.
| ≤1 month | 3 months | 6 months | 12 months |
|---|
| Total patients | 70 | 70 | 56 | 56 |
| CHR | 47.1% (33/70) | 80% (56/70) | 85.4% (48/56) | 90.4% (50/56) |
Bone Marrow Morphologic Changes
There was decrease in the bone marrow cellularity with normalization of the M:E (Myeloid:Erythroid) ratio and regeneration of erythroid colonies in majority of the cases. However, 3 cases continued to have hypercellularity at 12 months along with erythroid hypoplasia. Of the 14 cases which showed hypocellularity at 6 months, 6 cases continued to show hypocellularity even at 12 months. Megakaryocytes showed normalization of morphology and decrease in number and clustering in majority of cases by 6 months. At 12 months 3 cases continued to show increased megakaryopoesis, these were the same patients who did not respond to Imatinib therapy. Psuedo Gaucher cells and lymphoid aggregates were the other commonly observed changes [Table/Fig-2,3].
Dynamics of bone marrow features of CML at diagnosis, 6 months and 12 months of Imatinib therapy.
| Features/Scores (No. of cases) | 0 months (70) | 6 months (48) | 12 months (30) |
|---|
| -1 | 0 | +1 | -1 | 0 | +1 | -1 | 0 | +1 |
|---|
| Haematopoiesis |
| a) Cellularity | - | - | 70(100%) | 14(31.8%) | 27(56.2%) | 7(15.8%) | 6(20%) | 21(70%) | 3(10%) |
| b) Myelopoiesis | - | - | 70(100%) | 7(15.8%) | 33(68.7%) | 8(18.3%) | 1(3%) | 25(83%) | 4(13.3%) |
| c) Erythropoiesis | 70(100%) | - | - | 13(29.5%) | 32(66.6%) | 3(6.8%) | 3(10%) | 22(73%) | 5(16.6%) |
| Megakaryopoiesis |
| a) Megakaryocytes | - | 17(24.3%) | 58(82.8%) | 9(20.6%) | 32(66.6%) | 7(15.8%) | - | 27(90%) | 3(10%) |
| b) Maturation defect | - | 25(35.7%) | 50(71.4%) | - | 43(89.5%) | 5(11.4%) | - | 28(93.3%) | 2(6%) |
| c) Clusters | - | 25(35.7%) | 50(71.4%) | - | 46(95.8%) | 2(6%) | - | 28(93.3%) | 2(6%) |
| Stroma |
| b) Pseudo-gaucher cells | - | - | 5(7%) | - | - | 22(45%) | - | - | 6(20%) |
| c) Lymphoid nodules | - | - | - | - | - | 10(20%) | - | - | - |
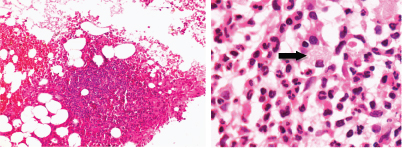
(a) Post therapy trephine biopsy bone marrow section showing a lymphoid nodule. (H&E, 20X); (b) Post therapy bone marrow trephine biopsy showing Pseudo Gaucher cells (arrow) (H&E, 100X). (Images from left to right)
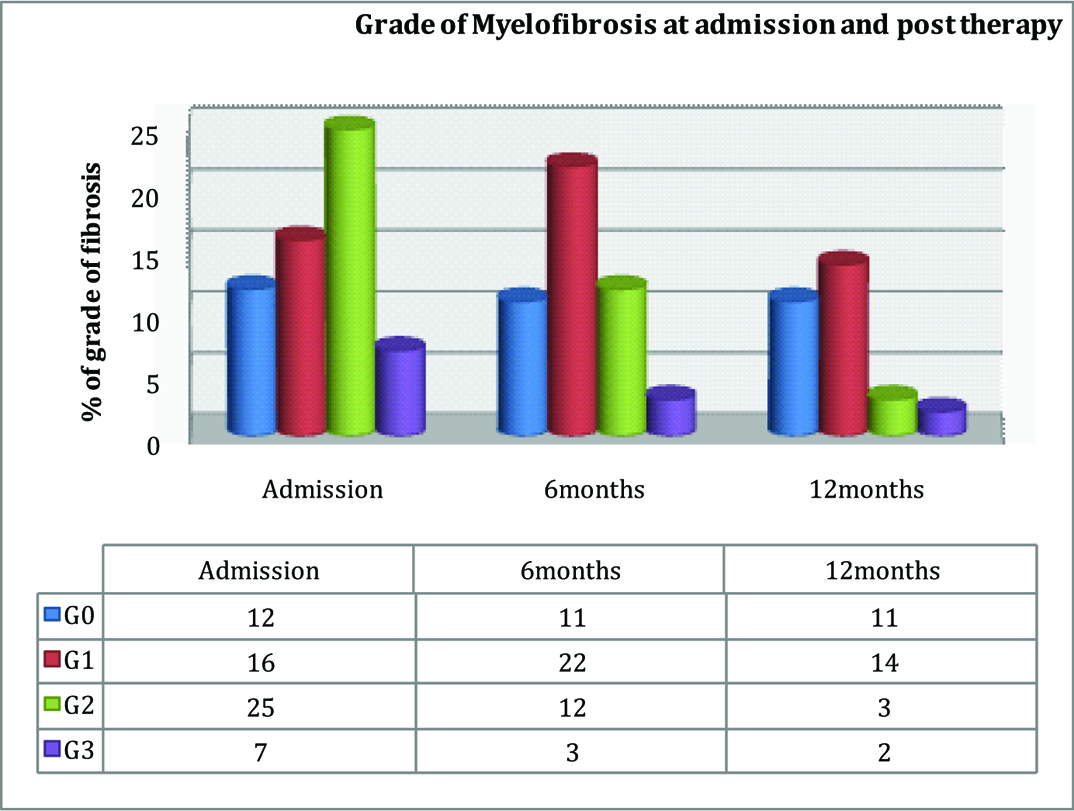
Only 60 cases with adequate reticulin staining were available at initial presentation. Of these, reticulin fibrosis was seen in 48 biopsies and the remaining 12 cases showed normal reticulin pattern. A significant decrease in all grades of myelofibrosis was seen at 6 months which continued at the end of 12 months [Table/Fig-4,5 and 6]. Only a single case showed grade 1 myelofibrosis at presentation which progressed to grade 3 at 12 months. This was one of the 3 patients with hypercellularity who did not respond to Imatinib therapy at ≥12 months.
Grade of myelofibrosis at admission and post Imatinib therapy.
Decrease in myelofibrosis was significant; p-value<0.04- Repeated ANOVA test
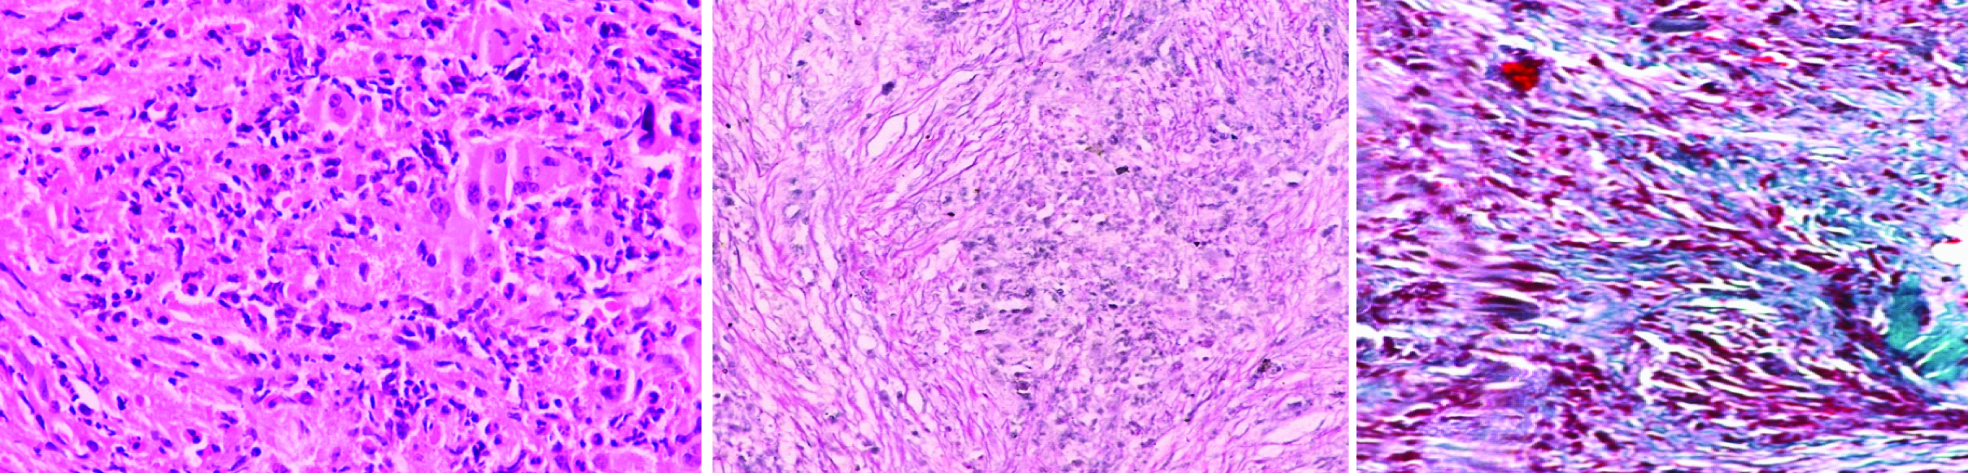
Pre-therapy grade 4 fibrosis: a) H&E 40X; b) Gomori’s Reticulin stain 20X; c) Masson trichome 20X. (Images from left to right)
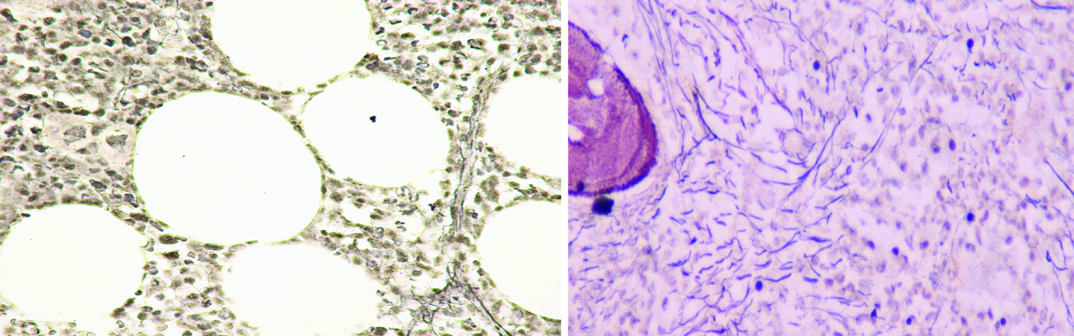
Post therapy grade 1 and grade 2 fibrosis: a) GRADE 1 (Gomori’s Reticulin stain 20X); b) GRADE 2 (Gomori’s Reticulin stain 20X). (Images from left to right)
Discussion
Imatinib mesylate is used as the front line therapy for the treatment of CML-CP patients. It induces haematological, cytogenetic and molecular remission in a substantial number of patients [7-9]. The present study evaluated the sequential haematological parameters and bone marrow morphology in 75 newly diagnosed CML patients in chronic phase, who received Imatinib mesylate as the first line treatment according to the NCCN guidelines [10].
Several studies from the West have evaluated the effect of Imatinib on haematological parameters. However, bone marrow features have been studied only in a few cases. There is only a single study that has documented the sequential haematologic and bone marrow findings in 19 IFN-α refractory CML-CP patient on Imatinib mesylate for at least 14 months. These patients were on prior therapy and were thus not a representative group as morphological changes due to IFN-α pre-existed [11].
There is limited data from India on the effect of Imatinib treatment on haematological parameters [12-14]. Medhi et al., evaluated sequential peripheral blood parameters at 3 months, 6 months, 1 year, 2 years, 3 years, 4 years [15], however it was not done according to the NCCN guidelines and assessment of bone marrow features on aspirates was done at random points of time. Joshi et al., documented the morphological features only in bone marrow aspirates of post Imatinib CML patients which precludes any comment on the status of myelofibrosis [16]. Bone marrow trephine biopsies are more representative of cellularity, haematopoiesis and stromal changes rather than aspirates. None of the Indian studies have documented any of the above parameters using bone marrow trephine biopsies. The present study documents post Imatinib therapy changes in haematological and bone marrow morphological parameters including myelofibrosis using both bone marrow aspirates and trephine biopsies in CML-CP patients.
In the present study, the CHR was seen in 80-85.4 % of patients at 3-6 months. This is lower than that reported earlier in the Indian literature (94.5 to 97%) at 3-6 months [15-17]. However, none of the Indian studies have monitored CHR within 2 weeks and thus we were able to detect CHR as early as 28 days in many patients and at 15 days in a single case. The earliest documentation of CHR in Indian studies has been reported at 3 months. The slightly lower CHR in our study could be due to strict application of WHO criteria for CHR. Majority of the patients who achieved CHR at 3 months continued in CHR at 6 months. It was noted that 42% of the patients who did not respond to Imatinib even at ≥12 months were those who had not responded to Imatinib at 3 months. Our observation suggests that non-responders at 3 months were less likely to show CHR at 6 months and beyond. Thus by following up the patients at regular intervals, resistance to Imatinib was identified at an early stage and such patients could be considered for increasing the dose of imatinib or changing of the treatment regimen.
Presence of myelofibrosis at presentation is a poor prognostic marker. The western literature reports severe myelofibrosis (grade 2-3) in 40-75% [18-20] patients at presentation. In our study group, 48 (64%) of the patients had myelofibrosis at presentation. Out of these 32 (53.3%) had significant grade 2-3 fibrosis and 16 (25%) had grade 1 fibrosis. Bueso-Ramos et al., documented a higher percentage of patients (60%) presenting with significant fibrosis pre-therapy which could be attributed to the inclusion of patients refractory to other drug regimens like IFN-α and not to disease process alone [21]. In our study, since treatment naive patients were included, a slightly lower incidence of myelofibrosis was documented. No Indian data is available on the presence of myelofibrosis at presentation as most studies have only analysed bone marrow aspirates.
Imatinib significantly decreased the grade of myelofibrosis (p<0.04) and also prevented the development of myelofibrosis in patients not having it at presentation suggesting that Imatinib is most effective when used early in the course of CML-CP. However, in one case, the patient presented with grade 1 myelofibrosis and progressed to grade 3 myelofibrosis. This case had not shown haematologic response to Imatinib. The proposed mechanism of downregulation of myelofibrosis is probably by causing an overall decrease in megakaryocytes and normalization of haematopoeisis.
It has been documented in western literature that patients on Imatinib therapy may develop severe bone marrow hypoplasia in 15-20% cases [22,23]. In a single study from Indian literature, Joshi et al., described bone marrow hypoplasia in 54.4% patients, which was much higher than our findings [16]. We noted hypoplasia of mild to moderate degree in 14 biopsies (31.8%) at 6 months and 6 of the patients remained hypoplastic at 12 months. Severe degree of hypoplasia was not seen in any of the biopsies. This may be because the findings of Joshi et al., were based on bone marrow aspirates which did not represent overall bone marrow cellularity [16]. Post therapy hypocellularity may reflect a deficiency of normal stem cells or damage to the marrow microenvironment by extensive previous chemotherapy (IFN- α).
Pseudo Gaucher cells in CML patients are considered to be a part of disease process. However there is a difference in opinion about their relevance in post therapy CML patients. Frater et al., observed that they are seen more frequently in patients who continue to show Ph+ haematopoiesis where the rapid cell turnover continues and these cells ingest cellular debris and therefore their numbers are expected to be more in patients who do not respond to Imatinib [24]. However, Braziel et al., and Thiele et al., opine that Imatinib induces apoptosis of CML cells and the apoptotic cells are ingested by these phagocytic cells [11,22]. Thus Pseudo Gaucher cells in post therapy marrow are indicators of cytogenetic response. Thiele et al., observed increase in Pseudo Gaucher cells over time whereas Braziel et al., noted a decrease in their numbers. In our study group Pseudo Gaucher cells were observed in 7% patients at diagnosis. At the end of 6 months 45% patients had Pseudo Gaucher cells. They were identified in a substantial number of post therapy patients who initially lacked them at the time of diagnosis. However, at the end of 12 months Pseudo-Gaucher cells were seen in 20% of the biopsies. Hence our findings are in accordance with those of Thiele et al., showing increase in Pseudo Gaucher cells at 6 months post therapy [22]. However, the decline noticed at 12 months indicates that the maximum effect of Imatinib is at 6 months of therapy. Sea blue histiocytes were not prominent in our study group [Table/Fig-2].
Benign lymphoid nodules in the post therapy biopsies were identified in 10 (20%) post 6 months therapy cases and none at post 12 months therapy cases. This feature was not identified in any of the pre therapy biopsies. However, their significance has not been established [Table/Fig-2].
Limitation
Many patients were lost to follow up because it was difficult to obtain sequential bone marrow aspirates and biopsies.
Conclusion
Sequential assessment of bone marrow biopsy in CML-CP patients on Imatinib showed that bone marrow normalizes by the end of 6 months and 12 months in majority of the cases. CML-CP patients who do not show haematologic response at 3 months are less likely to respond to Imatinib at 6 and 12 months and should be offered another therapeutic option. Indian CML-CP patients had significant myelofibrosis (Grade 2-3) in 53.3% cases at presentation. Imatinib is seen to have potential beneficial effects on myelofibrosis by reducing its grade in patients who initially presented with myelofibrosis in chronic phase. It also prevents its development in those patients who did not present with myelofibrosis.