Carbohydrates have been extracted conventionally from animal tissues by homogenization with cold PCA. ASG named as lyoglycogen or macroglycogen is extracted at first step [1,2]. The extraction with cold acid must be done at least two times to extract ASG quantitatively and to prevent contamination of the latter with the former fraction [3]. The residual portion, desmo- or pro-glycogen is AIG and could be extracted only by using hot alkaline [4,5]. Some authors supposed that the portion of glycogen is trapped physically in the cells so that inadequate homogenization causes incomplete extraction [6]. Latter, it was shown that the insolubility of some glycogen particles in cold acid is a result of binding to proteins, glycogen phosphorylase or/and glycogenin [7,8]. We also introduced a new protocol that yields the same results exactly if total glycogen is divided directly into two fractions by adjusting the pH [9].
Lomoko J et al., indicated that ASG is composed mainly of high MW particles with low protein content, whereas, AIG is composed of particles with a high protein portion [10]. The high protein-to-carbohydrate ratio of AIG is responsible for its poor solubility in acid. They also deduced that glycogen degraded through the removal of the clusters of quanta of 30-40 glucose residues [10]. This model has not been supported by some subsequent researches and the existence of a distinct proglycogen species has been refuted [11-15]. These studies showed a continuum of glycogen particles sizes during synthesis and degradation. James AP et al., used gel filtration chromatography to estimate MW of glycogen fractions in human muscles, but they failed to show significant differences in the MW of ASG and AIG [16]. Sullivan MA et al., disregard the early experiments on extraction of glycogen from animal tissues and proposed an extraction by using Tris buffer with pH 8.3 [17]. Their findings showed that glycogen is only constructed by the structures of α and β particles using HPLC and electron microscopy [18]. We used their buffer and procedure to extract glycogen from rat liver and muscle [19]. The findings showed that they used only ASG and discarded the pellet that contained the AIG fraction. Therefore, the existence of glycogen as two fractions of soluble and insoluble with distinct MWs is still obscure.
In the preliminary study, we showed that all liver glycogen could not be extractable by cold PCA [3] or Gilbert’s extraction buffer [18]. The increase of the extent of homogenization followed by sonication also failed to extract all glycogen [9,18]. In the current study, glycogen fractions were extracted from rat muscle using classical homogenization method [3].
The present study was conducted to determine the physicochemical characteristics of muscle glycogen fractions including the contents of carbohydrate, protein, phosphate and relative MW.
Materials and Methods
Study Design
The project was an animal experimental study that was performed in March of 2015 and continued for six months. Albino Wistar male rats (200-220 g) were starved for 12 hours overnight. One group of five rats was kept at rest as control and another five rats underwent 30 minutes physical activity as case group. All experimental procedures were performed in accordance with the Guide for the Care and Use of Laboratory Animals (GCULA) approved by National Research Council.
Running Wheel Physical Stress Test
Running test was used to make change in the level of muscle glycogen [14]. Five rats were at resting state and another five rats were put in standard animal running wheel for 30 minute. The wheel had 1 metre circumference and was rotated at the rate of 30 rpm.
Muscle Sampling
The iliopsoas thigh muscle was isolated from rats anesthetized by diethyl ether and washed rapidly three times with ice cold isotonic saline [13-15]. The tissue incised into several parts on a filter paper and preserved between para-film at −70°C immediately [3].
Tissue Digestion and Ethanol Extraction
The muscle tissue was digested by cold PCA using the ‘classical homogenization method’ optimized for liver tissue previously [3]. The procedure was adapted for the muscle tissue because the content of glycogen is about 1/50 of liver tissue. In brief, 100 mg of muscle tissue was homogenized for 25 sec with 1 ml cold 10% PCA, centrifuged 10 minutes at 280×g. The pellet was re-extracted for further one time with 1 ml fresh PCA. The supernatants were collected and extracted with ethanol at a final concentration of 55% and centrifuged 10 minutes at 1500×g. The pellet was dissolved in 2 mL distilled water and 200 μl was analysed for ASG. The last pellet of tissue was digested with 200 μl of 30% KOH in boiling water bath for 10 minutes. After cooling, it was extracted with ethanol and centrifuged 10 minute at 1500×g. The pellet was dissolved in 2 mL distilled water and 200 μl was analysed for AIG. Total glycogen was extracted from the tissue by using hot alkaline method [3,9]. Glycogen was measured by chemical method of phenol-sulfuric acid optimized previously [20]. Protein was measured by sensitive method of Lowry using Folin-Ciocalteu reagent. The content of phosphate was determined by using the sensitive method of Fiske- Subbarow [21].
Estimation of Relative Molecular Weight by Osmometry
Molecular weight of the solutes can be measured by different methods of molecular sieve chromatography, electrophoresis, sedimentation, electron microscopy and osmometry [22]. Osmotic pressure is proportional to concentration of the solutes as:

Traditionally, osmotic pressure is determined at two levels of a solute. Then, MW is exactly determined by extrapolation the curve to the zero concentration of the solute. In another way, MW can be calculated by measuring the osmolality using the equation [22]:
The MW of glycogen is not fixed, so we introduced the index of MW (mg/mmol) as the ratio of concentration (mg/l) to osmolality (mmol/l).
To determine the osmolality of each fraction, the surface of the ethanol-extracted pellet was washed gently with distilled water and was solubilized in 2 ml water, and 50 μl of the solution was used to determine osmolality. Osmolality was measured by freezing-point depression (Osmomat 030, Genotec Gesellschaft für Mess- und Regeltechnik GmbH D-100 Berlin 62, Germany). The osmometer was calibrated with preformed Gonotec vial (300 mmol/kg H2O) and doubly distilled water (0 mmol/kg H2O) for every series of determinations.
Statistical Analysis
The results are presented as the means ± SE of three inter-assays performed at least in five samples. The significant differences between samples and corresponding control were accessed by student’s t-test. All p-values are two-tailed and differences were considered significant if p-values were ≤0.05.
Results
The Levels of Muscle Glycogen Fractions at Rest and Activity
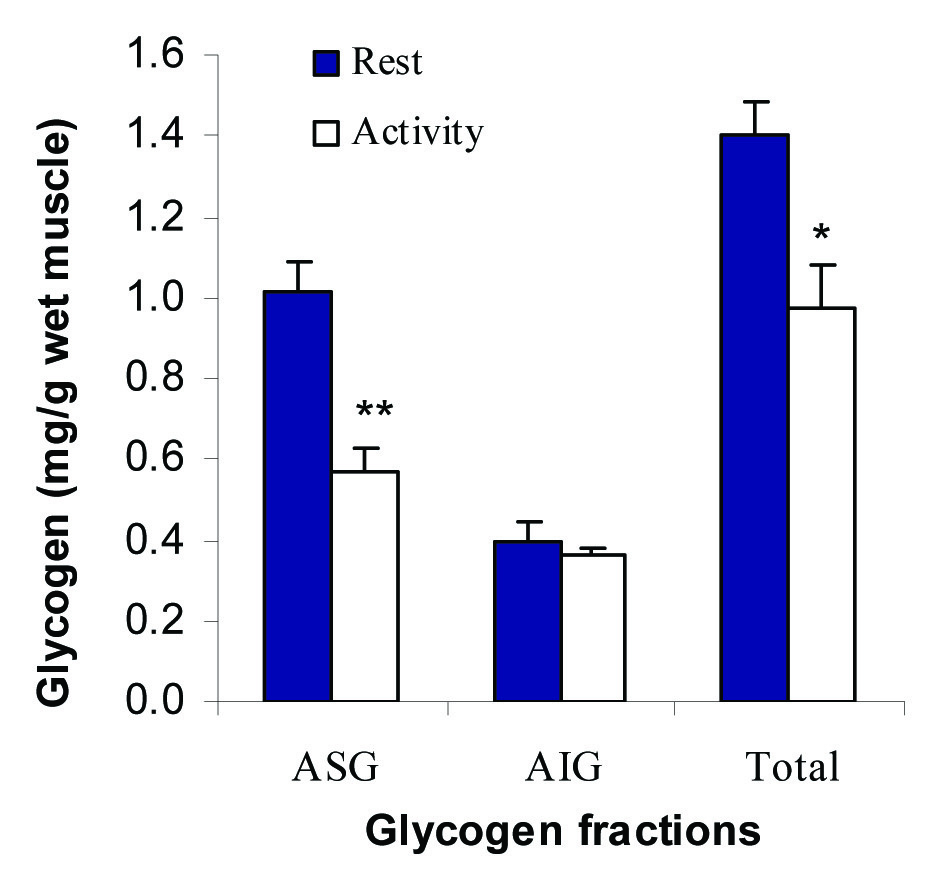
[Table/Fig-1] shows the levels of ASG, AIG and total glycogen in iliopsoas thigh muscle at rest and following 30 minutes running. Total glycogen was decreased about 30% during activity (1.40±0.08 mg/g wet muscle vs. 0.97±0.11, p<0.05), and the change occurred totally in ASG (1.02±0.07 vs. 0.57±0.07, p=0.017), whereas, AIG changed insignificantly (0.39±0.05 vs. 0.36±0.02, p=0.5).
The effects of 30 minute running on muscle glycogen fractions.
The rat iliopsoas thigh muscle tissue was analysed for glycogen fractions at rest and following 30 minutes activity. All measurements were done on five samples (n=5) in triplicate. * and ** indicate statistical significance at confidence levels of p=0.05 and p<0.02 respectively.
Protein Content of Glycogen Fractions at Rest and Activity
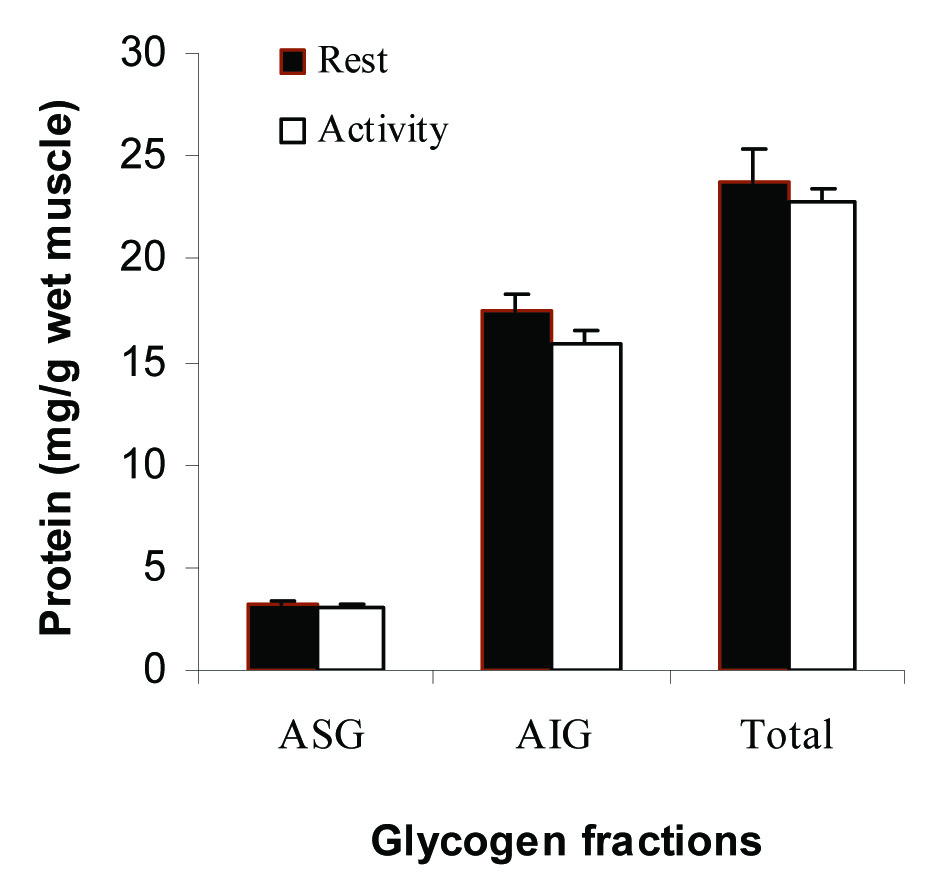
[Table/Fig-2] shows the protein content of muscle glycogen fractions and their changes following 30 minutes activity. The content of protein was 3.15±0.22, 17.42±0.89 and 23.80±1.61 mg/g wet of muscle in ASG, AIG and total glycogen fractions at rest state respectively. There were no significant changes in any fractions along 30 minutes activity.
The protein content of glycogen fractions at rest and following 30 minutes muscular activity. All measurements were done on five samples (n=5) in triplicate.
The Ratios of Carbohydrate: Protein for Glycogen Fractions
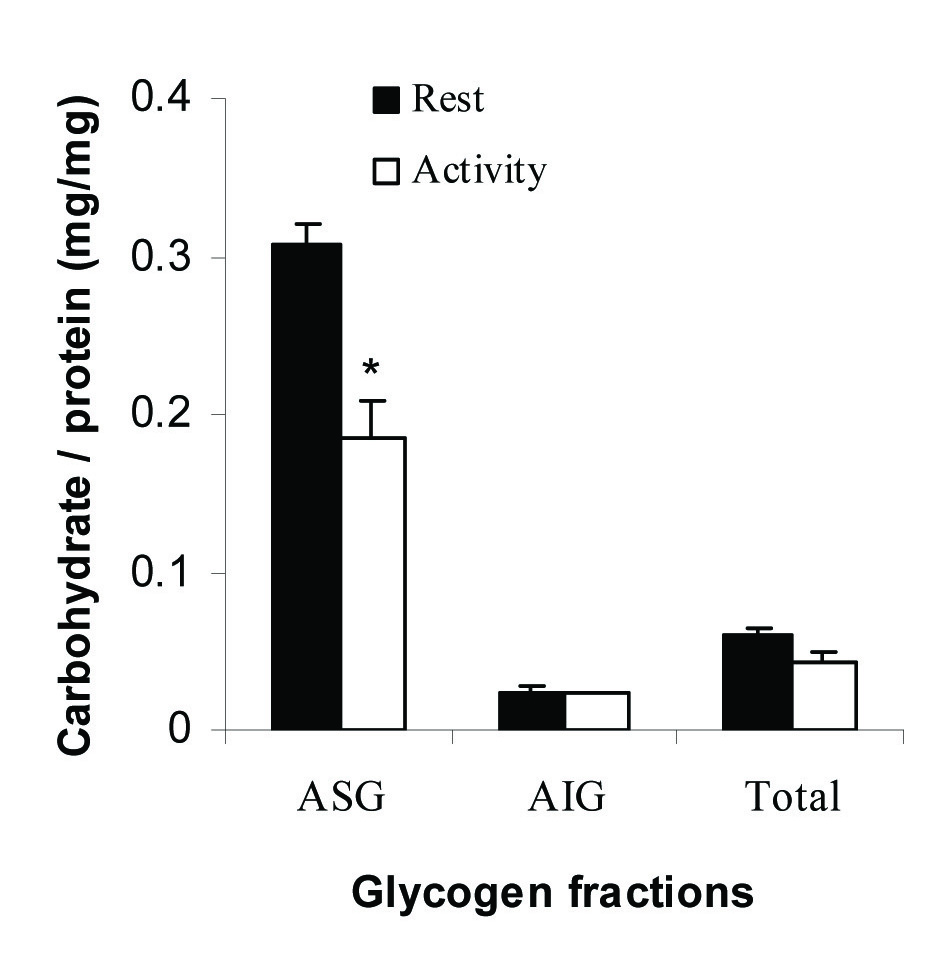
The ratios of carbohydrate to protein were calculated for glycogen fractions and shown in [Table/Fig-3]. The ratio was 0.33±0.01 (mg/mg) for ASG fraction at rest state and was decreased significantly to 0.19±0.02, p=0.01 after 30 minutes running. This ratio in AIG was about 6% of ASG fraction and did not change significantly during activity (0.02±0.004 vs. 0.02±0.001, p=0.8).
The ratio of carbohydrate to protein for muscle glycogen fractions at rest and activity. All measurements were done on five samples (n=5) in triplicate. *indicates significance at a confidence level of p=0.01.
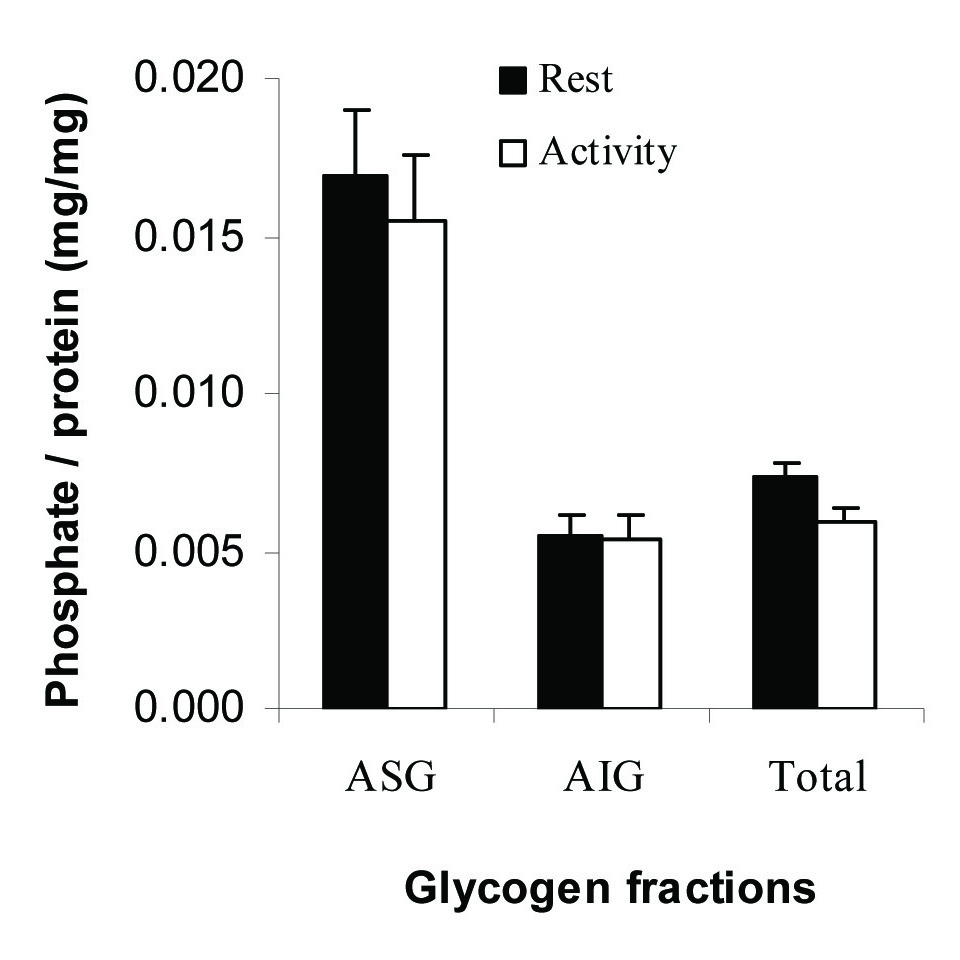
The Phosphate: Protein Ratio of Glycogen Fractions
The content of phosphate was measured in glycogen fractions and the ratio of phosphate to protein was calculated and shown in [Table/Fig-4]. The ratio was (16.9±2.8)×10−3 (mg/mg) for ASG and (5.4±1.2)×10−3 for AIG fraction at rest. The ratios did not change significantly in any fractions following activity.
The ratio of phosphate to protein in muscle glycogen fractions. All measurements were done on five samples (n=5) in triplicate.
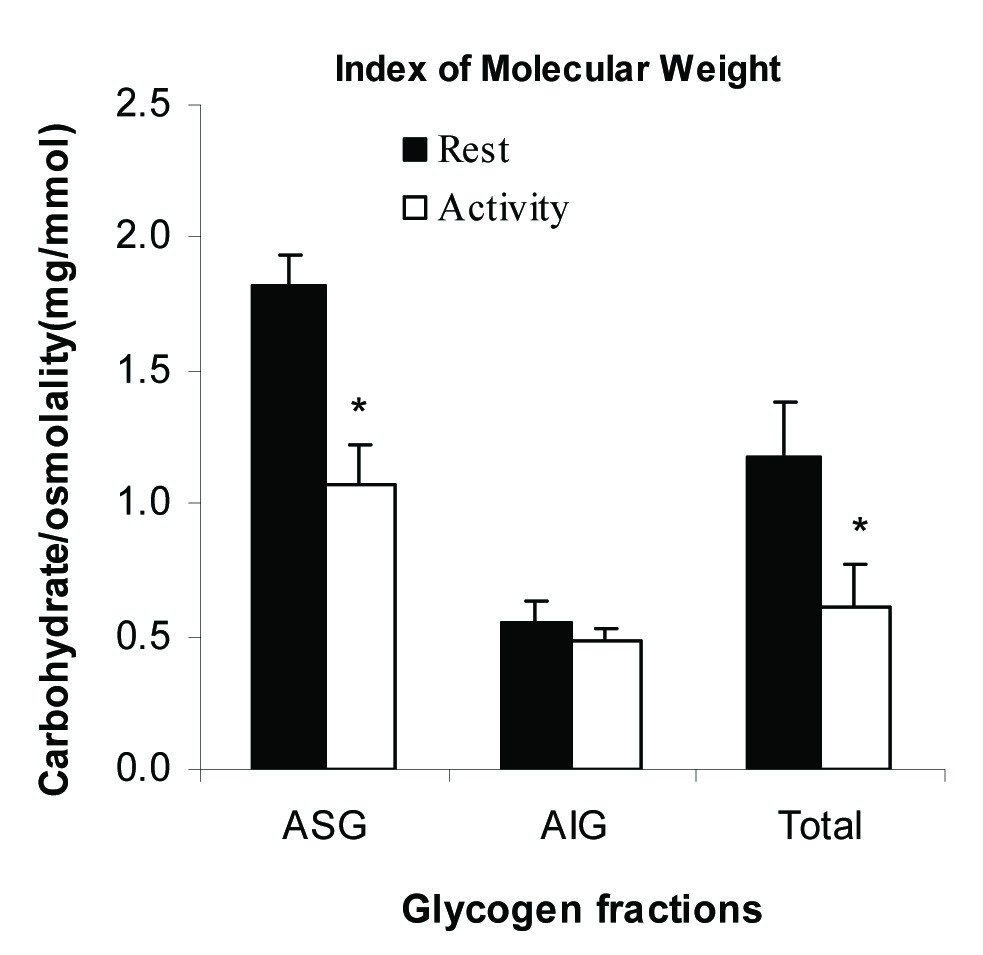
The Index of Molecular Weight of Glycogen Fractions
The index of MW was calculated for each fraction of glycogen as the ratio of concentration (mg/ml) per osmolality (mmol/l) and shown in [Table/Fig-5]. The index was 1.82±0.02 for ASG at rest state and was decreased significantly to 1.07±0.12, p<0.05 following 30 minutes activity. The index did not change significantly for AIG fraction (0.56±0.05 vs. 0.48±0.10, p=0.4).
The index of molecular weight of glycogen fractions at rest and activity. The index of molecular weight was defined as the ratio of concentration per osmolality as mg/mmol. All measurements were done on five samples (n=5) in triplicate. * indicates significance at a confidence level of p≤0.05.
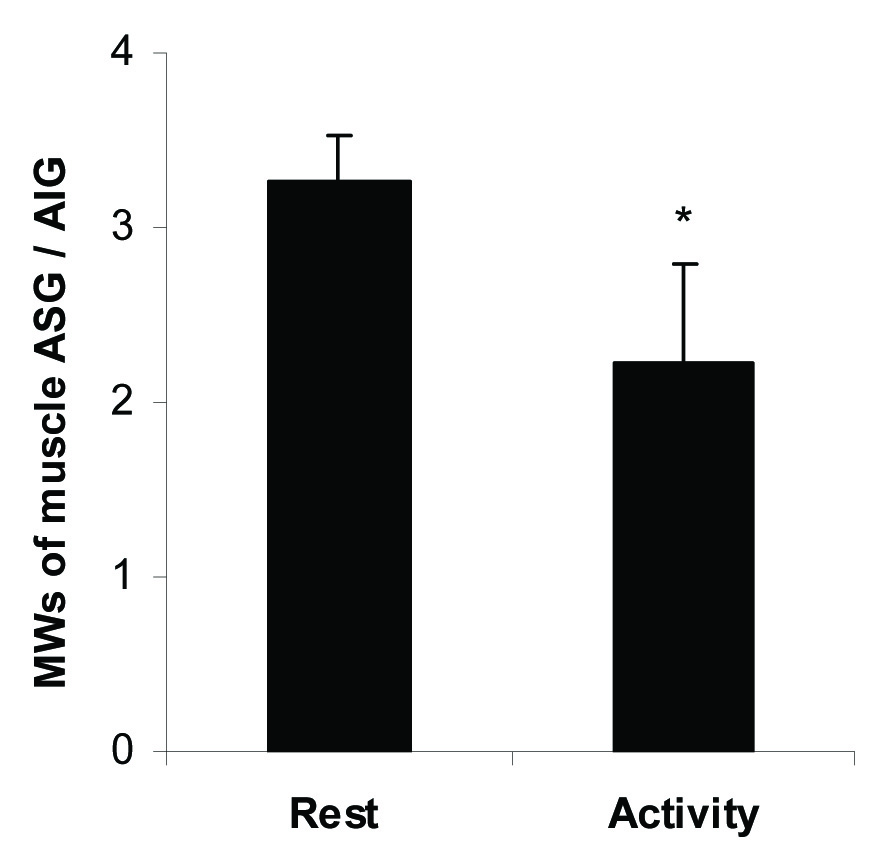
Relative Molecular Weight of Glycogen Fractions
The relative molecular weight of ASG to AIG fractions was calculated and presented in [Table/Fig-6]. The relative MW was 3.3±0.3 at rest and decreased significantly to 2.2±0.6, p<0.05 following 30 minutes activity.
Molecular weight of ASG relative to AIG fraction at rest and activity. All measurements were done on five samples (n=5) in triplicate. * indicates p≤0.05.
Discussion
In the current study, some physicochemical characters were determined for muscle glycogen fractions. The results indicate that, ASG is the main fraction of total glycogen and is more metabolic active form. In addition, the fractions of ASG and AIG differ in the content of carbohydrate, protein, phosphate and MW. The content of total glycogen observed in the present study was about 1 mg/g wet muscle [Table/Fig-1]. This value is about 1/50 of total glycogen in the liver of fed rat [3]. Furthermore, ASG was about 73% of total glycogen in resting muscle and was more responsive to physical activity. This ratio is less than that reported for the liver, as ASG compromises about 95% of total glycogen in the liver of fed rat [3]. There are two main procedures to extract glycogen from animal tissues; ‘classical homogenization’ [3] and ‘homogenization free’ methods [23-25]. The latter method is done on a very low weight of tissue and ASG is extracted only once without homogenization. So, the results have high coefficient of variance and AIG is contaminated with ASG. These factors cause a marked difference between the results of two methods. It is indicated that the findings of the homogenization method is more reliable [3]. Our findings are in accordance with the earlier [1-5] and more recently studies [15,16] which used the homogenization method. The results are clearly opposite to the homogenization-free protocols, in which, AIG is the higher fraction and more responsive to the different metabolic conditions [23-26].
The results also showed that, the protein content of AIG was about 5.5 times of ASG fraction, so that the ratio of carbohydrate to protein content in ASG was about 16.5 times of AIG fraction [Table/Fig-3]. This proportion was reduced to 9.5 following 30 minutes muscular activity. The low ratio of carbohydrate:protein causes poor solubility of AIG in acid. Alonso MD et al., reported that rabbit muscular AIG was composed mainly of low MW particles of 400 kD and ASG are large glycogen particles of 10000 kD [7,8]. The relative mean of MWs of muscular ASG to AIG was about 3.3 in our experiment [Table/Fig-6], whereas, it was 25 in Whelan’s report obtained by electrophoresis. The activity of molecules will decrease as the MW increases. Thus, the method of osmometry underestimates the MW for macromolecules such as glycogen [21]. On the other hand, glycogen is not an informative molecule, so that its MW will change over different nutritional and hormonal status. Therefore, the relative MW of the glycogen fractions is more important. The present study showed for the first time by using osmometry that there is a significant difference between the MWs of the glycogen fractions ASG and AIG. In addition, the relative MWs of the glycogen fractions changed significantly during muscular activity. It is reported that the two fractions of glycogen have different sedimentation coefficients by using ultracentrifugation [26]. James AP et al., failed to separate ASG and AIG on the basis of MW in human muscles using gel filtration chromatography [16].
Two models have been presented in the literature to describe the changes in the size of glycogen molecules during synthesis and degradation. Alonso MD et al., studied synthesis and degradation of 14C-labled glycogen, followed by SDS-PAGE and autoradiography. They observed that the intermediates constitute a series of bands rather than continuum, differ about 30-40 glucose residues. As glycogen consists of clusters of branched chains, they deduced it may be degraded via the breaking down of interlinks between the clusters followed by phosphorolysis of the fragments. This model has not been supported by some researches [12-15]. Skurat AV et al., studied glycogen biogenesis in rat fibroblasts expressing glycogenine [13]. Their results showed a continuum of glycogen particles sizes by using two-dimensional gel electrophoresis. Marchand I et al., assessed the size and number of glycogen granules with transmission electron microscopy in human muscles during recovery of exercise [14]. They observed that distribution of particle diameter was continual throughout the recovery period [14]. However, it does not matter if the changes are continuous or discontinuous, as the carbohydrate content of glycogen is decreased to a threshold limit it causes a reduction of the solubility of particles in acid. This process converts some of ASG particles to AIG fraction. This model is confirmed consistently in postmortem liver tissue [3], during fasting [9] and muscular activity [27]. In these situations as ASG is degraded the content of AIG will be increased slightly [3,9,23].
Limitation
As it was discussed, the increase in MW of the molecule causes the activity to decrease. So the method of osmometry underestimates the MW for glycogen. For this reason, the index and relative MWs was introduced and calculated.
Conclusion
It could be concluded that muscle glycogen fractions, ASG and AIG differ in some physicochemical characteristics. ASG has a higher mean of MW and is more metabolic active form.