AUDIT (Alcohol Use Disorders Identification Test) to Estimate the Pattern and Correlates of Alcohol Consumption among the Adult Population of West Bengal, India: A Community Based Cross-sectional Study
Arkaprabha Sau1
1 Junior Resident, Department of Community Medicine, R.G. Kar Medical College and Hospital, Kolkata, West Bengal, India.
NAME, ADDRESS, E-MAIL ID OF THE CORRESPONDING AUTHOR: Dr. Arkaprabha Sau, Kanakpur, Panskura R.S, Panskura-721152, West Bengal, India.
E-mail: arka.doctor@gmail.com
Introduction
Pattern of alcohol consumption substantially changed in India with in last 20 to 25 years. Excessive alcohol consumption is a major risk factor for various morbidity and mortality. So, scientific study to identify alcohol consumption patterns and its correlates will be helpful to formulate preventive strategies.
Aim
To estimate the pattern of alcohol consumption and to determine its correlates, among the adult population of the state of West Bengal in India.
Materials and Methods
A community based cross-sectional study was conducted among the adult population of the state of West Bengal at Gram Panchayat (GP) level. Ninety-nine (n=99) adult (≥ 18 years) men and women of Guchati GP at Paschim Medinipur district, was selected using Lot Quality Assurance Sampling (LQAS) technique. The study participants were interviewed using a pre-designed and pre-tested schedule.
Results
It was estimated that the prevalence of low risk drinking or abstinence (Zone I) was 65.5% (95% CI 55.5% to 75.5%) and the prevalence of alcohol use in excess of low-risk (Zone II) was 17.6% (95% CI 7.6% to 27.6%), and the prevalence of harmful and hazardous drinking (Zone III) was 8.5% (95% CI 0% to 18.5%) and the prevalence alcohol dependence (Zone-IV) was 8.4% (0% to 18.4%). Logistic regression model shows that “gender” (p = 0.00) and “employment status” (p = 0.01) added significantly to the model with adjusted odds ratio of 82.27 (95% CI 18.17-372.58) and 0.13 (0.03–0.66).
Conclusion
There is a need for comprehensive screening and treatment programme to deal with the problems of Alcohol Use Disorders among adults to achieve good health and well being for sustainable development.
Alcohol dependence, Geographic information system, Lot quality assurance sampling
Introduction
Habit of alcohol consumption is increasing day by day not only in India, but world-wide also [1,2]. Often it has been seen that young boys and girls start to test alcohol just for fun but gradually they are engulfed by the addictive power of alcohol [3]. Consumption of alcohol has existed in India for centuries but the quantity, pattern and resultant consequences have changed substantially in last 20 to 25 years [1,4]. Studies conducted in last 10 years reveal that the epidemiological pattern of alcohol consumption in India is characterised by predominantly male drinker, preference to spirits containing high alcohol concentration, and frequent and heavy drinking [5,6].
Misuse of alcohol is a major risk factor for various morbidity and mortality [7-10]. Anaemia among women, nutritional deficiencies among adolescents and adults are associated with the harmful use of alcohol [11,12]. Alcohol consumption is a behavioural factor for the high prevalence of HIV in India [13]. Not only physical, but alcohol has great impact on the psychological and behavioural aspect also. Some of the health consequences of alcohol consumption are direct, like alcohol over dose, foetal alcohol syndrome and some are indirect, mediated through increase chance of accidents, increases vulnerability to chronic communicable and non-communicable diseases [6,9].
Furthermore alcoholism is also related to social pathology of crime, violence in the society [14]. One of the most important targets under goal 3 of the “Sustainable Developments Goals - 17 Goals to Transform Our World” is the “Strengthen the prevention and treatment of substance abuse, including narcotic drug abuse and harmful use of alcohol” which indicates that the United Nations also accept and give proper importance to this problems [15].
So, estimation of the prevalence of Alcohol Use Disorders (AUDs) in the society and its correlates will be a very effective endeavour to make appropriate interventional strategies in time. A detailed guidelines for the diagnosis of alcohol related disorders, like acute alcohol intoxication, harmful use, alcohol dependence syndrome, withdrawal state, and related medical and neuropsychiatric conditions, collectively called AUDs, have been provided in the tenth revision of the International Classification of Diseases (ICD-10) [16].
Alcohol Use Disorders Identification Test (AUDIT) is a screening tool developed by World Health Organization (WHO) to detect hazardous and harmful pattern of alcohol consumption including alcohol dependence among the patient and general population specially at primary care setting [17]. It also provides a framework for intervention in the form of health education, counselling or referral to help the potential drinkers to cease or reduce alcohol consumption and thereby avoid or minimize the harmful consequences of drinking [17]. With this background the current study has been conducted to estimate the pattern of alcohol consumption and to determine its correlates, among the adult population of the state of West Bengal in India.
Materials and Methods
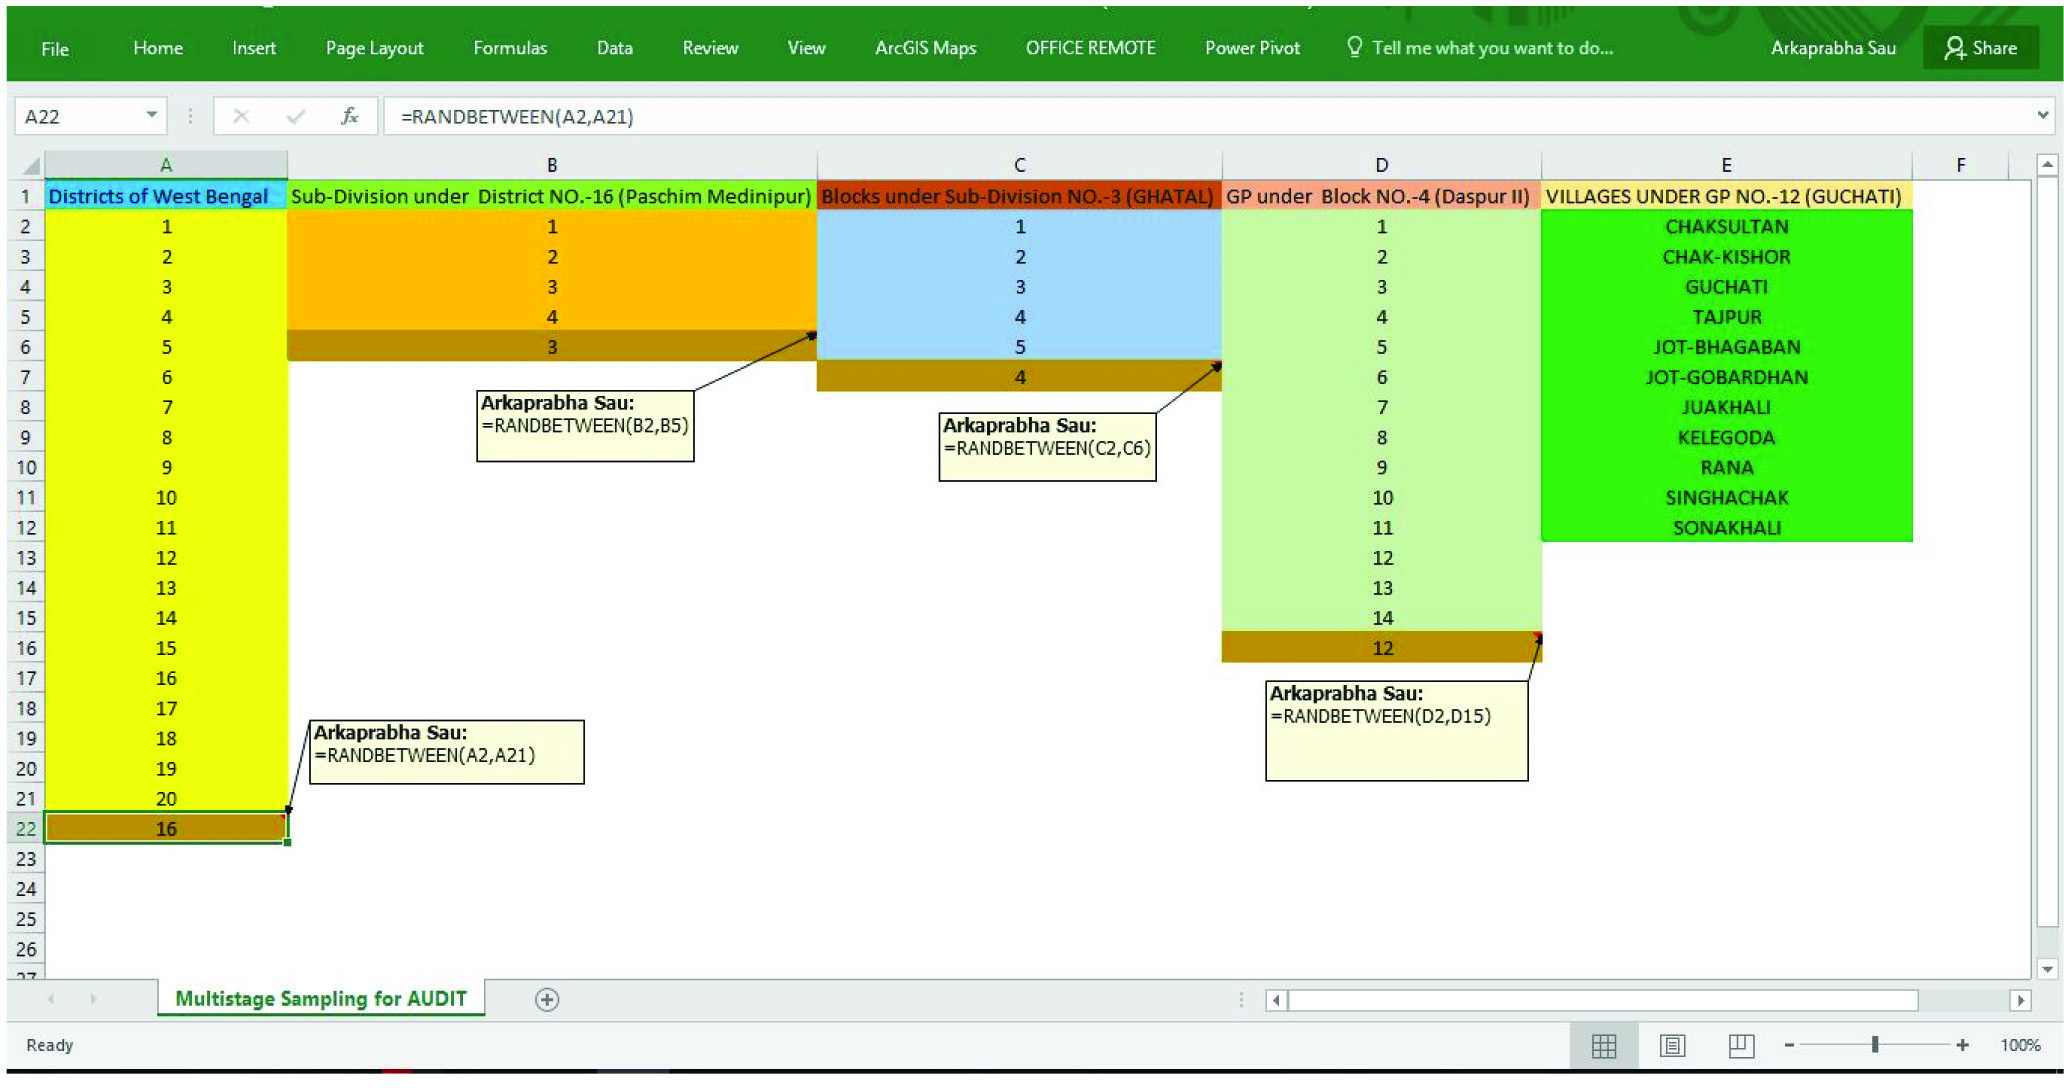
An observational descriptive study with cross-sectional design was conducted between the 1st July 2016 and 15th July 2016 among the adult population (≥ 18 years) of a selected area of the state of West Bengal. A GP, lowest tier of the 3 tier Panchayati Raj System for local administration in India, namely Guchati under Daspur II block of Ghatal Sub-Division at Paschim Medinipur district in the state of West Bengal was selected using multistage sampling technique with the help of function “RANDBETWEEN” in Microsoft Excel [Table/Fig-1].
Multistage Sampling for AUDIT.
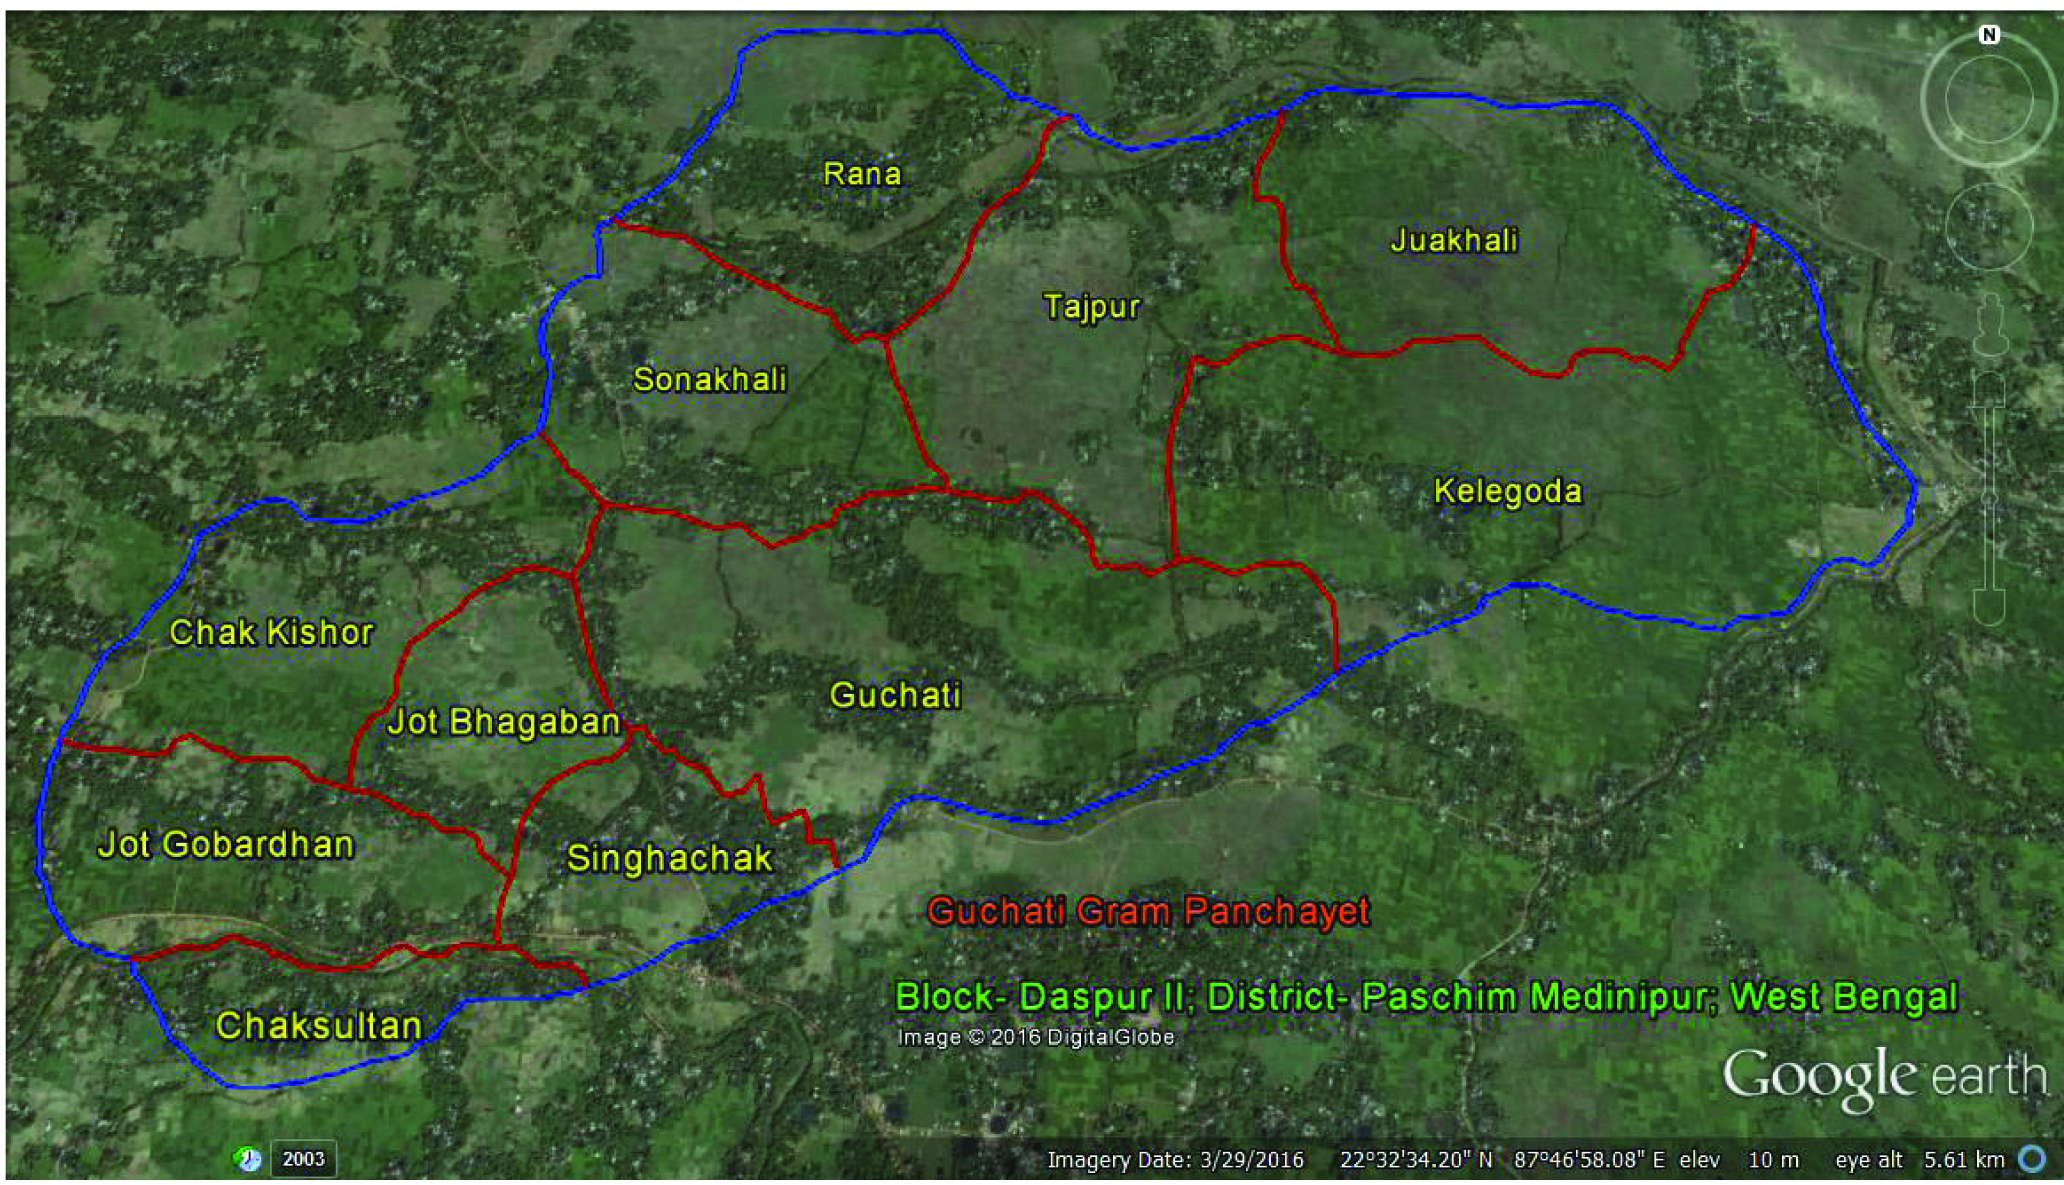
From the Guchati GP, Study population were selected using Lot Quality Assurance Sampling (LQAS) technique [18]. There are 11 villages under the Guchati GP [Table/Fig-2]. According to LQAS technique, each village under that GP was considered as a Lot. As per 2011 census total adult population of the Guchati GP was 11596. Considering desired level of confidence at 95% and desired level of accuracy at± 10%, total sample size, as per LQAS, was 96. As the sampling fraction was 0.83% i.e., less than 10%, so 96 individuals were considered to be the final sample size. So, minimum Lot sample size was calculated as 9 individuals. Nine sampling points from every village were located using Arc GIS, a Geographic Information System (GIS) software, random point selection technique. During data collection each point was identified using a GPS (Global Positioning System) enabled android smart phone. One adult individual from each sampling point or nearest to the sampling point was randomly selected for the study purpose using “RAND” function in Epi Info (android smart phone application) [19]. Then He/she was interviewed after taking informed consent.
Guchati Gram Panchayat (GP) under Daspur II block.
Those who are the permanent resident of that area were included in the study and those who never consumed alcohol in their life time were excluded from the study. Ethical approval was obtained from the Institutional Ethics Committee of RG Kar Medical College and Hospital, Kolkata, West Bengal, India.
Study Tools
Total 99 adult persons were interviewed using a pre designed and pretested, Epi Infobased digital schedule. That digital schedule was developed using Epi InfoTM7 software [19] in computer. The schedule had 2 parts, first part consisted of socio demographic and spatial information i.e., village, age, gender, education, employment status, per capita monthly income, and latitude, longitude and second part was AUDIT [17] questions. During data collection real time synchronisation between Epi Info application in smart phone and Epi InfoTM7 software in Windows platform based personal computer, was made using cloud computing (Microsoft Azure) technology. Collected data were recorded automatically into the computer Epi InfoTM7 database in real time manner.
Statistical Analysis Plan
Then recorded data were analysed by the R software and some relevant information were represented using ArcGIS maps [20]. During analysis age was grouped into “less than 40 years” and “More than or equal to 40 years”, education status was grouped into “Illiterate” and “Literate”, employment status was grouped into “Unemployed” and “Employed”. Socio economic status was derived, as per Modified BG Prasad’s social classification adjusted for May 2016 Consumer Price Index, from per capita monthly income (Indian Rupees). Then social class was grouped into “Lower and Lower middle” and “Upper and Upper middle and Middle”. Outcome (dependent) variable i.e., AUDIT scores were grouped based on risk level according to WHO guideline. Total scores of 8 or more are recommended as indicators of hazardous and harmful alcohol use, as well as possible alcohol dependence [17]. So, AUDIT score between 0 to 7 i.e., Zone-I (Low risk drinking or abstinence) risk level was considered as one group and other group was having score between 8 to 40 i.e., Zone-II (8-15) (Alcohol use in excess of low-risk), Zone-III (16-19) (Harmful and hazardous drinking) and Zone-IV (20-40) (Alcohol Dependence) risk level. Appropriate statistical tests like Intraclass correlation, chi-square test, logistic regression and Bootstrapping were applied whenever necessary. Alfa (α) was set at 5% level.
Results
Among 99 adult respondents, there were 54 (54.50%) men and 45 (45.50%) women. Mean (±Standard Deviation) age of the study population was 38.62 (±11.05) (95% CI 36.44 to 40.76) year. Mean (±SD) per capita family income of the study population was 1544 (±476) (95% CI 1454.39 to 1635.13). Among them 79.9% (95% CI 69.9% to 89.9%) were literate, 86.7% (95% CI 76.7% to 96.7%) were employed and 60.3% (95% CI 50.3% to 70.3%) belongs to “lower” and “lower middle” socio economic class as Modified BG Prasad’s social classification adjusted for May 2016 Consumer Price Index.
Mean (±SD) AUDIT score of the study population was 7.11 (±8.11) (95% CI 5.55 to 8.74). AUDIT score were consistent, as evident by Intraclass Correlation Coefficient (ICC) 0.93 (95% CI 0.84 to 0.98), between different villages.
Prevalence of hazardous and harmful use of alcohol among the study population was calculated as per Lot Quality Coverage Survey technique [Table/Fig-3].
Distribution of study participants according to AUDIT risk level and score.
| AUDIT- Risk Level | AUDIT Score | Number of individuals | Prevalence | 95% Confidence Interval (95% CI) |
|---|
| Zone-I (Low risk drinking or abstinence) | 0 to 7 | 61 | 65.5% | 55.5% to 75.5% |
| Zone-II (Alcohol use in excess of low-risk) | 8 to 15 | 16 | 17.6% | 7.6% to 27.6% |
| Zone-III (Harmful and hazardous drinking) | 16 to 19 | 14 | 8.5% | 0% to 18.5% |
| Zone-IV (Alcohol Dependence) | 20 to 40 | 8 | 8.4% | 0% to 18.4% |
Chi-square test for association between socio demographic factors and risk level:
Association between risk level of hazardous and harmful use of alcohol with various socio demographic factors show that there is statistically significant association (χ2 = 32.675, p<0.05, α= 5%, df-1) only with the gender of the study population [Table/Fig-4].
Association between risk level ofhazardous and harmful use of alcohol among the study population with various socio demographic factors. (n=99)
| Risk Level | |
|---|
| Socio Demographic Factors | Zone-I | Zone-II/ III / IV | Total | p-value |
|---|
| Age |
| Less than 40 yrs | 41 | 21 | 62 | 0.232 |
| More than or equals to 40 yrs | 20 | 17 | 37 |
| Gender |
| Men | 19 | 35 | 54 | 0.000* |
| Women | 42 | 3 | 45 |
| Employment Status |
| Unemployed | 16 | 4 | 20 | 0.074 |
| Employed | 45 | 34 | 79 |
| Education |
| Illiterate | 13 | 11 | 24 | 0.389 |
| Literate | 48 | 27 | 75 |
| Prasad’s Socio Economic Status |
| “Lower” and “Lower middle” | 42 | 23 | 65 | 0.396 |
| “Upper” and “Upper middle” and “Middle” | 19 | 15 | 34 |
* Statistically significant association (χ2 = 32.675, p<0.05, α= 5%, df-1).
Regression Analysis
After testing the assumptions, binary logistic regression was performed to ascertain the effects of age, gender (women/men), employment status (employed/unemployed), education (literate/illiterate) and per capita family income on the likelihood that study population have in the High Risk level (AUDIT Score 8-40) i.e., in Zone-II, III, and IV risk level of hazardous and harmful use of alcohol. The logistic regression model was statistically significant, χ2(5) = 68.982, p< .000. The model explained 66.9% (Nagelkerke R2) of the variance in pattern of alcohol consumption and correctly classified 87.9% of instances. The Wald test (“Wald” column) is used to determine statistical significance for each of the independent variables. The statistical significance of the test is found in the “Sig” column. From these results it has been noticed that only “gender” (p = 0.00) and “employment status” (p = 0.01) added significantly to the model with adjusted odds ratio of 82.27 (95% CI 18.17-372.58) and 0.13 (0.03 – 0.66) [Table/Fig-5].
Strength of association between risk level of hazardous and harmful use of alcohol with different socio demographic variables (Binary Logistic Regression). (n=99)
| Independent variables | B | Wald | Sig | Exp (B)/Adjusted Odds ratio (CI - 95%) |
|---|
| Age (Years) | 0.015 | 0.28 | 0.59 | 1.02 (0.95-1.08) |
| Gender (women/men) | 4.41 | 32.75 | 0.00* | 82.27 (18.17-372.58) |
| Employment status(employed/unemployed) | -2.02 | 6.04 | 0.01* | 0.13 (0.03-0.66) |
| Education(literate/illiterate) | 0.23 | 0.09 | 0.77 | 1.26 (0.28-5.97) |
| Per capita Family Income (Rs) | 0.001 | 2.36 | 0.13 | 1.001 (1.000-1.003) |
*Statistically significant association (p<0.05).
N.B- “B” (Beta co-efficient), “Sig” (Significance level), “CI” (Confidence Interval)
GIS Mapping
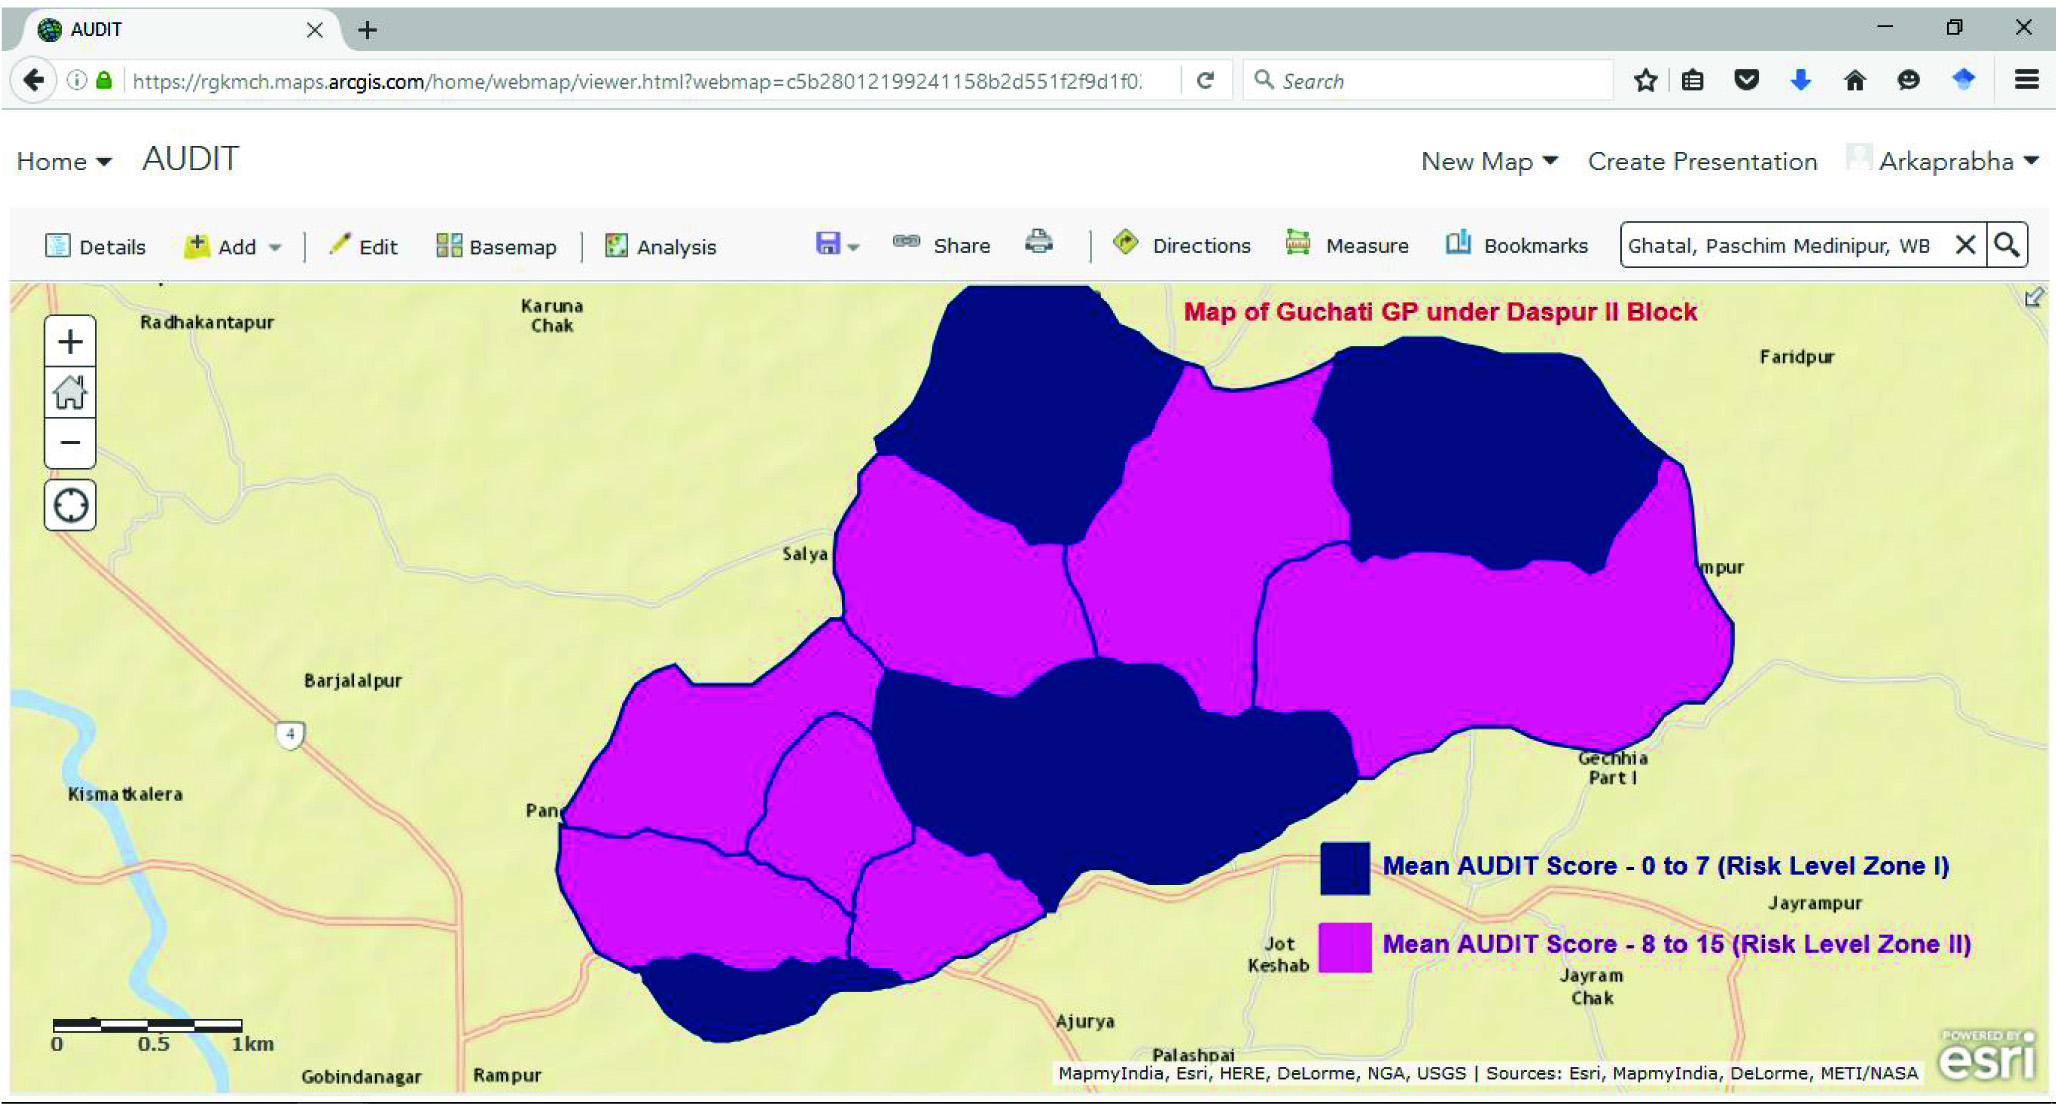
A map was developed using the ArcGIS software, showing the distribution of the villages according to risk level group. Mean AUDIT score between 0 to 7 i.e., risk level Zone-I were in the village Chaksultan, Guchati, Juakhali, and Rana. Rest of the villages had mean AUDIT score between 8 to 15 i.e., risk level Zone-II [Table/Fig-6].
Classification of villages according to mean AUDIT score.
Discussion
From this study, it was estimated that the prevalence of low risk drinking or abstinence (Zone I) was 65.5% (95% CI 55.5% to 75.5%) and the prevalence of alcohol use in excess of low-risk (Zone II) was 17.6% (95% CI 7.6% to 27.6%), and the prevalence of harmful and hazardous drinking (Zone III) was 8.5% (95% CI 0% to 18.5%) and the prevalence alcohol dependence (Zone-IV) was 8.4% (0% to 18.4%). So, the prevalence of hazardous and harmful use of alcohol including alcohol dependence in the study population was 34.5% (95% CI 24.5% to 44.5%). Study conducted by SD Rathod et al., in 2013-14, found that prevalence of hazardous and harmful use of alcohol among drinkers were 42% at Sehore district of Madhya Pradesh in India [6]. In a study, conducted by Pillai A et al., in northern Goa, they found that the prevalence of drinking habit was 74.3% of adult population aged between 30 to 33 years [5]. Current study also revealed that habit and pattern of drinking in high risk level is much higher among men, which is consistent with the study conducted by Rathod et al., in Madhya Pradesh [5,6].
Individual association between various socio-demographic factors and risk level of hazardous and harmful use of alcohol shows that only gender have the statistically significant association (p<0.05). Some other studies found significant association between educational status, employment status and socio economic condition with risk level of hazardous and harmful use of alcohol also [13]. Binary logistic regression model shows that “gender” (p = 0.00) and “employment status” (p = 0.01) added significantly to the model with adjusted odds ratio of 82.27 (95% CI 18.17-372.58) and 0.13 (0.03 – 0.66). This model also reveals that those who were employed, more prone to become high risk level drinker. To compare the results of this study, significant observations of similar studies have been tabulated in [Table/Fig-7] [6,21-24].
Significant result of different studies related to AUDs among adults [6,21-24].
| Study Conducted by | Place of Study | Year of study | Prevalence of AUDs among adults | Factors significantly associated/ not associated with AUDs |
|---|
| Joseph et al., [21] | Haryana, India | 2015 | 24.06% | 20-35 years age group, tobacco use were significantly associated with AUDs |
| Rathod et al., [6] | Sehore, India | 2014 | 42% | Male, urban residence, depression, high quality housing, tobacco use were significantly associated with AUDs |
| A Sijiv et al., [22] | Puducherry, India | 2014 | 27.5% | No significant association with age group, education, socio economic status, employment status, type of family, and marital status |
| H Zavos et al., [23] | Colombo, Sri Lanka | 2013 | 63.1% | Male gender, age, marital status, years of schooling significantly associated with AUDs but there is no significant association with urban residence and ethnicity |
| Martins et al., [24] | Piaui, Brazil | 2007 | 91.1% | No association with gender, age group, family income but friends’ influence has significant association. |
Limitation
There may be some amount of bias in the regression analysis due to confounding variables like stress factor and peer pressure. Moreover, larger cross-sectional study, involving other Gram Panchayats in India with larger sample size would have been closer to generalization.
Conclusion
Keeping the study results in mind, it can be concluded that there is a need for a comprehensive screening and treatment programme to deal with the problems of AUDs among adults to achieve good health and well beings to meet the Sustainable Development Goals (SDG).
* Statistically significant association (χ2 = 32.675, p<0.05, α= 5%, df-1).
[1]. Nadkarni A, Weiss HA, Naik A, Bhat B, Patel V, The six-year outcome of alcohol use disorders in men: A population based study from IndiaDrug and Alcohol Dependence 2016 162:107-15. [Google Scholar]
[2]. Olsson CA, Romaniuk H, Salinger J, Staiger PK, Bonomo Y, Hulbert C, Drinking patterns of adolescents who develop alcohol use disorders: results from the Victorian Adolescent Health Cohort StudyBMJ Open 2016 6(2):e010455 [Google Scholar]
[3]. Jaisoorya TS, Beena KV, Beena M, Ellangovan K, Jose DC, Thennarasu K, Prevalence and correlates of alcohol use among adolescents attending school in Kerala, IndiaDrug Alcohol Review 2016 35(5):523-29. [Google Scholar]
[4]. Saxena S, Riley L, Marshall M, Country profile on alcohol in IndiaAlcohol and Public Health 1999 8:37-60. [Google Scholar]
[5]. Pillai A, Nayak MB, Greenfield TK, Bond JC, Hasin DS, Patel V, Adolescent drinking onset and its adult consequences among men: a population based study from IndiaJournal of Epidemiology and Community Health 2014 Aug 5 68(10):922-927. [Google Scholar]
[6]. Rathod SD, Nadkarni A, Bhana A, Shidhaye R, Epidemiological features of alcohol use in rural India: a population-based cross-sectional studyBMJ Open 2015 5(12):e009802 [Google Scholar]
[7]. Seo S, Chun S, Newell MA, Yun M, Association between alcohol consumption and Korean young women’s bone health: a cross sectional study from the 2008 to 2011 Korea National Health and Nutrition Examination SurveyBMJ Open 2015 5(10):e007914 [Google Scholar]
[8]. Skogen JC, Sivertsen B, Lundervold AJ, Stormark KM, Jakobsen R, Hysing M, Alcohol and drug use among adolescents: and the co-occurrence of mental health problems. Ung@ hordaland, a population-based studyBMJ Open 2014 4(9):e005357 [Google Scholar]
[9]. Hsiao M, Malhotra A, Thakur JS, Sheth JK, Nathens AB, Dhingra N, Road traffic injury mortality and its mechanisms in India: nationally representative mortality survey of 1.1 million homesBMJ Open 2013 3(8):e002621 [Google Scholar]
[10]. Sekhri T, Kanwar R, Wilfred R, Chugh P, Chhillar M, Aggarwal R, Prevalence of risk factors for coronary artery disease in an urban Indian populationBMJ Open 2014 4(12):e005346 [Google Scholar]
[11]. Nadkarni A, Murthy P, Crome IB, Rao R, Alcohol use and alcohol-use disorders among older adults in India: a literature reviewAging & Mental Health 2013 17(8):979-91. [Google Scholar]
[12]. Balarajan YS, Fawzi WW, Subramanian S, Changing patterns of social inequalities in anaemia among women in India: cross-sectional study using nationally representative dataBMJ Open 2013 3(3):e002233 [Google Scholar]
[13]. Ramanathan S, Nagarajan K, Ramakrishnan L, Mainkar MK, Goswami P, Yadav D, Inconsistent condom use by male clients during anal intercourse with occasional and regular female sex workers (FSWs): survey findings from southern states of IndiaBMJ Open 2014 4(11):e005166 [Google Scholar]
[14]. Toomey TL, Erickson DJ, Carlin BP, Lenk KM, Quick HS, Jones AM, The association between density of alcohol establishments and violent crime within urban neighbourhoodsAlcoholism: Clinical and Experimental Research 2012 36(8):1468-73. [Google Scholar]
[15]. Collin J, Hill SE, Smith KE, Merging alcohol giants threaten global healthBMJ 2015 351:h6087 [Google Scholar]
[16]. WHO. The ICD-10 classification of mental and behavioural disorders: diagnostic criteria for research. Geneva: World Health Organization, 1993 [Google Scholar]
[17]. Saunders JB, Aasland OG, Babor TF, De la Fuente JR, Grant M, Development of the alcohol use disorders identification test (AUDIT): WHO collaborative project on early detection of persons with harmful alcohol consumption-IIAddiction 1993 88(6):791-804. [Google Scholar]
[18]. Robertson SE, Anker M, Roisin AJ, Macklai N, Engstrom K, LaForce FM, The lot quality technique: a global review of applications in the assessment of health services and disease surveillanceWorld Health Statistics Quarterly 1997 50:199-209. [Google Scholar]
[19]. Epi Info” 7.1. 5, Centers for Disease Control and Prevention. Atlanta, USA, 2015 [Google Scholar]
[20]. Kennedy MD, Introducing geographic information systems with ARCGIS: a workbook approach to learning GIS 2013 John Wiley & Sons [Google Scholar]
[21]. Joseph J, Das K, Basu D, Sharma S, Screening for harmful alcohol use with the alcohol, smoking, and substance involvement screening test in clients recruited from workplace settings of a Tertiary Care Hospital of North IndiaIndian Journal of Social Psychiatry 2016 32(2):164 [Google Scholar]
[22]. Sujiv A, Chinnakali P, Balajee K, Lakshminarayanan S, Kumar SG, Roy G, Alcohol use and alcohol use disorder among male outpatients in a primary care setting in rural PuducherryIndustrial Psychiatry Journal 2015 24(2):135 [Google Scholar]
[23]. Zavos HM, Siribaddana S, Ball HA, Lynskey MT, Sumathipala A, Rijsdijk FV, The prevalence and correlates of alcohol use and alcohol use disorders: a population based study in Colombo, Sri LankaBMC Psychiatry 2015 15(1):1 [Google Scholar]
[24]. Vilanova CM, de Souza Filho MD, de Sousa LG, Andrade FT, Santos TL, de Assis RC, Alcohol use by Brazilian college studentsFamily Medicine & Medical Science Research 2016 5:194 [Google Scholar]