The purpose of this study was to assess the correlation and agreement between the arterial and central VBG analyses in patients undergoing elective CABG surgery.
Materials and Methods
The study population consisted of all patients undergoing CABG in a large-scale university-affiliated hospital in Kermanshah, Iran from June 2011 to June 2012. The study protocol was approved by both the Institutional Review Board and the Ethics Committee of Kermanshah University of Medical Sciences. Patients’ confidentiality of data was maintained throughout the study. All the patients gave their written and informed consent.
Excluding criteria were any known histories of renal, hepatic and respiratory failure, recent history of cigarette smoking, undergoing intra or postoperative cardiopulmonary resuscitation, experiencing postoperative hypothermia or hyperthermia, haemodynamic instability, severe bleeding, or aged < 30 years or > 75 years.
After the patients underwent CABG operation, they usually have an arterial and a central venous line in place; therefore, obtaining an arterial and venous blood sample in these patients is an easy process. Four to six hours after extubation from a ventilator, we measured and documented the patients’ body temperature using an oral glass thermometer. Thereafter, we obtained a 2 mm arterial and 2 mm venous blood sample from each patient’s arterial and central venous line, respectively. Blood samples were drawn into tubes which were covered with heparin.
Using an ice-filled container we immediately transferred the samples to the hospital’s laboratory and the blood was analysed with a blood gas analyser (Nova Biomedical®, Waltham, US). The analyser was standardised daily for prevention of miscalculation on a daily basis using a quality control assurance protocol. At the time of blood sampling, the patients were receiving nasal oxygen at a rate of 4–6 litre per minute.
The data collection tool consisted of a demographic questionnaire and a data sheet for documenting the ABG and VBG values.
The normal ranges for the ABG indices were considered as: pH = 7.35 to 7.45; PCO2, 35−45 mmHg; HCO3, 21−28 mmol/L; PO2, 83−108 mmHg; SO2, 95−98% and BE, −2 to +3 mmol/L.
Statistical Analysis
To calculate the sample size, we employed the Power and Sample Size (PS) calculation software (Vanderbilt). PS is a user-friendly mini-program for sample size calculation. With presumption of the minimum value of correlation coefficient for oxygen pressure as 0.29 [10] and a confidence interval of 95%, the PS output for sample size was 100. Accordingly, we recruited a convenient sample of 100 patients undergoing elective CABG. We employed the Stata software (version 12; Stata Corporation, College Station, TX) for data analysis. The Bland-Altman method was employed to assess the agreement between the arterial and venous values. To examine the correlation between ABG and VBG indices we employed the Pearson’s correlation test. On the other hand, to predict the ABG values based on the VBG values we employed the linear regression analysis. The significant level for the tests was 0.05.
Results
In total, 200 blood samples were obtained from 100 patients (100 for ABG and 100 for VBG). Patient’s mean age was 58.9±9.1 (mean±SD) years. Total 51% of the participants were female. None of the patients were febrile (ranging from 36.8°-37.5°).
Based on the arterial blood samples, only 45 patients had normal pH values. According to the ABG samples, 23 patients had acidosis and 32 patients had alkalosis. The mean arterial and venous pH was 7.40±0.08 and 7.36±0.07, respectively. In our study the mean (95% CI) difference between the arterial and venous pH, HCO3 and PCO2 were 0.046 (0.025-0.067), -1.41 (-2.42 to-0.41) and 6.59 (4.58-8.34), respectively.
The results of the Pearson’s correlation test showed a strong and positive correlation between ABG and VBG values regarding pH, partial PCO2, bicarbonate (HCO3) and BE r=0.73, r=0.74, r=0.67, r=0.71, respectively; p<0.001 for all the variables); however, the correlation between the arterial and venous partial PO2 and SO2 was moderate (p=0.005 and p=0.006, respectively) [Table/Fig-1].
Results of the Pearson’s correlation test and linear regression analysis in terms of the arterial and venous blood gas indices*.
| Blood gas indices | Arterial | Venous | Mean difference (95% Cl)* | Pearson’s r (95% Cl) | R square | p-value | ß slop (95% CI) |
|---|
| pH | 7.40±0.08 | 7.36±0.07 | 0.046 (0.025 to 0.067) | 0.73 (0.66 to 0.98) | 0.53 | < 0.001 | 0.83 (0.67-0.97) |
| PCO2-mmHg | 35.75±6.24 | 42.35±6.27 | 6.59 (4.85 to 8.34) | 0.74 (0.60 to 0.82) | 0.55 | < 0.001 | 0.73 (0.60-0.89) |
| HCO3-mmol/L | 23.00±0.68 | 24.40±3.54 | -1.41 (-2.42 to -0.41) | 0.67 (0.53 to 0.85) | 0.45 | < 0.001 | 0.70 (0.54-0.85) |
| PO2-mmHg | 86.92±24.20 | 47.55±8.31 | 39.36 (34.32 to (44.41) | 0.29 (0.15 to 0.82) | 0.08 | 0.005 | 0.83 (0.28-1.39) |
| SO2 (%) | 95.42±2.85 | 76.37±10.56 | 19.03 (16.88 to 21.19) | 0.27 (0.14 to 0.35) | 0.07 | 0.006 | 0.07 (0.02-0.12) |
| BE-mmol/L | -1.30±4.18 | -0.85±4.20 | -0.44 (-1.61 to 0.72) | 0.71 (0.57 to 0.85) | 0.50 | < 0.001 | 0.71 (0.57-0.85) |
* All the mean±values are means±standard deviations unless stated otherwise.
The differences are arterial values minus venous values.
The linear regression model for estimating the arterial values based on the venous variables showed the following relationship:
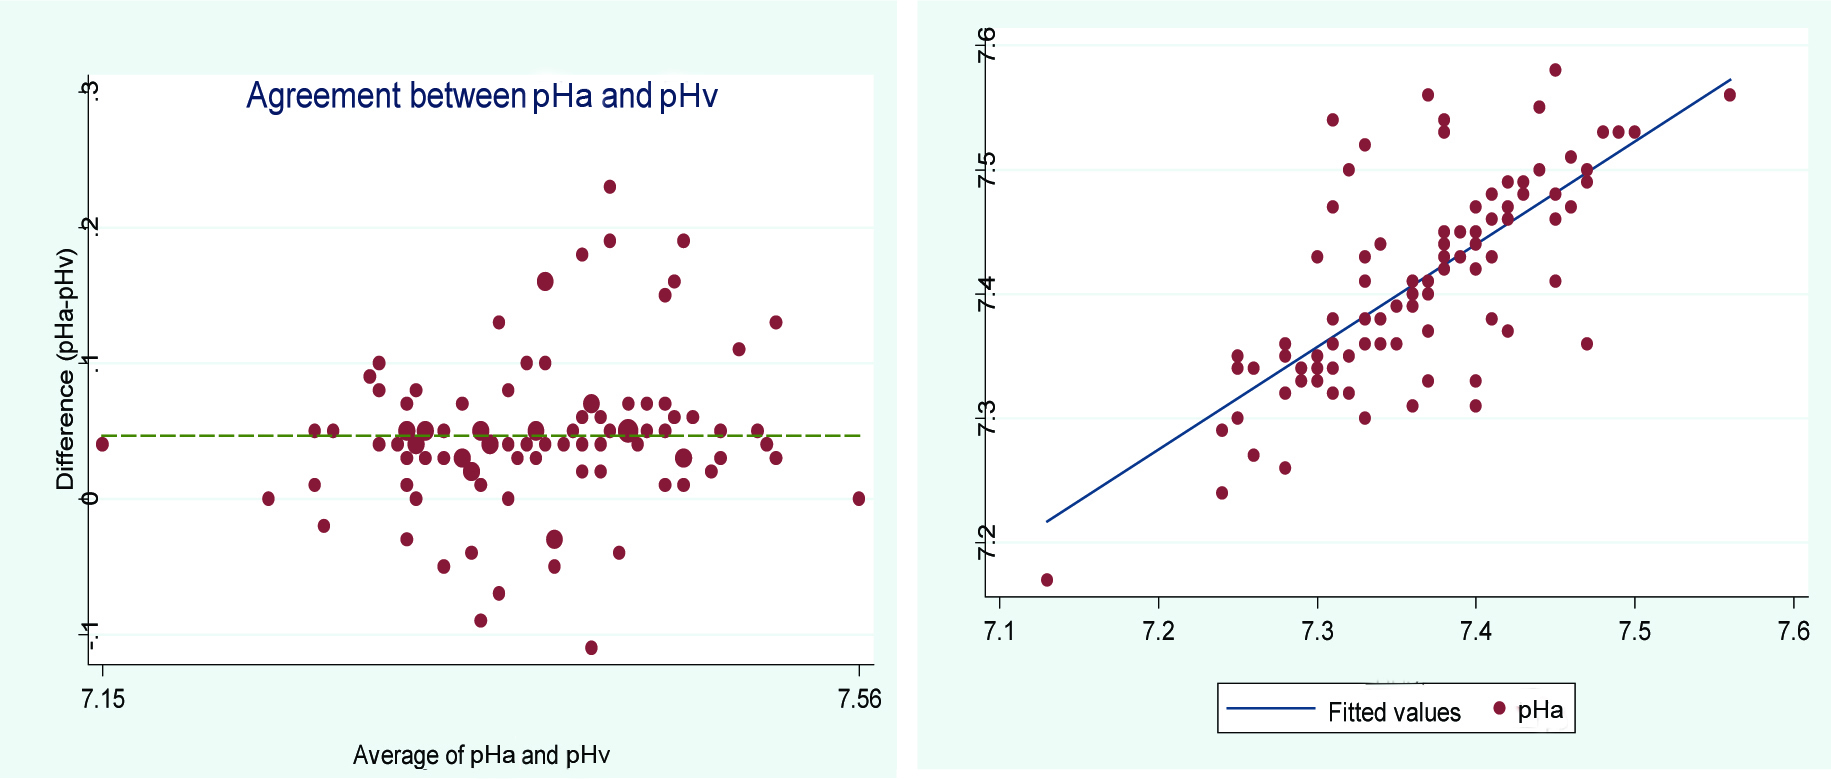
pHa = 1.33 + (0.83 × pHv)
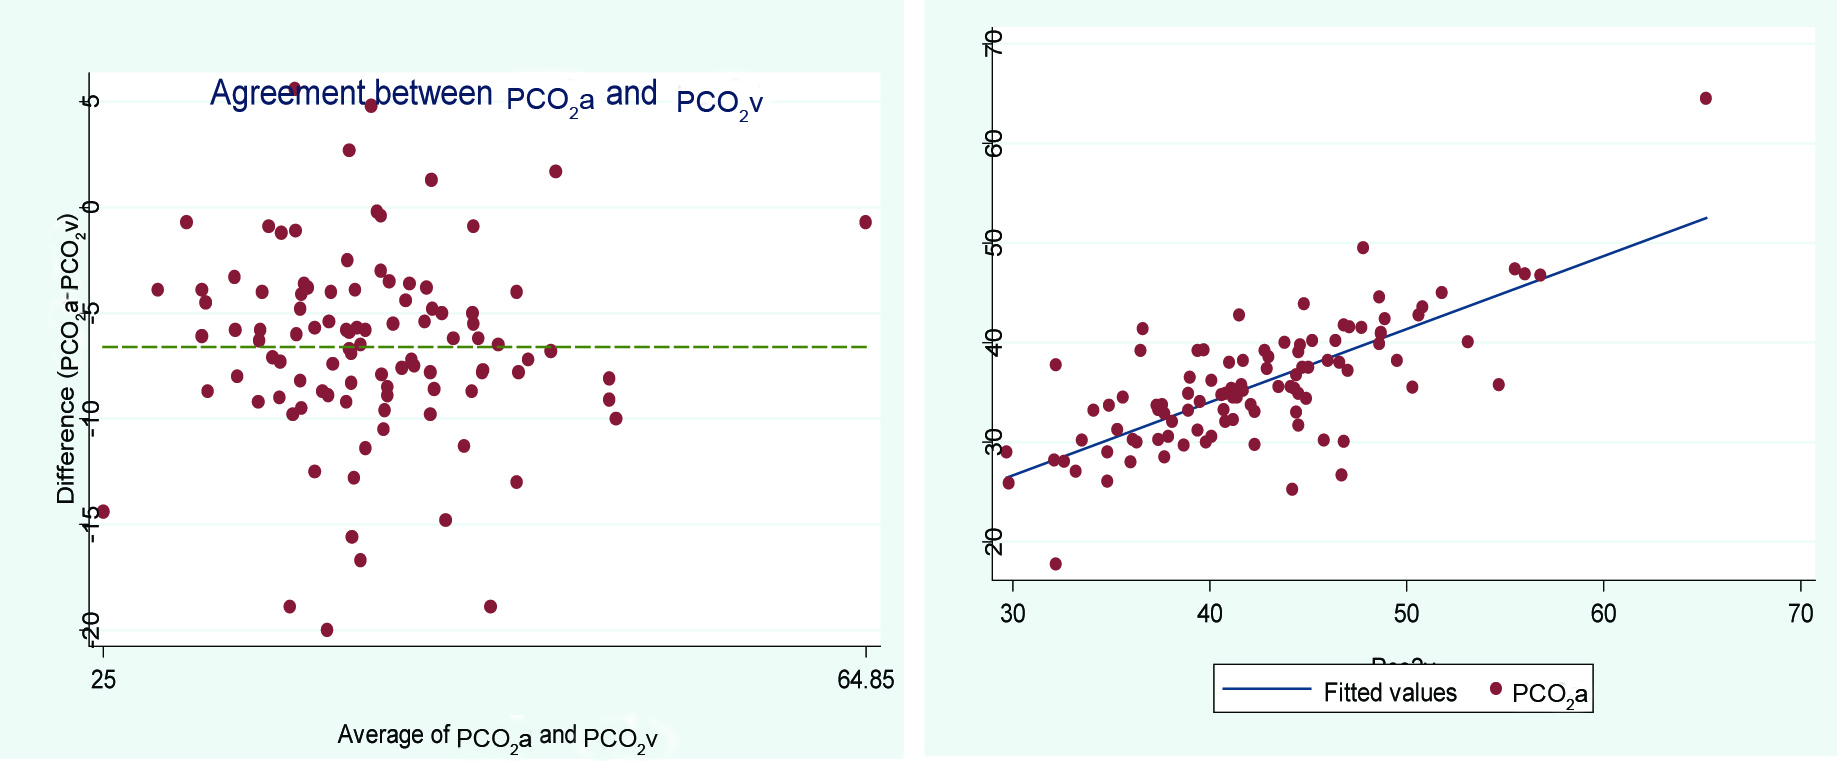
PaCO2 = 4.63 + (0.73 × PvCO2)
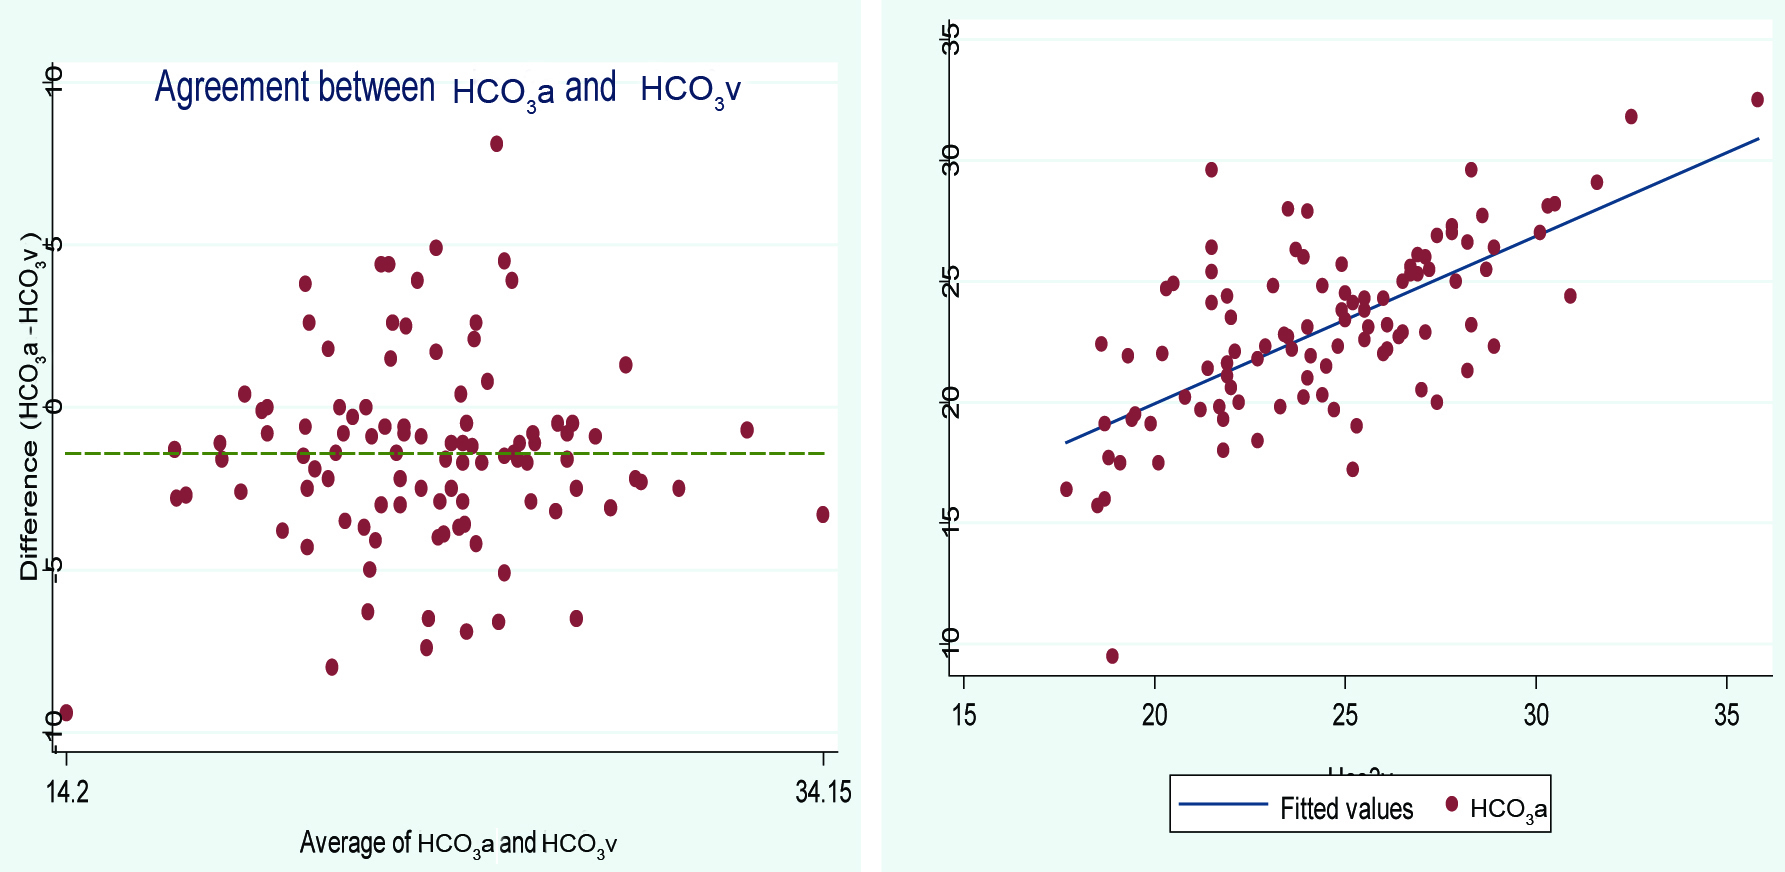
HCO3a = 6 + (0.70 × HCO3v)
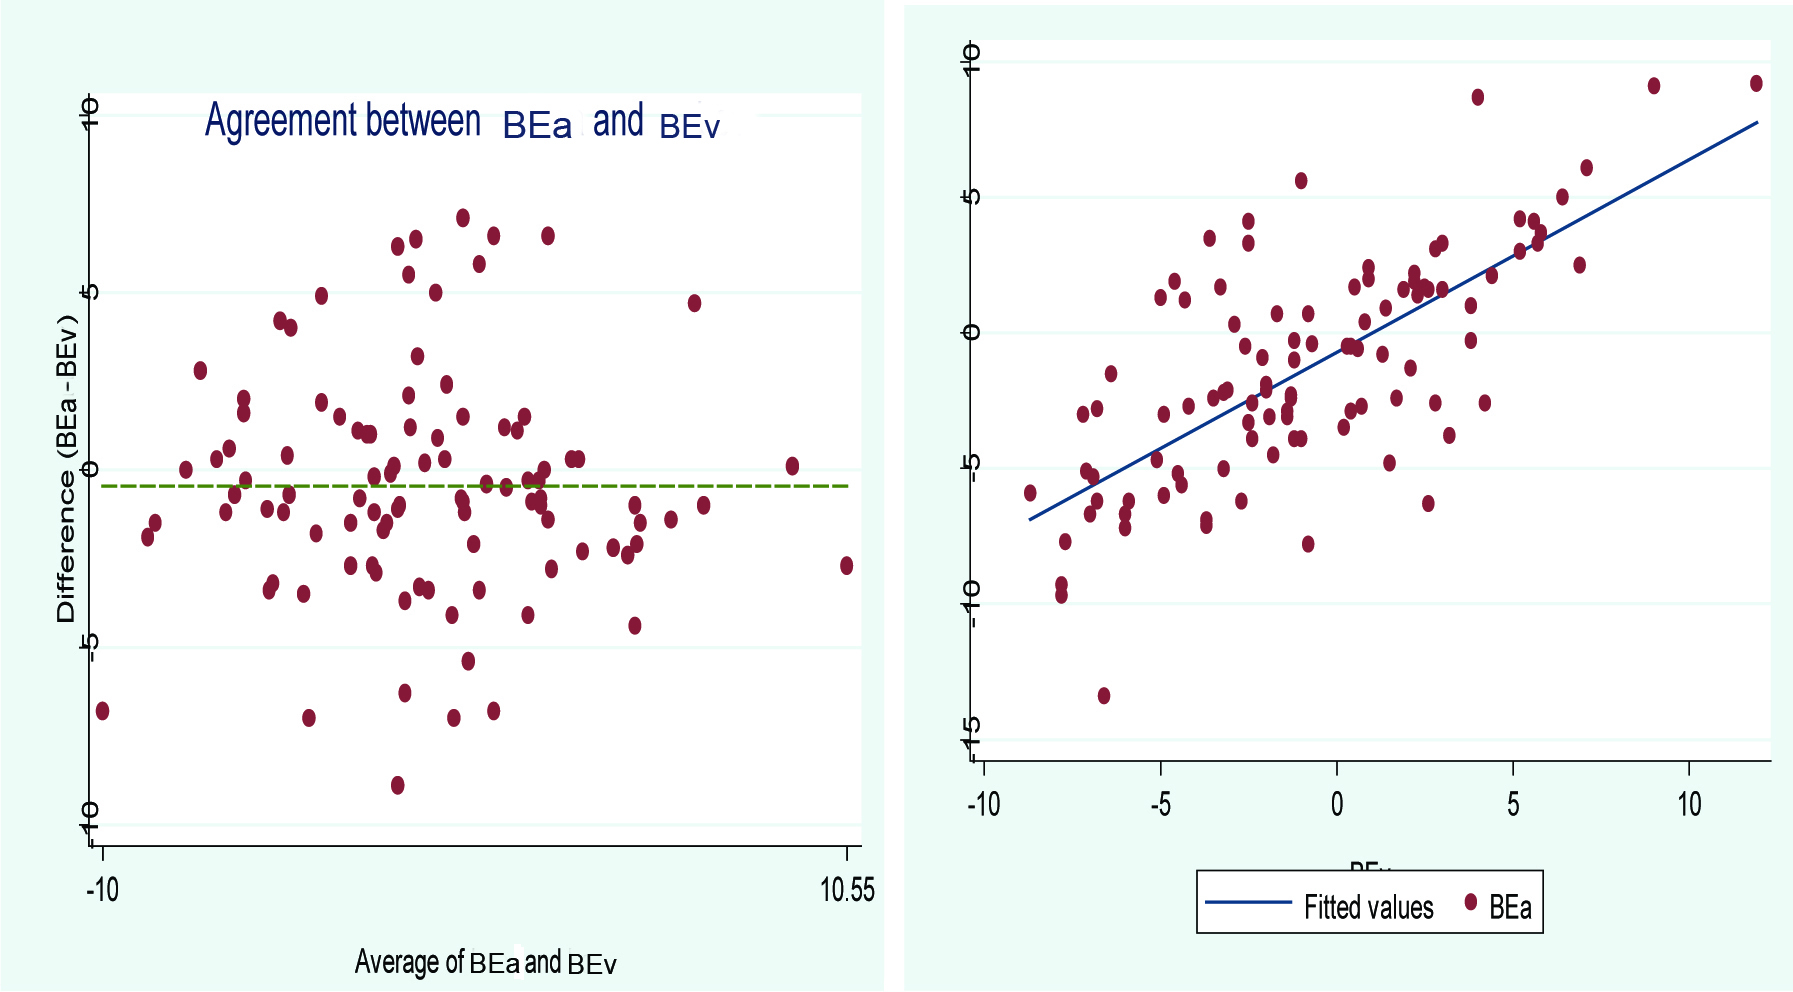
BEa = -0.7 + (0.71 × BEv)
The letters ‘a’ and ‘v’ in the indices stand for arterial and venous, respectively.
The results of Bland-Altman showed a good agreement between ABG and VBG indices, however, this agreement was more about HCO3 and pH and less agreement was found in term of SO2 and PO2 [Table/Fig-2]. [Table/Fig-3,4,5 and 6] expresses Bland-Altman plot of arterial and central venous blood and fitted linear regression of ABG and VBG indices.
The results of the Bland-Altman method for examining the agreement between the arterial and venous blood gas indices.
| Blood gas indices | Agreement coefficient | p-value | 95% CI |
|---|
| pH | 0.60 | < 0.001 | 0.50 to 0.70 |
| PCO2 – mmHg | 0.47 | < 0.001 | 0.37 to 0.57 |
| HCO3 - mmol/L | 0.62 | < 0.001 | 0.50 to 0.73 |
| PO2 - mmHg | 0.05 | < 0.001 | 0.01 to 0.08 |
| SO2 (%) | 0.03 | < 0.001 | 0 to 0.05 |
| BE - mmol/L | 0.70 | < 0.001 | 0.61 to 0.80 |
Bland-Altman plot of arterial and central venous blood pH fitted linear regression.
Bland-Altman plot of arterial and central venous blood PCO2 fitted linear regression.
Bland-Altman plot of arterial and central venous blood HCO3 fitted linear regression.
Linear correlation and agreement diagram of the arterial and venous BE.
Discussion
The aim of this study was to examine the correlation and agreement between the arterial and central VBG in patients undergoing CABG. The study findings showed a strong and significant correlation and agreement between the ABG and VBG related variables.
Treger R et al., studied the agreement and correlation between ABG and VBG variables among 40 ICU patients [3]. Among the 190 samples that were analysed, similar to our study, they found that venous PO2 cannot replace arterial PO2 in patients receiving acute care, although this group of patients probably have a pulse oximetry which decreases the need for evaluation of SO2 and PO2 using an arterial blood sample. It is notable that the patients mostly had sepsis, which might not have been a good representative of ICU patients.
In their Bland-Altman analysis for agreement between ABG and VBG, they also found an excellent agreement between arterial and venous pH and HCO3. They documented that in regression models, multivariate analysis in determining arterial pH, does not change the R2 considerably, showing that a univariate linear regression equation is a good predictor of arterial pH.
Rudkin SE et al., in their study in 2012 among 346 trauma patients, found that their regression model was able to predict 72% of the arterial pH [11], although their equation was very similar to ours, their’s had a higher predictive power (R2=0.70 vs R2=0.52) and concluded that it was not appropriate for use among patients who need acute intensive care since the management of this group is sensitive and requires more consistency. Regarding BE they also had a similar regression model compared to ours but still had a higher predictive power (R2=0.75 vs. R2=0.50).
In a study in 2010, they found that among patients that were undergoing lumbar disk surgery, arterial and VBG values correlated strongly regarding pH, PCO2, HCO3, BE and SO2 (r=0.93, r=0.89, r=0.88, r=0.86, r=0.34; p<0.001) but did not correlate very strongly regarding PO2 (p = 0.394) [8]. They documented different linear regression models when compared to our study.
This could be due to some factors like the setting of our study as our patients were patients who underwent CABG operation and our samples were obtained during the postoperation period, whereas, their samples were obtained two hours after induction of anaesthesia and during operation, which might have caused a fluctuation in the blood gas variables, furthermore their samples were obtained from a peripheral vein unlike our study which was obtained from a central vein source. The difference between central and peripheral samples might be attributed to some difference between the results of the two studies, as one study by Toftegaard M et al., in 2008 [20], found that ABG was more compatible with VBG obtained from a central line rather than a peripheral line in term of PCO2, however about pH both types of veins (peripheral and central veins) have more acceptable coherency with ABG.
In a meta-analysis in 2014 by Bloom BM et al., evaluated the differences between ABG and VBG variables [17]. They found a pooled mean difference of 0.033 (vs. 0.046 in our study) and 1.03 (vs. 1.41 in our study) for pH and bicarbonate between arterial and venous samples, respectively. Regarding PCO2 they found a mean difference of 4.41 (vs. 6.59 in our study) mmHg among studies. Overall they found venous pH and bicarbonate were good representative of ABG, although for PCO2 it was not the same.
The Bloom BM et al., study was also indicative to using VBG in some parameters such as pH, although their review only included studies that had patients with stable circulatory status [17].
In a review published in 2010, Kelly AM et al., evaluated the consistency between arterial and venous blood gas variables among studies published between 1966 and 2010 [18]. They reported that among 12 studies that met their inclusion criteria, regarding pH, studies that evaluated patients with ketoacidosis in comparison to those that evaluated patients with COPD, reported more consistency between their arterial and venous pH (weighted difference of 0.02 vs. 0.03). Regarding PCO2, the review showed that among three studies that evaluated arterial hypercarbia with laboratory based testing [5,9,19], all reported a 100% sensitivity for a cut-off of 45 mmHg in venous samples. For bicarbonate, when they pooled the data of seven studies, they found a weighted difference of 1.41 mmol/L between arterial and venous values.
For base excess, Toftegaard M et al., showed that the difference between ABG and VBG was 0.089 mmol/L [20].
One study in 2005 showed that VBG is not a good replacement for ABG, when evaluating blood gas variables in post-trauma patients receiving treatment in intensive care unit [21].
In a recent study by Shirani F et al., they found that low blood pressure (systolic blood pressure less than 90) can increase the difference between arterial and venous related variables in the blood gas analysis [22]. It may be clinically notable that some special conditions should be considered when using a venous blood gas for patient evaluation and management. On the other hand, some studies [20] have indicated that agreement between ABG and VBG variables may be maintained in haemodynamic instability.
Middleton P et al., also reported a significant correlation and agreement between the arterial and venous pH, bicarbonate and base excess and suggested the use of venous pH instead of arterial pH for ICU patients [10].
In our study, the agreement and correlation between the arterial and central venous PCO2 was also strong and significant. However, the results of the study by Parvizi R et al., revealed a weak correlation between arterial and venous PCO2 and PO2 in patients undergoing cardiac surgery [13]. They found a significant difference between arterial and venous blood gas variables and concluded that these two cannot be interchangeably used. They made this conclusion based on the difference between ABG and VBG variables before, during and after operating room, that the patients have taken some medications, in compared to our study in which, we evaluated the changes and the correlation among the blood gas indices at least one day after surgery. So their findings may not have been a good indication for this conclusion.
In terms of BE, our findings also showed a strong and significant correlation between arterial and central venous values. However, the correlation and agreement between the arterial and central venous PO2 and SO2 was weak.
Limitation
We recruited a convenience sample for the study. Convenience sampling entails a low generalizability. Since, only patients undergoing CABG were studied, the findings may not be generalizable to all patients and settings. Our patients were postoperative and they all had a central line in place which is not applicable for every patient setting.
Since the peer management of patients based on their VBG indices would be unethical, our study, like previously conducted studies, did not allow an absolute clinical evaluation of patients based on VBG.
Conclusion
Central VBG analysis cannot replace ABG analysis in measuring exact PO2 status, necessitating arterial sampling in some cases, but with respect to the accuracy of pulse oximetry measurements in determining the exact PO2 status, for the rest of the indices a central VBG rather than an ABG can be utilised for determining patient’s acid-base status. Particularly in patients who are hospitalised for a long time and who have a central venous catheter in place like patients who have undergone CABG, thus reducing the risk and need for invasive arterial sampling.
* All the mean±values are means±standard deviations unless stated otherwise.
The differences are arterial values minus venous values.