BC continues to be a significant health threat being the second most common cancer among Indian women [1]. Incidence rate remains highest in more developed regions but mortality is relatively much higher in less developed countries due to lack of early detection and access to treatment facilities [2]. With the availability of highly sensitive immunoassays, it has become apparent that PSA is expressed in non prostatic tissues. The peri urethral (skene’s) gland was the first female tissue that was suggested to be able to produce PSA [3]. Since then numerous studies have demonstrated the presence of PSA in various normal and pathological tissues and body fluids like– healthy breast tissue, breast tumour, breast cyst, nipple aspirate fluid and breast milk [4–7].
The steroid hormones mostly androgens and progestins regulate the expression of PSA gene in female breast [8] and various molecular studies have also established that the mRNA of breast tumour PSA is sequentially identical to prostatic PSA [9].
The aim of the present study was to measure the relative proportion of molecular forms of PSA in benign breast disease and breast cancer both before and after surgery/therapy and to analyse their association with the severity of the disease process.
Materials and Methods
The present study was a case-control study carried out in the Department of Biochemistry, Gauhati Medical College and Hospital in collaboration with Dr B Borooah Cancer Institute, Guwahati from May 2013 to July 2014.
Case Group comprised of 50 females {sample size taken based on the formula [z x (p) x (1-p) x 100/c ] where z= confidence level (1.96), p= percentage picking a choice (.5), c= confidence interval (0.1). Based on the formula our sample size comes to 96, but due to paucity of time and resources we made it to 50 as a minimum of 30 subjects is required to come to a statistical conclusion [10]} subjects histologically diagnosed with BBD and 50 subjects histologically diagnosed with BC in the age ranging from 18 to 65 years who sought health care at the surgery outpatients department or were admitted in the Department of Surgery in Gauhati Medical College and Hospital and Dr B Borooah Cancer Institute, Guwahati. Clinical staging of breast cancer was done according to AJCC staging [11]. Exclusion Criteria includes Women taking contraceptive pills or hormone replacement therapy, with a past/present history of any gynaecological/other malignancy, presence of any chronic endocrine disease like diabetes, thyroid disorders, with impaired renal and liver function test, women on chemotherapy/radiotherapy due to breast cancer. Control Group comprised of 50 age matched healthy females without any signs and symptoms of breast discomfort.
Taking all aseptic and antiseptic precautions, 5 ml of blood was drawn from the median cubital vein. Fasting samples were used for all the investigations. The vials containing separated serum sample were labeled properly and stored at -200C, if estimations were not done within eight hours of collection of the blood. However, all estimations were completed within 24 hours of collection of blood sample.
Methods of Evaluation: Estimations of serum fasting glucose, lipid profile (total cholesterol TC, triglyceride TGL and HDL), serum urea and creatinine were done using MERCK microlab 300 Semi autoanalyser. VLDL and LDL were calculated using Friedewald’s formula. Estimations of serum total PSA and serum free PSA were done using ELISA Microplate Reader (Biorad 680).
Chemicals and Reagent Kits: All the chemicals used in the study were of analytical grade and deionized (Millipore) water was used. For serum sugar [12], urea [13], creatinine [14], total cholesterol [15] and triglycerides [16] determination, test kits obtained from Coral Clinical Systems, for HDL cholesterol [17], autopak test kit from Siemens Limited, for serum total PSA, DS-EIA-TOTAL PSA kit [18] and for serum free PSA DS- EIA FREE PSA kits [19] were used.
Statistical Analysis
ANOVA test and student’s t-test were used whenever applicable to analyse differences in baseline characteristics between the control and the test group. Correlations were observed by using Pearson correlation coefficient. The results were considered significant when the probability (p-value) was less than 0.05. Statistical analysis was done using GraphPad InStat version 3.00. All the statistical graphs were prepared using Microsoft Excel 2007.
Results
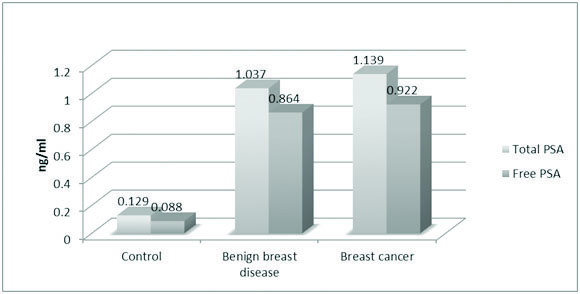
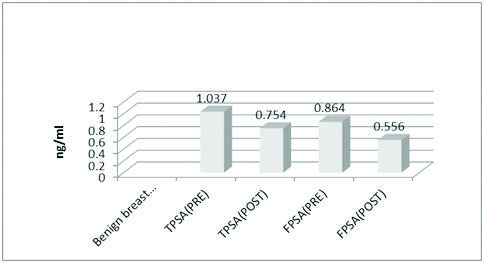
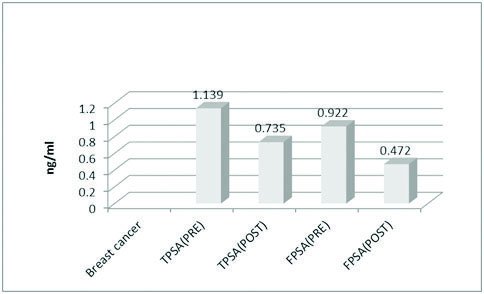
The mean values of FBS (85.24 mg/dl), total cholesterol (179.22 mg/dl) and LDL (109.10 mg/dl) were significantly high in the BC group [Table/Fig-1]. The mean value of TPSA in control and the case groups were 0.129 ng/ml, 1.037 ng/ml and 1.139 ng/ml respectively. The mean value of FPSA in control and case groups were 0.088 ng/ml, 0.864 ng/ml and 0.922 ng/ml respectively. The difference being statistically significant in both the groups (p<0.0001) [Table/Fig-2](merge with the previous line). The mean values of TPSA and FPSA both before and after surgery in BBD and BC were analysed. In BBD the preoperative mean value of TPSA was 1.037 ng/ml while in postoperative state it changed to 0.754 ng/ml. The preoperative mean value of FPSA in BBD was 0.864 ng/ml which changed postoperatively to 0.556 ng/ml. Results being extremely significant in both the groups (p<0.0001) [Table/Fig-3](merge with the previous line). For BC the preoperative mean value of TPSA was 1.139 ng/ml which changed to postoperative mean value of 0.735 ng/ml. The preoperative value of FPSA in BC was 0.922 which changed to postoperative mean value of 0.472 ng/ml. Here also, the difference was considered extremely significant (p < 0.0001) [Table/Fig-4].
Showing the mean values of age and biochemical parameters of both control group and case group (ANOVA).
| Parameter | Control | BBD | BC | p-value |
|---|
| Age (years) | 43.34±10.95 | 36.30±10.22 | 42.74±10.37 | |
| FBS (mg/dl) | 81.16±7.78 | 81.44±8.39 | 85.24±6.60 | 0.005 |
| Urea (mg/dl) | 21.56±4.48 | 22.15±3.67 | 22.60±4.88 | 0.486 |
| Creatinine (mg/dl) | 0.73±0.12 | 0.75±0.12 | 0.76±0.13 | 0.351 |
| Cholesterol (mg/dl) | 151.32±42.75 | 161.36±36.53 | 179.22±34.56 | 0.0014 |
| Triglyceride (mg/dl) | 133.32±40.23 | 121.18±48.24 | 131.60±47.35 | 0.354 |
| HDL (mg/dl) | 45.84±12.03 | 40.80±11.80 | 45.52±13.18 | 0.769 |
| LDL (mg/dl) | 91.40±22.38 | 96.40±26.63 | 109.10±25.57 | 0.0016 |
| VLDL (mg/dl) | 26.72±8.51 | 24.24±9.70 | 26.40±9.99 | 0.361 |
Note: BBD - Benign breast disease; BC - Breast cancer; FBS - Fasting blood sugar; HDL - High density lipoprotein; LDL - Low density lipoprotein; VLDL - Very low density lipoprotein
Showing the mean values of total and free PSA in both control and case groups.
Showing the mean values of total and free PSA in BBD before and after surgery.
Showing mean values of Total and free PSA in breast cancer both before and after surgery.
The mean value of serum TPSA in premenopausal and postmenopausal women of control group was 0.139 ng/ml and 0.115 ng/ml. The difference was not statistically significant (p=0.506). The FPSA values in both premenopausal and postmenopausal women of control group were 0.133 ng/ml and 0.108 ng/ml standard. The difference between the two groups was not statistically significant (p=0.744).
In case of BBD the mean value of serum TPSA in premenopausal and postmenopausal women was 1.03 ng/ml and 0.968 ng/ml respectively and the difference between the groups were not statistically significant (p= 0.593). The FPSA values in both premenopausal and postmenopausal group were 0.989 ng/ml and 0.957 ng/ml respectively. The statistical difference between the two groups were not significant (p= 0.547).
For BC, the TPSA values in premenopausal and postmenopausal groups were 1.096 ng/ml and 0.986 ng/ml respectively, the difference between the groups being not statistically significant (p= 0.301). The FPSA values in both premenopausal and postmenopausal groups were 1.082 ng/ml and 0.940 ng/ml respectively. The difference between the groups were not statistically significant (p= 0.949).
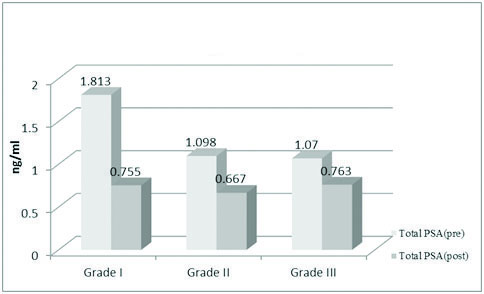
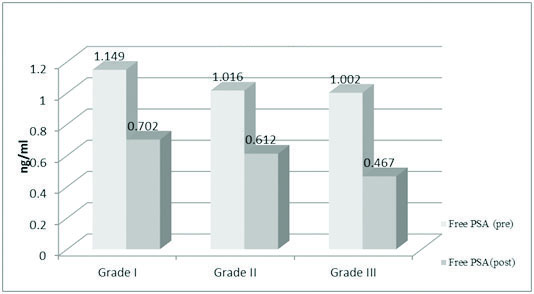
Tumour grading was done according to AJCC staging. In Grade I tumours the mean preoperative value of TPSA was 1.813 ng/ml which came down postoperatively to 0.755 ng/ml. The preoperative FPSA mean value in Grade I tumour was 1.149 ng/ml which changed postoperatively to 0.702 ng/ml. In both the cases the difference was statistically significant (p < 0.0001).
In Grade II tumours, the preoperative TPSA mean was 1.098 ng/ml which changed postoperatively to 0.667 ng/ml. The preoperative free PSA mean value was 1.016 ng/ml which came down to 0.612 ng/ml. Here also, the difference was statistically significant (p<0.001).
In grade III tumours, the preoperative TPSA mean was 1.070 ng/ml which changed postoperatively to 0.763 ng/ml. The difference was statistically significant (p=0.0002). The FPSA values also witnessed a change from a preoperative value of 1.002 ng/ml to 0.467 ng/ml. The difference was considered statistically significant (p<0.001) [Table/Fig-5,6].
Showing mean values of total PSA in breast cancer according to tumour grade.
Showing mean values of free PSA in breast cancer according to tumour grade.
Discussion
From the present study, it was seen that in BC, the mean value of TC (179.22±34.56) and LDL (109.10±25.57) were higher than the other two groups (p = 0.0014 and p = 0.0016). Dash P et al., demonstrated a similar finding, in their study where the mean value of TC (200.8±7.7) and LDL (135±7.5) were higher in patients of BC than the control group and those with BBD (p <0.001) [20]. Ray G and Hussain SA demonstrated that serum TC, LDL-C and TGL were found to be significantly elevated in BC patients as compared to controls [21]. Ferraroni M et al., demonstrated a significantly higher value of TC and LDL when BC cases were compared with controls (226.4 vs. 215.0 and 148.3 vs 138.7 respectively [22]. A statistically significant association (p<0.0001) of TPSA and FPSA was seen in all the three groups. As described earlier PSA was measured again on 10-14 day postsurgery in both BBD and BC groups. The difference of postoperative values for both TPSA and FPSA in BBD and BC group was statistically significant (p<0.0001). Dash P et al., in 2011 conducted a similar study where a prominent rise in TPSA was observed in both BBD and BC when compared to control group’s TPSA [20] whereas, they did not find any statistical difference in both TPSA and FPSA levels in benign vs malignant group. The pre and postsurgical analysis of TPSA and FPSA levels in both BBD and BC groups demonstrated a significant decline of their presurgical value (p<0.05) which is similar to our study. From the above observations, it was seen that the level of presurgical FPSA was higher in the BC group in comparision with the other two groups. This finding corroborates with a study done by Abdulnabi H M where they have demonstrated that the presurgical mean value of FPSA in 30 breast cancer patients was 2.35±1.38 (BBD 0.667±0.368) which came down to 0.484±0.306 (p=0.0001) on 10-14 day postsurgery [23]. Moreover, the concentration of FPSA in serum decreases after surgery more significantly than TPSA, indicating that a major component of TPSA is not produced by tumour cells but more likely normal breast tissue [24–26]. This high proportion of FPSA suggests that FPSA likely originates from the tumour itself and that it undergoes a post translational modification which prevents complex formation with ACT, thereby increasing the proportion of FPSA. Studies done by Mc Cormack et al., and Zhang WM et al., also suggested that FPSA may be an inactive proenzyme, secreted by pathological tissue or a nicked form that is inactivated by endopeptidase [26,27].
In our study, the BC group was divided into grades according to AJCC staging. In grade I tumours (n=17) the mean value of TPSA and FPSA (1.813±0.230 and 1.149±0.275 respectively) was higher when compared to Grade II (n=18) and III tumours (n=15) and the difference between the groups were statistically significant (p<0.05). This is in accord with a study by Borchert GH et al., where they demonstrated that poorly differentiated carcinoma (Grade III) have serum TPSA and FPSA lower than Grade I and II tumours but the difference did not reach statistical significance [28]. Diamandis EP et al., and Yu H et al., also suggested that PSA positivity in breast cancer was significantly associated with small tumour, progesterone and androgen receptor positivity, early disease stage, younger age and lower risk of relapse describing PSA as a valuable tool for the prediction of a favourable BC prognosis and response to endocrine therapy [29,30]. This favourable prognosis of PSA in BC can be attributed to the fact that PSA might generate bioactive peptides from the BRCA1 gene product which might be growth inhibitory [30,31].
Limitation
One of the limitations of our study was the low sample size due to paucity of time . Further studies on this topic with greater sample size and newer sensitive technologies to detect even slightest presence of PSA and correlation with other established tumour markers and hormonal status is required.
Conclusion
Raised FBS in BC group suggests an association between Insulin like Growth Factors (IGF) and oestrogen on insulin level for the alteration of glucose metabolism in BC. Mean values of cholesterol and LDL were also raised in BC. This alteration of lipid profile in BC suggests that lipids might play a role in the maintenance of cellular integrity which is lost in cancer. The mean values of serum total and free PSA was significantly higher in BBD and BC group when compared with control group. In breast cancer, PSA expression was more in low grade and early tumours. Thus we can conclude that PSA can be regarded as a prognostic tool for breast cancer risk assessment and that PSA has more widespread distribution being found in many tumours and normal tissue rather than being regarded only as a marker specific to prostatic tissue. PSA can now be regarded as a ubiquitous molecule that can be synthesized and secreted by cells bearing specific steroid hormone receptors under conditions of steroidal modulation or stimulation.
Note: BBD - Benign breast disease; BC - Breast cancer; FBS - Fasting blood sugar; HDL - High density lipoprotein; LDL - Low density lipoprotein; VLDL - Very low density lipoprotein