Length of long bones is often taken as an important contributor in identification of unknown human remains. This helps in estimating one of the four elements of forensic anthropology i.e., stature of the individual [1]. The trend of estimation of stature of the individual from the length of bone started from an early period. According to the Trotter M and Glesser GC, research study in this topic started since 1888 and still now, it is the topic of interest for researchers [2]. Various studies were done on this topic among different population according to race, ethnicity and nationality. Estimation of stature from the measurement of the long bones are carried out by the Pan N in Indian population, by Steele DG and McKern TW among the prehistoric Indian skeletal remains, by Trotter M and Glesser GC among American white and Negros and by Wu L among the Chinese population [3–6]. As the numerous studies had proved that physical characteristics of human (such as length of limb and stature) could be varied according to the race and ethnicity of the individual, previous studies done among other ethnic group of population cannot be used for every group of population. Population specific studies are needed for estimating the total length of femur from its segments measurements [7].
Along with the use of proximal femoral measurements in estimating the total length of femur, it also determines the strength of femur to resist the hip fracture [8]. The physical characteristics of the bone, like bone mass, size and geometry of the proximal epiphysis of the femur allow predicting the risk for hip fractures in different populations [9]. The dimensions were found to be correlated with the type of fracture in proximal femur [8,10,11]. For example, more number of patients with intracapsular fracture were found to have higher neck length as compared to the extra capsular fracture [12]. Similarly, geometry and measurements of distal femur is important for the design of joint replacement prosthesis and fixation material. Preoperative templating for arthroplasty usually involves the contra lateral, healthy side, based on the assumption that there are no side-to-side differences [13]. People of developing countries like Nepal, who’s built, physique, habits, genetic makeup and personal life styles are different from Western civilization [14], data base regarding anthropometry of femur available for Western population cannot be applied for native Nepalese population in strict sense. So, to minimize intraoperative and postoperative complications, due to removal of extra bone for adjusting the implant, either the implants should be designed by taking into account anthropometry and biomechanics data of respective population or the orthopaedic surgeon should have an idea about the morphometry of bone [15].
From the results of previous studies it can be concluded that femur in the intact state is one of the bones with highest correlation with stature. It has also been shown to yield the best accuracy in the estimation of stature for any unidentified skeletal element [16]. Various studies were done by investigating the multiple bones of the body for potential use in stature estimation: long bones, cranial height, scapula, clavicle and os coxa and vertebra [17–19]. Regression formulae derived from major long bones are generally considered to be more accurate than those utilizing other bones of hand and foot [19]. Since, the femur is not always recovered intact in forensic cases like casualties, terrorist attack, natural disaster and motor vehicle accident; this has necessitated the derivation of regression equations for estimating the length of femur, from the fragments of femur [20]. So, the present study was conducted to derive regression equations from such fragments in Nepalese population.
Materials and Methods
This is the cross-sectional study done in the anthropometric laboratory of Human Anatomy at BP Koirala Institute of Health Science, Dharan. Study was carried out from December 2014 to October 2015. Study was designed and conducted in accordance with the ethical standards of the responsible committee (Institutional Ethical Review Committee, BPKIHS) and with the Helsinki Declaration of 1975, as revised in 2000. Ethical clearance registration number was: 229/071/072-IRC. Confidentiality of the identification data of cadavers was ensured. Source of femur bones were donated cadaveric body obtained from various region of Nepal and from the Department of Forensic Medicine, also belonging to same population. Sixty femora (30 right sided and 30 left sided) without sex distinctions were taken in consideration for the study. Sample size was calculated using following formula:

Where,
N is the total sample size, σ is the standard deviation and L is the allowable error.
From the recent study of estimating total femur length from its fragments in South Indian population, conducted by Solani S and Kulkarni R, the standard deviation (σ) of total length of femur was found to be 2.4 on the right side and 2.7 on the left side [21]. By using these values to calculate sample size provided, we keep the allowable error to 1, we get 4(2.4)2 to 4(2.7)2, which accounts for a sample size of 23 to 29 femur bones from each side, which means altogether 46 to 58 femur bone should be included in the study. Finally, it was decided to include 60 dry femora, which were present in Department of Anatomy, BPKIHS.
Bones with visible abnormalities, and loss of tissue due to manipulation were excluded. Along with Maximum Femoral Length (MFL) four proximal and four distal segmental measurements were measured [Table/Fig-1].
Descriptions of variable measured.
| Parameters | Operational definitions |
|---|
| Maximum Femoral Length (MFL) | Distance from most proximal point of head of the femur to the most distal point of medial condyle |
| Femoral Neck Length (NL) | The distance between the base of the head and the intertrochanteric line at the junction of the back of the neck with the shaft |
| Femoral Neck Circumference (NC) | Circumference of neck at the middle of NL |
| Segment 1 (Seg 1) | Most proximal point of head to the upper border of lesser trochanter. |
| Intertrochanteric Crest Length (ITC) | The most proximal point of the greater trochanter to the lowest point of the lesser trochanter |
| Depth of Medial Condyle (DMc) | The linear distance between the most anterior and the most posterior points on the medial condyle |
| Depth of Lateral Condyle (DLc) | The linear distance on the lateral condyle measured in an antero-posterior direction |
| Epicondylar Breadth (ECB) | The linear distance between the medial and the lateral epicondyles of the femur. The measurement is taken right angle to the shaft axis. |
| Segment 2 (Seg 2) | Proximal point of intercondylar fossa to most distal point of medial condyle. |
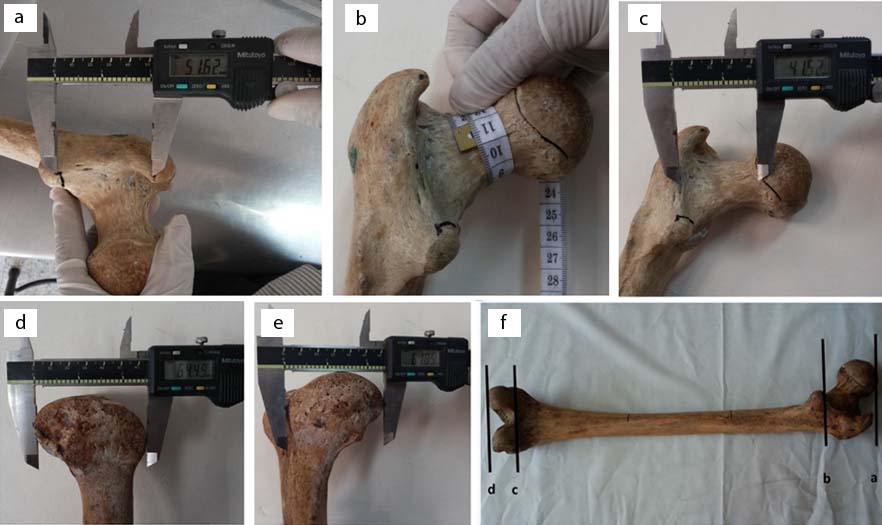
MFL was measured by the use of well calibrate osteometric board, circumference measurements were done by a plastic tape and remaining measurements were done by digital Vernier’s caliper (Mitutoyo) with precision of 1 mm [Table/Fig-2]. All measurements were recorded by the same observer twice for the consistency in measurements as suggested by Trotter M and Glesser GC [2]. Intraobserver reliability was confirmed by measuring Intraclass Correlation Coefficient (ICC) which was within range of 0.8 to 0.9 for all the measurements done. Hence, there was evidence of reproducibility between two measurements made by single person. Paired t-test was also used to compare the two measurements taken by single person at different time period. Results showed that two measurements were not very different and were reproducible without significant errors (p-value>0.05). All the measurements were taken as per the standards recommended by Singh I and Basin M [22].
a) Measurement of intertrochanteric crest length; b) Neck circumference; c) Neck length; d) Depth of lateral condyle; (e) Depth of medial condyle; f) Seg 1 (a-b) and seg 2 (c-d).
Statistical Analysis
Measured values were first entered into the Microsoft Excel (2005) then transferred to the SPSS version 11.5 for statistical analysis. To fulfill the assumptions made for using the parametric test, normality of data was tested by Kolmogorov-Smirnov test (K-S test). After the data met the normality test, descriptive statistics was done to calculate, mean, standard deviation and proportion of segmental measurements with the MFL for each side. After then inferential statistical test was done by using parametric test (unpaired t-test) to compare the value of segmental measurements between femurs of right and left side. A p-value less than 0.05 were taken as statistically significant change between two groups. Bivariate correlation (Pearson’s correlation test) was done to find out the value of coefficient of correlation (r) of segmental measurements with the MFL for each side. Finally, linear regression models for estimating the MFL from different segmental measurements were derived by using linear regression analysis.
Results
Study was done among the 60 dry femora present in Department of Anatomy, BPKIHS. Results were analyzed by calculating the statistics of individual variable between right and left side and also by combining the two sides. In every section of the result, unit of measurement is in centimeter (cm). A p-value less than 0.05 were taken as statistically significant difference. Abbreviation used in the tables and figures for the variables were as per the abbreviations given in “materials and method section”.
To fulfill the assumptions made for using the parametric test, normality of data was tested by Kolmogorov-Smirnov test (K-S test). All the parameters were found to be normally distributed because of having p-value more than 0.05 for all the variable measured [Table/Fig-3].
One sample Kolmogorov-Smirnov test to test the normality of the variables.
| Normal parametersmean | Std. deviation | Most extreme differencesabsolute | Positive | Negative | KolmogorovSmirnov Z | Asymp. Sig. (2-tailed) |
|---|
| Seg 1 | 5.93 | 0.63 | 0.173 | 0.173 | -0.085 | 1.336 | 0.056 |
| NL | 3.78 | 0.53 | 0.056 | 0.053 | -0.056 | 0.433 | 0.992 |
| NC | 9.37 | 0.75 | 0.133 | 0.083 | -0.133 | 1.034 | 0.235 |
| ITC | 5.04 | 0.70 | 0.152 | 0.152 | -0.091 | 1.178 | 0.124 |
| Seg 2 | 3.18 | 0.30 | 0.093 | 0.088 | -0.093 | 0.719 | 0.679 |
| ECB | 7.49 | 0.50 | 0.100 | 0.100 | -0.097 | 0.771 | 0.591 |
| DMc | 5.74 | 0.41 | 0.094 | 0.067 | -0.094 | 0.726 | 0.667 |
| DLc | 5.60 | 0.49 | 0.084 | 0.059 | -0.084 | 0.649 | 0.794 |
(ITC= intertrochanteric crest length, ECB= epicondylar breadth, DLc= depth of lateral condyle, NL= neck length, NC= neck circumference, Seg 1= Segment 1 and Seg 2= Segment 2, DMc= depth of medial condyle)
[Table/Fig-4] showed the mean of each segments and their proportion with the maximum femoral length. Segment 1 (Seg 1) Depth of Medial condyle (DMc) and Neck Circumference (NC) were found to have higher value in right side while Segment 2 (Seg 2), Intertrochanteric Crest Length (ITC), Epicondylar Breadth (ECB), Depth of Lateral condyle (DLc) and Neck Length (NL) were higher in left side. Even though there was difference between right and left sided measurements, but when compared between the right sided and left sided measurements by applying student t-test, there was no statistical significant difference between two groups except for the DMc with p-value of 0.022.
Descriptive statistic of all the measurement along with level of significance of mean differences between right and left side (independent student t-test).
| Variables | Combined mean (proportion) | SD | Side | Mean | SD | p-value |
|---|
| Seg 1 | 5.93 | 0.63 | Left (N=30) | 5.90 | 0.72 | 0.721 |
| Right (N=30) | 5.96 | 0.55 |
| Seg 2 | 3.18 | 0.31 | Left (N=30) | 3.18 | 0.29 | 0.921 |
| Right (N=30) | 3.17 | 0.31 |
| ITC | 5.04 | 0.71 | Left (N=30) | 5.10 | 0.74 | 0.483 |
| Right (N=30) | 4.98 | 0.66 |
| ECB | 7.49 | 0.51 | Left (N=30) | 7.51 | 0.53 | 0.768 |
| Right (N=30) | 7.47 | 0.47 |
| DMc | 5.74 | 0.41 | Left (N=30) | 5.62 | 0.46 | 0.022 |
| Right (N=30) | 5.86 | 0.32 |
| DLc | 5.60 | 0.49 | Left (N=30) | 5.71 | 0.42 | 0.093 |
| Right (N=30) | 5.49 | 0.55 |
| NL | 3.78 | 0.53 | Left (N=30) | 3.88 | 0.45 | 0.129 |
| Right (N=30) | 3.67 | 0.60 |
| NC | 9.37 | 0.74 | Left (N=30) | 9.33 | 0.75 | 0.669 |
| Right (N=30) | 9.41 | 0.76 |
(SD= Standard deviation; ITC= intertrochanteric crest length, ECB= epicondylar breadth, DMc= depth of medial condyle, DLc= depth of lateral condyle, NL= neck length, NC= neck circumference, Seg 1=Segment 1; Seg 2=Segment 2)
[Table/Fig-5] showed the correlation matrix between the various segmental measurements with MFL along with the score of significance for the correlation coefficients. All the segmental measurements had positive correlation with the MFL. Correlation was found to be statistically significant for all the measured segmental measurements. Pearson correlation coefficient was highest for Seg 1 (0.623) followed by Seg 2 (0.552), ECB (0.525), DMc (0.462), NC (0.427), NL (0.290), DLc (0.277) and ITC (0.275).
Pearson correlation matrix of all the variables with MFL along with score of significant (2-tailed).
| Seg 1 | Seg 2 | ITC | ECB | DMc | DLc | NL | NC |
|---|
| Pearson Correlation | 0.623 | 0.552 | 0.275 | 0.525 | 0.462 | 0.277 | 0.290 | 0.427 |
| Sig. (2-tailed) | 0.000 ** | 0.000 ** | 0.034 * | 0.000 ** | 0.000 ** | 0.032 * | 0.024* | 0.001 ** |
| N | 60 | 60 | 60 | 60 | 60 | 60 | 60 | 60 |
** Correlation is significant at the 0.01 level (2-tailed). * Correlation is significant at the 0.05 level (2-tailed). (ITC= intertrochanteric crest length, ECB= epicondylar breadth, DMc= depth of medial condyle, DLc= depth of lateral condyle, NL= neck length, NC= neck circumference, r= correlation coefficient, SEE= standard error of estimate, Seg 1= Segment 1 and Seg 2= segment 2)
[Table/Fig-6] showed the simple linear regression equations for the estimation of MFL (dependent variable) from each segmental measurement (independent variables) along with coefficient of correlation (R-value), coefficient of determination (value of R-square), F-value and score of significance. Equations were derived for both right and left sided femora individually for DMc only due to its significant difference between two sides. Remaining equations were derived for taking both right sided and left sided femora as single unit because of not having significant difference between two sides and also combining the both sided femora. Statistically significant regression equations (p-value<0.05) were derived for estimating the MFL from all the variables.
Simple linear regression statistics of segmental measurements as Independent variables and MFL as a dependent variable. (Statistical test applied: simple linear regression).
| Independent variables | R | R-square | Adjusted R-square | SEE | Regression equations | F-value | p-value |
|---|
| Seg 1 | 0.623 | 0.388 | 0.377 | 1.95 | MFL=27.55+2.42(Seg 1) | 36.72 | <0.001 |
| Seg 2 | 0.552 | 0.304 | 0.292 | 2.08 | MFL=27.32+4.60(Seg 5) | 25.39 | <0.001 |
| ITC | 0.275 | 0.076 | 0.060 | 2.39 | MFL= 37.01+0.97 (ITC) | 4.74 | 0.034 |
| NL | 0.290 | 0.084 | 0.068 | 2.38 | MFL=36.86+1.34 (NL) | 5.34 | 0.024 |
| ECB | 0.525 | 0.275 | 0.263 | 2.12 | MFL=22.45+2.60(ECB) | 22.05 | <0.001 |
| DLc | 0.277 | 0.077 | 0.061 | 2.39 | MFL=34.18+1.38 (DLc) | 4.82 | 0.032 |
| NC | 0.427 | 0.182 | 0.168 | 2.25 | MFL=28.71+1.41 (NC) | 12.89 | 0.001 |
| DMc | 0.462 | 0.213 | 0.200 | 2.21 | MFL=26.02+2.77(DMc) | 15.71 | <0.001 |
| DMc (Rt) | 0.543 | 0.294 | 0.269 | 2.25 | MFL=16.03+4.49(DMc) | 11.68 | 0.002 |
| DMc (Lt) | 0.381 | 0.145 | 0.114 | 2.13 | MFL=31.04+1.87(DMc) | 4.74 | 0.038 |
(MFL= maximum femoral length, ITC= intertrochanteric crest length, ECB= epicondylar breadth, DLc= depth of lateral condyle, NL= neck length, NC= neck circumference, R= correlation coefficient, SEE= standard error of estimate, Seg 1= Segment 1 and Seg 2= Segment 2, DMc= depth of medial condyle, Rt= Right side, Lt= Left side)
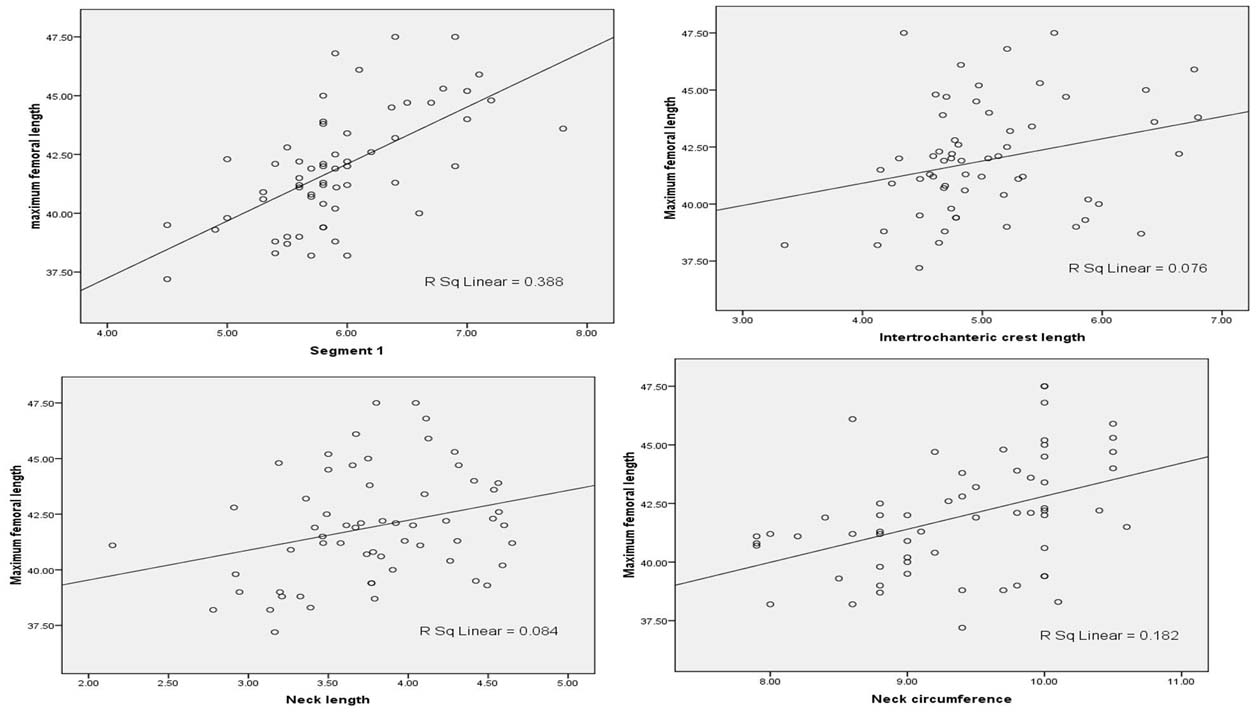
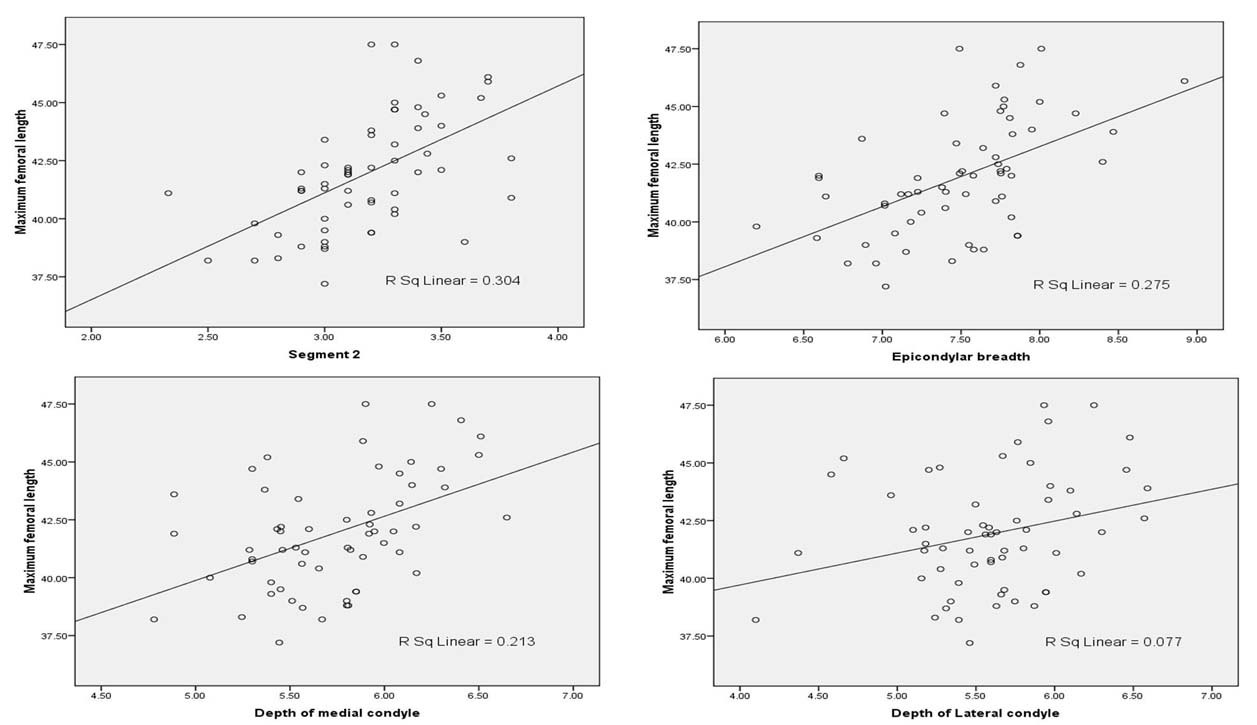
Scatter plot with segmental measurements on X axis and MFL on Y axis was shown in [Table/Fig-7,8]. All of the segmental measurements were linearly correlated with the MFL. Best fit regression lines were also shown with their coefficient of determination (R-square). Value of R-square was highest for Seg 1(0.39), followed by Seg 2 (0.30), ECB (0.27), DMc (0.21), NC (0.18), NL (0.08), DLc and ITC (0.08).
Scatter plot with best fit line with MFL on Y axis and Seg 1, ITC, NC and NL on X axis.
(MFL=maximum femoral length, Seg 1=Segment 1; ITC= intertrochanteric crest length, NL= neck length, NC= neck circumference)
Scatter plot with best fit line with MFL on Y axis and Seg2, ECB, DMc and DLc on X axis.
(MFL=maximum femoral length, Seg2= segment 2, ECB= epicondylar breadth, DMc= depth of medial condyle, DLc= depth of lateral condyle.)
When all the independent variables were taken in consideration for the estimation of MFL through stepwise methods, three regression equations were derived [Table/Fig-9]. One proximal (Seg 1) and two distal (Seg 2 and DMc) measurements were taken in regression equation. According the equations, 53% (R-square =0.53) in the variation in the MFL was due to Seg 1 and DMc and when another variable (Seg 2) was added, 55% (R-square=0.55) variation in the MFL could be explained by these segmental measurements.
Best fit regression models derived through stepwise method for the estimation of MFL from proximal and distal measurements.
| Independent variables | R | R- square | Adjusted R- square | SEE | Regression equations | F- value | p- value |
|---|
| Seg 1 | 0.62 | 0.39 | 0.38 | 1.95 | MFL= 27.55+2.42 (Seg 1) | 36.72 | <0.001 |
| Seg1 and DMc | 0.73 | 0.53 | 0.51 | 1.73 | MFL= 15.81+2.21 (Seg1) +2.27 (DMc) | 31.84 | <0.001 |
| Seg1, DMc and Seg2 | 0.76 | 0.57 | 0.55 | 1.65 | MFL= 14.39 +1.92 (Seg1) +1.63 (DMc) +2.13 (Seg2) | 25.17 | <0.001 |
(MFL= maximum femoral length, R= correlation coefficient, Seg 1= Segment 1 and Seg 2= Segment 2, DMc= depth of medial condyle)
Discussion
Present study was conducted among 60 dry femoral (30 from each side) without sex determination. Along with maximum femoral length, four proximal and four distal measurements were done. The measurements were different on right and left side; but the difference was statistically not significant except for DMc.
Measurements of ITC of this study was (5.04±0.71) cm which was lower than the study done among the Indian population (6.31 cm) by Singh I et al. ITC showed lowest correlation with the MFL, with correlation coefficient of (0.275) which was less than the study by Singh S et al., (0.58) [19]. This difference might be due to geographic and racial difference.
Mean value of NL was (3.78±0.53) cm for present study. High NL of the proximal femur is a risk factor for the causation of proximal femoral fracture. But osteoporosis also plays a major role in increasing the chance of proximal femoral fracture which is determined by Bone Mineral Density (BMD) [23]. NL was similar to the finding of study done by Mishra AK et al., among femora of Nepalese origin and lower than that of Western population [14]. NL of this study was higher than the population of Bhopal (2.61 for male and 2.23 for female), of Chilean population, (3.59 cm) of Tamil Nadu (2.84 cm) [9,24,25]. If comparison made for ‘r’, present study result had lower value than that of population of Tamil Nadu (0.47) and Bhopal (0.61).
This variation might be due to the differences in method of choosing the landmarks for measurements of NL. NL can be measured either on anterior aspect or on posterior aspect of the neck. We had measured posterior NL while other study had measured the anterior NL. NC was also slightly lower than that of Chilean population [9]. Racial differences in femoral geometry had been correlated with the difference in prevalence of hip fracture among different group of population [26].
Value of Seg 1 for present study was 5.93 cm which was shorter than that of Portuguese (7.56 cm), South Indian (8.08 cm) and European (7.21 cm). Similarly, the value of ‘r’ for Seg 1 to MFL of present study (0.62) was similar to Portuguese (0.62) and lower than other European population (0.76) [21,27,28]. Value of Seg 2 of the present study (3.18 cm) was slightly higher than that of South Indian (2.93 cm) and lower than Portuguese (3.46 cm). The coefficient of correlation for Seg 2 to the MFL was similar to the study result done among Portuguese (0.60).
The epicondylar breadth is the most frequently measured anatomic parameter of the distal femur. However, there is great variability between studies regarding the definition of measuring points as well as the measurement techniques and the type of sample. In this study mean value of ECB was (7.49±0.51) cm which was slightly lower that the study done by Terzidiz I et al., among the Caucasian dry femora [13]. Another study done among 65 dry femora of West Bengal showed the mean value of ECB as (7.16±0.56) cm which is slightly lower than the present study result [29]. There was positive correlation (r=0.52) between ECB and MFL in present study which was less than the study result of Bengali population (0.85), South African female (r=0.75), South Indian male (r=0.81) and equal to the South African male (r=0.52) [16,30].
The epicondylar width as well as the medial and lateral condylar depths of the femur are important parameters for the design of total knee prostheses [13]. DMc was more than that of DLc which was similar to the finding shown by Terzidis I et al., [13]. Since, there was significant difference between right and left sided distal femoral measurements (DMc); so distal part of femur might not be suitable for fabricating surgical template for the opposite side. Value of DMc was (5.74±0.41) cm which was less than the other study result done among Greek (5.87 cm), South African (6.45 cm for male and 5.79 cm for female) and South Indian male (6.30 cm). Similar was the pattern for correlation; value of ‘r’ for DMc in present study was 0.46 which was less than that of South African (0.71 for male and 0.62 for female) and South Indian male (0.81). Similary, value of DLc was (5.60±0.49) which was less than the other study result done among Greek (5.85 cm), South African (6.47 cm for male and 6.06 cm for female) and South Indian male (6.20 cm). Similar was the pattern for correlation; value of ‘r’ for DLc in present study was 0.28 which was less than that of South African (0.63 for male and 0.71 for female) and South Indian male (0.79) [16,30].
Limitation
This study had limitation of having smaller sample size and not considering the gender and nutritional status of the population which are the factors affecting growth and development of various body parts, so could be responsible for variations in anthropometric measurements.
Conclusion
Present study showed that proximal and distal femoral measurements were slightly different in right and left side but without statistical significance except for DMc. Each segmental measurement was positively correlated with the MFL. Highest degree of correlation was found for segmental measurement from head to the lesser trochanter. All the segmental measurements had linear relationship with the MFL. With the help of regression equation femoral length can be calculated from the segmental measurements; and then femoral length can be used to calculate the stature of the individual. If the value of ‘r’ compared among longitudinal measurements (Seg 1 and Seg 2), oblique measurements (ITC, NL), breadth measurements (ECB), anteroposterior measurements (DMc and DLC) and one circumferential measurement (NC), the correlation was higher for longitudinal measurements followed by breadth measurements, circumferential measurements and lowest for oblique measurements. The data collected may contribute in the analysis of forensic bone remains in study population and to analyze the causal factors for hip fractures. Further large scale study should be done to define the osteometric parameters in broad perspective.
(ITC= intertrochanteric crest length, ECB= epicondylar breadth, DLc= depth of lateral condyle, NL= neck length, NC= neck circumference, Seg 1= Segment 1 and Seg 2= Segment 2, DMc= depth of medial condyle)
(SD= Standard deviation; ITC= intertrochanteric crest length, ECB= epicondylar breadth, DMc= depth of medial condyle, DLc= depth of lateral condyle, NL= neck length, NC= neck circumference, Seg 1=Segment 1; Seg 2=Segment 2)
** Correlation is significant at the 0.01 level (2-tailed). * Correlation is significant at the 0.05 level (2-tailed). (ITC= intertrochanteric crest length, ECB= epicondylar breadth, DMc= depth of medial condyle, DLc= depth of lateral condyle, NL= neck length, NC= neck circumference, r= correlation coefficient, SEE= standard error of estimate, Seg 1= Segment 1 and Seg 2= segment 2)
(MFL= maximum femoral length, ITC= intertrochanteric crest length, ECB= epicondylar breadth, DLc= depth of lateral condyle, NL= neck length, NC= neck circumference, R= correlation coefficient, SEE= standard error of estimate, Seg 1= Segment 1 and Seg 2= Segment 2, DMc= depth of medial condyle, Rt= Right side, Lt= Left side)
(MFL= maximum femoral length, R= correlation coefficient, Seg 1= Segment 1 and Seg 2= Segment 2, DMc= depth of medial condyle)