HbA1C levels are not influenced by blood glucose levels alone. Studies suggest that conditions like IDA, haemolytic anaemia, alcohol ingestion, pregnancy, blood loss, uraemia may alter HbA1C levels independent of glycaemic status [4].
The relationship between iron status and HbA1C level has long been a topic of debate in the literature [5]. Few studies report that iron deficiency increases HbA1C level and intend to explain on the basis of both modification of the quaternary structure of haemoglobin and HbA1C levels in old and new red blood cells [4–7]. According to studies conducted by Kalasker V et al., there were no variation between HbA1C levels in patients with IDA and controls [5].
English E et al., reported a recent review in 2015 about the controversies, in this issue and highlighted the need for further studies in this field to confirm and elucidate the role of anaemia on HbA1C results [8].
Since only limited number of studies has been carried out in Indian population, we were prompted to conduct the current study to determine the impact of IDA on HbA1C in non diabetic population to annul the effect of glucose on HbA1C. We also analysed the variation of HbA1C according to the degree of anaemia (mild, moderate and severe).
Materials and Methods
This was a descriptive analytical cross-sectional study carried out in SRM Medical College Hospital and Research Centre, Chennai, Tamil Nadu between February 2016 to October 2016 and approved by our Institutional Ethical Committee. Totally 150 non diabetics aged >18 years (75 patients with IDA and 75 patients without IDA) were included in our study. An informed consent was obtained from all the subjects. Those having Hb <13 gm/dl in males and <12 gm/dl in females, Hct < 40% in males and <36% in females, mean corpuscular volume (MCV) <80 fl, Mean Corpuscular Haemoglobin (MCH) <26 pg/cell, Mean Corpuscular Haemoglobin Concentration (MCHC) <32 gm/dl and peripheral smear showing microcytic hypochromic picture were considered to have IDA and confirmed by their serum iron (<60 μg/dl) and ferritin levels (<15 μg/l) [9].
A total of 75 non diabetics without IDA were enrolled to serve as controls. All the laboratory parameters analysed for study group and for the control group as well.
Medical history was recorded in order to exclude DM, the patients had to have no history of DM and two FPG<126 mg/dl, performed close to the date of the complete blood count. Patients with history of chronic alcohol ingestion, kidney diseases, blood loss, haemolytic anaemia and pregnant patients were excluded from both the study and control group.
On the basis of Hb level, anaemic patients were categorized as mild anaemia (12-12.9 gm/dl for males and 11-11.9 gm/dl for females), moderate anaemia (9-11.9 gm/dl for males and 8-10.9 gm/dl for females), and severe anaemia (<9 gm/dl for males and <8 gm/dl for females).
Measurements
Hb, Hct, MCV, MCH, MCHC were measured by SYSMEX XT-1800i analyser. HbA1C measured by HPLC method using Bio-Rad D10 analyser. Plasma glucose estimated by glucose oxidase/peroxidase method, serum iron (TPTZ) and serum ferritin (Bio-Rad Quanimune Ferrin IRMA, Biorad lab).
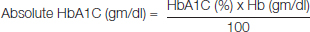
Absolute HbA1C levels were calculated from the measured HbA1C levels by using the formula [5].
Statistical Analysis
The data were analysed using SPSS version 20 and presented as mean±S.D for continuous variables. Unpaired t-test was applied for comparison of group means. Pearson’s coefficient was calculated to determine correlation between two variables. A p-value <0.05 was considered statistically significant.
Results
In this study, non diabetics with IDA had a mean HbA1C % (6.84±0.07) which was significantly higher (p < 0.05) than the non-anaemic group (5.12±0.04). Absolute HbA1C (gm/dl) in those patients with IDA and non anaemic group were 0.78±0.01 and 0.73±0.01 respectively which was also statistically significant (p <0.05) [Table/Fig-1].
Comparison of HbA1C% between anaemic and non anaemic group.
| Parameters | IDA | Non anaemic | t-test | p-value |
|---|
| HbA1C % | 6.84±0.07 | 5.12±0.04 | 22.219 | 0.0001 |
| Absolute HbA1C (gm/dl) | 0.78±0.01 | 0.73±0.01 | 5.029 | 0.0001 |
Statistical analysis: Unpaired t-test
The difference in mean Hb, Hct, MCV, MCH and MCHC between patients with IDA and non anaemic was statistically significant (p < 0.05) [Table/Fig-2].
Comparison of red cell indices.
| Parameters | IDA | Non anaemic | t-test | p-value |
|---|
| Haemoglobin (g/dl) | 11.46±0.08 | 14.31±0.16 | -16.078 | 0.0001 |
| Haematocrit (%) | 37.07±0.29 | 42.20±0.47 | -9.328 | 0.0001 |
| Mean corpuscular volume (fl) | 78.56±0.22 | 86.19±0.59 | -3.425 | 0.001 |
| Mean corpuscular haemoglobin (pg/cell) | 27.17±0.33 | 29.75±0.21 | -6.511 | 0.0001 |
| Mean corpuscular haemoglobin concentration (%) | 31.11±0.24 | 33.51±0.14 | -8.767 | 0.0001 |
Mean serum iron and ferritin levels in IDA patients were 42±0.61 μg/dl and12.09±1.21 μg/l and in non anaemic patients were 74±0.32 μg/dl and 41.06±0.43 μg/l respectively which was statistically significant (p < 0.05).
A total of 75 non-diabetics with IDA were further categorized according to degree of anaemia as shown in [Table/Fig-3]. We also analysed HbA1C level in various degree of anaemia and observed that HbA1C increases as severity of anaemia worsen which was statistically significant (p < 0.05) [Table/Fig-4].
HbA1C variation according to the degree of anaemia.
| Degree of Anaemia | Mild | Moderate | Severe |
|---|
| Total number | 40 | 30 | 5 |
Variation of HbA1C according to degree of anaemia.
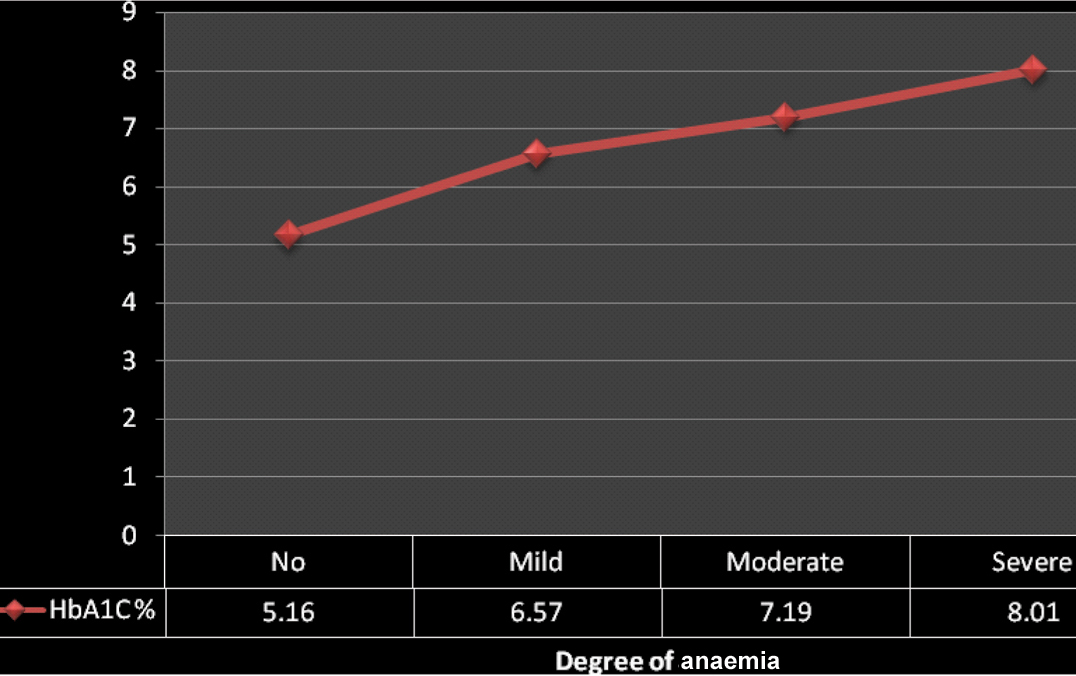
ANOVA =229.815, p =0.0001.
No anaemia to mild anaemia, t-test: -14.323, p = 0.0001
Mild anaemia to Moderate anaemia, t-test:-4.483, p = 0.0001
Moderate anaemia to Severe anaemia, t-test: -3.397, p= 0.0001
Discussion
HbA1C is the most frequently occurring fraction of haemoglobin A1. HbA1C reflects glycaemic status for the previous three months. ADA guidelines have not only considered it as the primary target for glycaemic control but also included it as a diagnostic criterion [3]. Besides blood glucose, HbA1C levels can be affected by conditions unrelated to diabetes like anaemia [7]. Approximately 1/3rd of patients with anaemia have iron deficiency [1]. We observed that Hb, Hct, and red cell indices were lower in anaemic patients, along with a microcytic hypochromic blood picture confirming IDA. This is in accordance with results of Barbieri et al., [10].
In this study, we observed higher HbA1C level in non diabetics with IDA than those without IDA which was statistically significant. This is after excluding patients with other confounding factors known to interfere with HbA1C level. This result coincides with the study results of Christy et al., who also observed that HbA1C levels were significantly higher in IDA patients and decreased after treatment with iron. The mechanisms leading to increased HbA1C levels in IDA were not clear [4].
The proposed theories for increased HbA1C levels in IDA were: a) Alteration of quaternary structure of haemoglobin leading to more rapid glycation of globin chain [5,11]; b) Decrease in the Hb concentration might lead to an increase in the glycated fraction at a constant glucose level, because HbA1C is measured as a percentage of total Haemoglobin A [6]; c) In IDA, reduced red cell production leads to a higher average age of circulating erythrocytes and therefore, increased HbA1C levels [5].
Our study results are also consistent with the study done by El-Agouza I et al., who reported that a decline in the Hb level might lead to increase in the glycated fraction at a fixed glucose level, because HbA1C is measured as a percentage of total Hb [6]. Similar results were also reported by Coban E et al., and Kim C et al., [12,13].
Coban et al., showed a very large difference between HbA1C levels in non diabetic patients with and without IDA [12].
Several other studies done before also showed similar results as our present study [6,11,12,14] [Table/Fig-5].
Comparison of present study HbA1C levels with previous studies having similar results.
| Study | Year | Number screened | IDA | Non anaemic | Significance |
|---|
| El-Agouza I et al., [6] | 2002 | 81 | 6.1±0.6 | 5.2±0.4 | p < 0.05 |
| Coban E et al., [12] | 2004 | 100 | 7.4±0.8 | 5.9±0.5 | p < 0.05 |
| Shanthi B et al., [11] | 2013 | 100 | 7.6±0.5 | 5.5±0.8 | p < 0.05 |
| Silva JF et al., [14] | 2016 | 122 | 5.6±0.4 | 5.3±0.4 | p < 0.05 |
| Present study | 2017 | 150 | 6.8±0.07 | 5.1±0.04 | p < 0.05 |
Studies by Ford ES et al., reported no significant difference in mean HbA1C concentration according to the IDA status as well as before and after iron treatment [15]. Also, Saudek CD et al., suggested that red cell age was unlikely to be a significant factor in explaining the changes in HbA1C levels during the treatment of IDA and believed that the reported differences in HbA1C concentrations before and after iron supplementation were due to differences in the laboratory methods used for measuring HbA1C [16].
Sinha et al., and few other studies contradicts with our results reporting that HbA1C levels are lowered in IDA [5,7,15] [Table/Fig-6].
Previous studies with contradicting HbA1C results from the present study.
| Study | Year | Number screened | IDA | Non anaemic | Significance |
|---|
| Ford ES et al., [15] | 2011 | 8296 | 5.5±0.1 | 5.4±0.2 | p > 0.05 |
| Sinha N et al., [7] | 2012 | 100 | 4.6±0.6 | 5.5±0.6 | p > 0.05 |
| Kalasker V et al., [5] | 2014 | 80 | 5.9±0.4 | 6.5±0.3 | p > 0.05 |
Ferritin is a storage form of iron, and it reflects the true iron status [1]. In our study, serum ferritin as well as serum iron level was indirectly proportional to HbA1C. As explained previously, in IDA, ferritin is decreased with increase in the red cell life span which is associated with increased HbA1C. This goes in hand with other study results of Shanthi B et al., and Raj S et al., [11,17].
We also analysed HbA1C results in different degrees of anaemia and found that HbA1C level increases as severity of anaemia worsens. This result of ours was in accordance with the results of Silva JF et al., [14] [Table/Fig-7].
Comparison of study results showing HbA1C variation according to the degree of anaemia.
| Study | Year | Number screened | Degree of Anaemia | Significance |
|---|
| No | Mild | Moderate | Severe |
|---|
| Silva JF et al., [14] | 2016 | 122 | 5.3±0.40 | 5.5±0.40 | 5.6±0.40 | 5.7±0.40 | p < 0.05 |
| Present study | 2017 | 150 | 5.1±0.04 | 6.5±0.09 | 7.1±0.11 | 8.0±0.01 | p < 0.05 |
Limitation
Few limitations of this study were small sample size and with this cross-sectional design, we couldn’t follow up after iron therapy and the mechanism by which anaemia affects HbA1C was not evaluated. Also, it should be mentioned that it was performed in a group of patients without DM and the impact of anaemia on HbA1C levels may be greater and clinically relevant in patients with DM, especially in the presence of poor metabolic control.
Conclusion
In this study, we observed a positive correlation between IDA and elevated HbA1C level in non diabetic population. HbA1C increases with severity of anaemia. This spurious elevation of HbA1C in iron depletion leads to over or under diagnosis of diabetes at the cut off point (6.5%). Thereby, this study insists on the utter importance to exclude IDA by iron studies and to correct it before any diagnostic or therapeutic decision is made based solely on HbA1C level.
Statistical analysis: Unpaired t-test