Portal vein drains the blood from the abdominal part of the alimentary tract except the lower part of rectum and anal canal as well as the spleen, pancreas, and gall bladder [1]. It forms vital anastomoses with oesophageal, rectal venous plexus and superficial veins of the abdomen. Portal venous blood has slightly higher pressure (5-10 mmHg) than systemic veins. Ailments affecting the portal venous system usually appear as portal hypertension [2]. This leads to broadening of extra hepatic and intrahepatic portal vessels and formation of spontaneous portosystemic collateral channels [3].
USG is an effective diagnostic tool in the diagnosis and follow up of patients with portal vein abnormalities [4]. Yet radiological assessment of PVD vis-à-vis USG finds rare mention in available literature in North Indian population. It is reported only in Maharashtra [5] Rajasthan [6] and North East India [7] where mean diameter is found to be 9.20 mm,10.5 mm and 8.83 mm respectively. There are some recent studies in the Iranian region [8] which have parallel findings and few deviations from the present study which include those in Ethiopian [9] and Chinese population [10]. An effort was also made to find correlation with age and sex. Gender linked assessment of diameter in many populations across world showed results in which PVD in males was greater than PVD females [7,8,11,12] except in few studies [9,13–15]. Correlation of PVD with age showed a proportionate trend between the two in few studies [9,13–16] whereas few others revealed absence of any such association [7]. Thus, the possibility of association of PVD with age and gender and its variability from one population to other cannot be underestimated. Hence, the current study was undertaken to establish correlation between PVD with age and gender in local (North Indian) population.
Materials and Methods
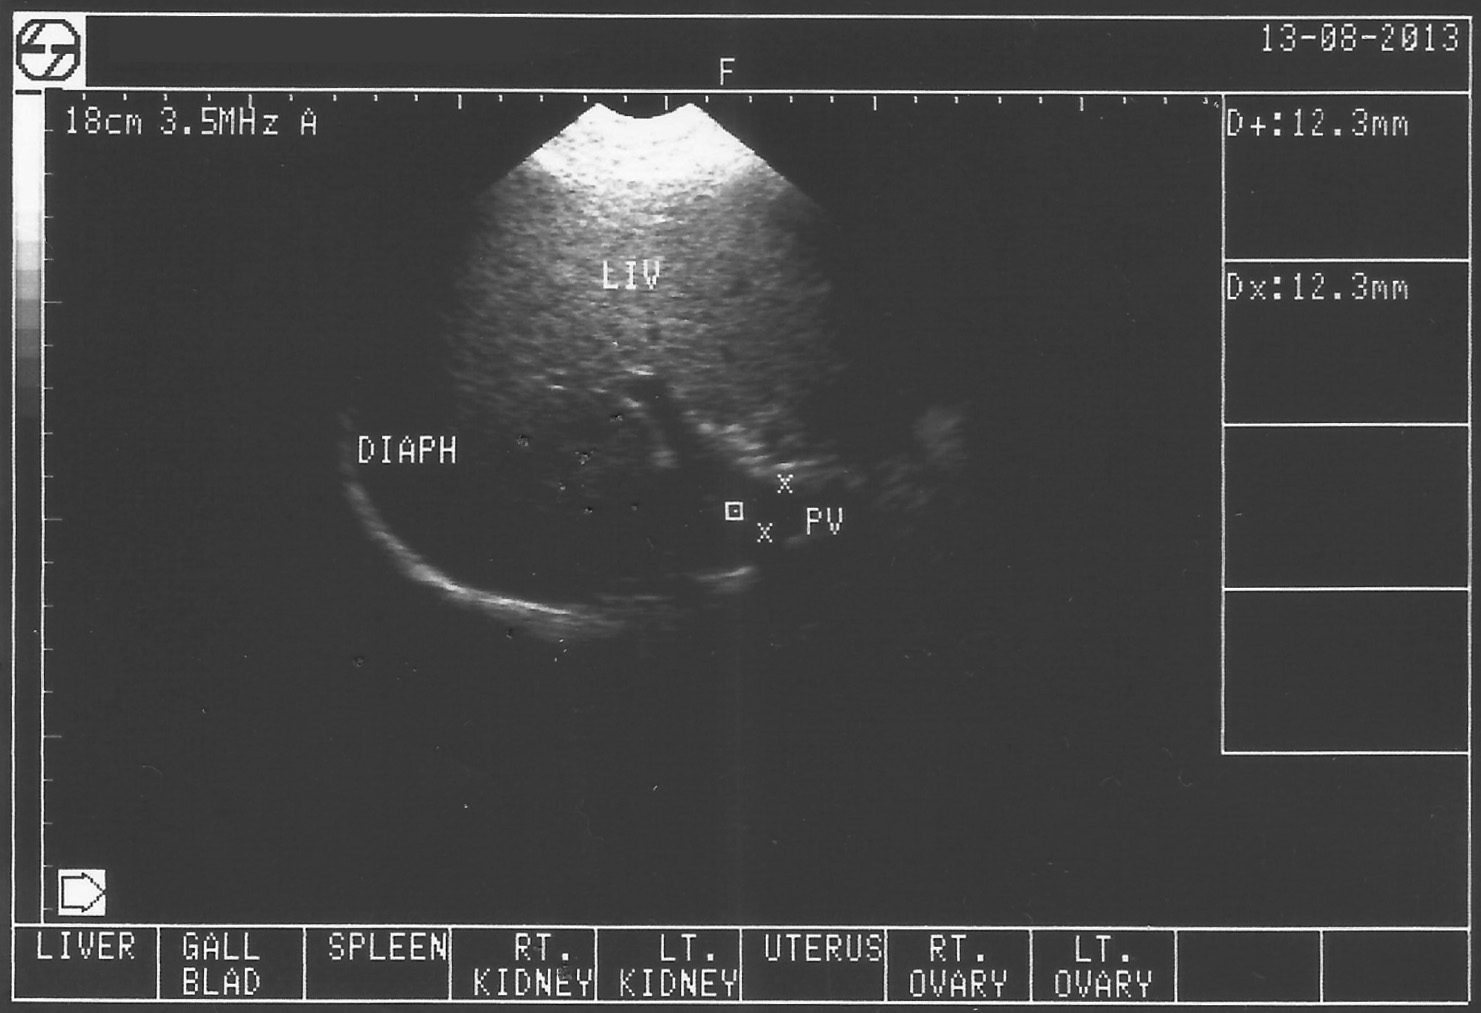
The present prospective observational study was conducted in Department of Anatomy at King George’s Medical College, Lucknow, Uttar Pradesh, India, from January 2013 to November 2013. The study included 300 subjects (M=198 and F=102) who were young healthy adults belonging to Eastern province of Uttar Pradesh region. Subjects with history of infective hepatitis, jaundice, blood transfusion, haematemesis, malena, confusion, forgetfulness, schistosomiasis, presence of lower limb oedema, spider nevi, and caput medusa were excluded. After obtaining consent and proper ethical clearance, all the subjects between 18-29 years of age were picked at random from the medical students, residents and employees working in the Department of Anatomy and were assessed in the morning after an overnight fasting in supine position. For measurement of portal vein diameter, a 3.5 MHZ transducer was placed transversely at epigastric region with slight adjustment. When visualization was optimum, measurement of the portal vein diameter was taken in quiet respiration just before its entry into the liver. Measurements were obtained lumen to lumen and in mm [Table/Fig-1].
USG plate showing measurement of portal vein diameter.
LIV- Liver, PV- Portal vein, DIAPH- Diaphragm
The demographic profile of the subject enrolled in the study has been shown in [Table/Fig-2].
Demographic characteristics of study subjects.
| Characteristic | No. of subjects | % | Male (n=198)66 % | Female (n=102)34% |
|---|
| No. | % | No | % |
|---|
| ≤20 Years | 133 | 44.3 | 66 | 33.33 | 67 | 65.7 |
| 21-25 Years | 128 | 42.7 | 110 | 55.56 | 18 | 17.6 |
| 26-30 Years | 39 | 13.0 | 22 | 11.11 | 17 | 16.7 |
| Mean Age±SD (Range) | 21.70±2.81(18-30) | 21.97±2.51(18-29) | 21.16±3.25(18-30) |
| χ2=40.17 (df=2); p<0.001 |
Statistical Analysis
Statistical analysis was done through SPSS (Statistical Package for Social Sciences) Version 15.0 statistical analysis software using Students t-test for independent groups and ANOVA.
Results
PVD measurements ranged from 7.0 to 12.6 mm. Mean PVD measurement, standard deviation and median value were 9.495, 1.03 and 9.40 mm respectively. After trimming the 5% of terminal data the normative range representing 95% of study population could be proposed between 9.38 and 9.61.
Association Between Gender and PVD
Males had significantly higher mean PVD values (9.70±1.02 mm) as compared to females (9.10±0.94 mm) [Table/Fig-3].
Association between gender and PVD measurements.
| SN | Gender | N | Mean PVD | SD | Min | Max | 95%Confidence intervals | Difference | Statistical Significance |
|---|
| Lower | Upper | Mean | SE | | |
|---|
| 1. | Male | 198 | 9.70 | 1.02 | 7.00 | 12.60 | 9.55 | 9.84 | 0.59 | 0.12 | 4.879 | <0.001 |
| 2. | Female | 102 | 9.10 | 0.94 | 7.30 | 11.50 | 8.92 | 9.29 |
t=4.879; p<0.001
Association Between Age and PVD
Mean PVD was maximum in age group 21-25 years and minimum in age group 26-30 years. Statistically, a significant difference in mean PVD among different age groups was observed (F=3.328; p=0.037). On evaluating the data further, mean difference between age group 21-25 years and 26-30 years was found to be maximum (0.46±0.18) while the same between ≤20 years and 21-25 years was found to be minimum (0.20±0.13). Statistically, the difference was found to be significant only for 21-25 and 26-30 years age groups (p=0.013) [Table/Fig-4].
Comparison of mean PVD for different age group.
| SN | Age Group (yrs) | Total | Mean | Mean Difference | Statistical Significance |
|---|
| SE | “p” |
|---|
| 1. | ≤20 | 133 | 9.44±1.06 | -0.20 | 0.13 | 0.128 |
| 2. | 21-25 | 128 | 9.64±1.08 | 0.26 | 0.18 | 0.151 |
| 3. | 26-30 | 39 | 9.18±0.66 | 0.46 | 0.18 | 0.013 |
The pattern of differences in mean PVD values suggested existence of a non-linear association between PVD values and age.
For all the age groups males had significantly larger mean PVD (p<0.05) but within gender no significant effect on mean PVD was observed for increasing age (p>0.05). The correlation between age and portal vein diameter was inverse and weak in nature (r<0.3) for both the genders and was statistically significant only among females (p=0.018). Proportionally, there was a significant difference in gender wise distribution of volunteers in two groups with females being confined to lower age group only [Table/Fig-5].
Comparison of mean PVD between two genders for different age group.
| SN | Age group (yrs) | Males | Females | Difference | Statistical Significance |
|---|
| N | Mean±SD | N | Mean±SD | Mean | SE | “t” | “p” |
|---|
| 1. | ≤20 | 66 | 9.64±1.08 | 67 | 9.25±1.00 | 0.39 | 0.18 | 2.157 | 0.033 |
| 2. | 21-25 | 110 | 9.77±1.06 | 18 | 8.89±0.90 | 0.88 | 0.23 | 3.749 | 0.001 |
| 3. | 26-30 | 22 | 9.51±0.51 | 17 | 8.77±0.60 | 0.81 | 0.18 | 4.590 | <0.001 |
| Among age group differences (ANOVA) | F=0.209; p=0.466(r=-0.234; p=0.018) | Male vs female proportional representation in different age groups χ2=40.17 (df=2); p<0.001 |
Discussion
Defining a normal range of portal vein calibre for a given subset of population is essential as portal hypertension can be identified even before it is clinically manifested by measuring its diameter. In late phase of portal hypertension, the diameter measurement is not reliable due to the development of portosystemic shunts which deflates the pressure in portal vein. An affirmative correlation is seen between the severity of portal hypertension and sonographically measured PVD [17].
Normally PVD varies between 7 mm to 15 mm [18]. Present cross-sectional study concluded the mean PVD to be 9.49±1.03 mm whereas, studies conducted by Khandare V et al., Goyal AK et al., and Saha N et al., in Maharashtrian, Rajasthani and North eastern population was 9.20±1.29 in 103 subjects, 10.5±1.29 in 72 subjects and 8.83±2.12 respectively [5–7].
On comparing the findings of the present study with the studies done in non-Indian population [Table/Fig-6] [8–10,12,14,15,19–23], irrespective of different races, present observations were approximately matching with the findings of Yazdi HR and Sotoudeh H, Arjmend SA et al., Ongoiba N et al., and Adibi A and Givichian B who observed a mean portal vein diameter of 9.6±1.9, 9.16±2.58, 9.36±1.65 and 9.75±1.25 mm respectively [8,12,20,23]. It is clear that PVD varies among different populations. Therefore, regional variations should be borne in mind while diagnosing cases of portal hypertension.
Comparison of PVD from various parts of the world [8–10, 12, 14, 15, 19–23].
| Author | Year | Countries/Continent | Sample Size | Diameter (mm) |
|---|
| Arjmend SA et al., [12] | 2001 | Iran | 43 | 9.60 |
| Tasu JP et al., [19] | 2002 | - | 30 | 11.0 |
| Ongoiba N et al., [20] | 2003 | Africa | 60 | 9.16 |
| Yazdi HR and Kalilian MR [21] | 2005 | Iran | 36 | 8.9 |
| Chuo LS et al., [10] | 2005 | Malaysia, China, India | 48 | 14.5 |
| Sudhamshu KC [22] | 2006 | Japan | 60 | 8.9 |
| Yazdi HR and Sotoudeh H [8] | 2006 | Iran | 37 | 9.36 |
| Adibi A and Givechian B [23] | 2007 | Iran | 375 | 9.75 |
| Anakwue AC [15] | 2009 | Nigerian | 200 | 11.4 |
| Hawaz Y et al., [9] | 2012 | Ethopia | 502 | 7.9 |
| Sidduiqui TR et al., [14] | 2014 | Pakistan | 459 | 9 |
| Present study | | India | 300 | 9.5 |
In the present study male showed a significantly higher mean PVD (9.70±1.02 mm) as compared to females (9.10±0.94). Findings of our study resonates with that of Saha N et al., Yazdi HR et al., Gupta E et al., and Arjmend SA et al., who also supported a higher dimensions of portal vein in males [7,8,11,12]. Possibly females show lesser degree of growth in comparison to their male counterparts therefore their body organs are also of smaller size. However, few authors [9,13–15] denied any significant difference in PVD of two genders.
While reviewing literature for gender differences in PVD, it was noticed that sample size was major predictor for determining mean values; therefore, properly designed studies are required.
Present study depicted a non-linear association between age of each gender and portal vein diameter as in first two groups there was an increase in portal vein diameter with increasing age whereas in the third group it decreased [Table/Fig-4,5]. This can be attributed to less number of subjects in the third group; therefore the data of this group may be comparatively less reliable. Few authors [13,14] reported a statistically significant positive correlation between age and PVD whereas few others [9,15] though observed an increase in diameter with age but this increment was not statistically significant. However studies conducted on children by Ghosh T et al., EL Sharkawy E et al., and Lopez BAM et al., observed a statistically significant increase in PVD with age [13,24,25]. Therefore, from the present study and available literature it may be concluded that portal vein diameter increases proportionally with age from childhood till adolescent whereas increase thereafter is not significant.
Limitation
In the present study however difference in the age of groups did not include extremes, therefore adequate correlation between age and PVD was beyond the scope of this study.
Conclusion
Variability in results of earlier studies dealing with portal vein measurements necessitates the need for establishing local standard values. In the given subset of young adults mean PVD was (9.49±1.03 mm). In males mean portal vein diameter was observed to be higher (9.70±1.02 mm) as compared to females (9.10±0.94 mm). The information will be helpful in prompt diagnosis and management of portal hypertension.