Diabetes Mellitus (DM) is a syndrome characterized by chronic hyperglycaemia and disturbances in carbohydrate, fat and protein metabolism, and occurs due to absolute and relative deficiency of insulin [1]. Type I DM is insulin dependent and Type II is non-insulin dependent, with Type II being more common. Type II DM is associated with other medical disorders such as dyslipidaemia, obesity and hypertension, together known as metabolic syndrome or syndrome X [2].
Framingham Heart Study revealed marked increase in Coronary Artery Disease (CAD) in diabetic patients and dyslipidaemia as one of the major risk factor. In DM most common pattern of dyslipidaemia is increased triglycerides and decreased HDL levels [3].
Antidiabetic drugs have favourable effect on lipid profile but the effect may be selective or extent may be insufficient, mandating additional hypolipidaemic therapy. With progression of disease more drugs may need to be added to control Blood Sugar Level (BSL) and dyslipidaemia thus enhancing the possibility of drug interactions and adverse reactions. With such background, any drug with favourable effect on BSL as well as other comorbidities is acceptable. However, very few drugs have beneficial effects on blood sugar levels and lipid profile. Omega-3 fatty acids are believed to have these beneficial effects.
Omega-3 fatty acids are essential fatty acids found in certain fish and some vegetables. They are necessary for normal growth and development. Various studies have been reported that omega-3 fatty acids reduce plasma triglycerides, and increase HDL. It has also been reported to inhibit platelet aggregation, improve endothelial function, reduce oxidative stress and act as a potent anti-inflammatory agent [4]. The present study was undertaken to evaluate the effect of omega-3 fatty acids supplementation in diabetic dyslipidaemic patients on glycaemic control and lipid parameters.
Materials and Methods
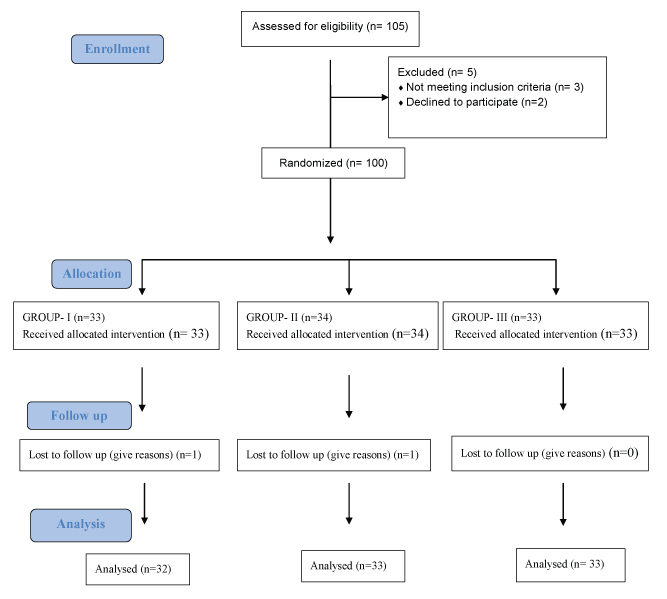
This study was prospective, single blind, randomized comparative trial carried out at an Endocrinology Department after obtaining approval by the Institutional Ethics Committee. After taking informed consent from all the patients, 105 newly diagnosed diabetes mellitus patients only on metformin treatment were included while patients on additional antidiabetic, hypolipidaemic, anti-inflammatory drugs or with systemic diseases like hypertension, systemic inflammatory diseases were excluded from the study. Patients with known allergy to fish or fish products were excluded.
After Enrollment Patients were Randomized into three Groups
Group I - Tab. Metformin 500 mg twice daily and placebo.
Group II -Tab. Metformin 500 mg twice daily and Capsule omega-3 fatty acids 1 g once daily.
Group III –Tab. Metformin 500 mg twice daily and Capsule omega-3 fatty acid 1 g twice daily.
Duration of study was one year. Patients were followed up at six and 12 weeks for detailed clinical and biochemical examinations. Subjective symptoms such as nausea, vomiting were assessed by questioning. Laboratory investigations such as fasting and postprandial blood glucose level, glycosylated haemoglobin (HbA1C) and lipid profile were done on 0 day, six weeks and 12 weeks.
Statistical Analysis
Qualitative data such as sex, patient’s habits were analyzed by using chi-square test. Data on adverse events was analyzed by using chi-square test. Quantitative data analysis was carried out by using ANOVA. The p-value <0.05 was taken as significant and p< 0.001 was taken as highly significant.
Results
In 2013, a total of 105 patients were enrolled and randomized into three groups [Table/Fig-1]. Group I received Tab. Metformin 500 mg BD with placebo, while Group II and III received Tab. Metformin 500 mg BD along with 1 g and 2 g omega-3 fatty acids respectively for 12 weeks duration. [Table/Fig-2] reveals that the mean of age, weight and height of participants in different groups are significantly not different. In Group II and III though it appears there is a decrease in the fasting and postprandial sugar levels at sixth and 12th week as compared to group I, but statistically it is not significant (p>0.05) [Table/Fig-3]. There is no effect of omega-3 fatty acids on the mean glycosylated haemoglobin level throughout the duration of the study period (p>0.05) [Table/Fig-4].
Randomization of patients in three groups each receiving treatment as mentioned.
Demography of participants.
| Criteria | | Group I | Group II | Group III | p-value |
|---|
| Age (years) | Mean±S.D | 51±4.88 | 51.29±5.15 | 51.44±5.24 | >0.05 |
| Range | 45-57 | 45-62 | 43-59 |
| Weight (kg) | Mean±S.D | 77.64±7.49 | 78.23±6.87 | 78.33±6.27 | >0.05 |
| Height (m) | Mean±S.D | 1.63±0.13 | 1.7±0.14 | 1.65±0.09 | >0.05 |
| Habits | Alcohol | 3(15%) | 4(20%) | 3(15%) | >0.05 |
| Smoking | 2 (10%) | 3(15%) | 4(20%) | >0.05 |
Effect on mean fasting (F) blood sugar level and post-prandial (PP) in (mg/dl) across treatment groups.
| Sr. No. | Duration | Group I Mean±S.D | Group II Mean±S.D | Group III Mean±S.D |
|---|
| F | PP | F | PP | F | PP |
|---|
| 1. | 0 day | 149.9±5.94 | 184±8.25 | 148.6±6.70 | 183.4±7.41 | 149.5±6.75 | 185.4±6.3 |
| 2. | 6 weeks | 115.7±7.12 | 148±11.3 | 112.17±9.83 | 147.05±10.43 | 109.8±8.58 | 145±5.01 |
| 3. | 12weeks | 105±7.62 | 143±11.6 | 104.52±7.07 | 141.52±8.31 | 102±8.62 | 138±7.45 |
Effect on glycosylated HbA1C across treatment groups.
| Group | Parameters | 0 DayMean±S.D | 12 weeksMean±S.D | p-value |
|---|
| Group I | Glycosylated Hb | 7.76±0.511 | 7.66±0.513 | >0.05 |
| Group II | Glycosylated Hb | 7.74±0.50 | 7.47±0.54 | >0.05 |
| Group III | Glycosylated Hb | 7.76±0.49 | 7.66±0.51 | >0.05 |
Mean triglyceride level on day 0 for Group I was 147.67±18.57 mg/dl and at sixth and 12 weeks it was 146.24±18.7and 145.8±19.86 mg/dl respectively [Table/Fig-5]. In 1 g of omega-3 fatty acids treated (Group II) mean triglyceride level on day 0 was 144.59±14.18 mg/dl and at 6 and 12 weeks treatment it was 111±13.8 and 101±13.31 mg/dl respectively which is statistically significant [Table/Fig-6]. In 2 g of omega-3 fatty acids treated (Group III) mean triglyceride level on day 0 was 144.83±22.17 mg/dl this level significantly decreased to 104±18.8 mg/dl at six weeks and 86±17.46 mg/dl at 12 weeks [Table/Fig-7]. As compared to placebo, both 1 g and 2 g of omega-3 fatty acids significantly reduced triglyceride levels at six and 12 weeks of treatment. This triglyceride lowering effect was additional with 2 g of omega-3 fatty acids at 12 weeks compared to placebo treated group (p< 0.001) [Table/Fig-8].
Mean triglycerides, total cholesterol, HDL and LDL in (mg /dl) after six and 12 weeks of treatment in Group I (metformin and placebo).
| Sr. No. | Parameters | 0 DayMean±S.D | 6 weeksMean±S.D | 12 weeksMean±S.D | p-value |
|---|
| 1. | Triglycerides | 147.67±18.57 | 146.24±18.7 | 145.8±19.86 | >0.05 |
| 2. | Total Cholesterol | 197.18±23.90 | 196±23.6 | 194.8±23.82 | >0.05 |
| 3. | HDL | 45.82±3.52 | 45.6±3.78 | 46.02±4.26 | >0.05 |
| 4. | LDL | 103.91±14.71 | NA | 103.04±14.31 | >0.05 |
Mean triglycerides, total cholesterol, HDL and LDL in (mg /dl) after 6 and 12 weeks of treatment in Group II (metformin and 1 gm omega-3 fatty acids).
| Sr. No. | Parameters | 0 DayMean±S.D | 6 weeksMean±S.D | 12 weeksMean±S.D | p-value |
|---|
| 1. | Triglycerides | 144.59±14.18 | 111±13.28 | 101±13.31 | <0.05 * |
| 2. | Total Cholesterol | 199.52±29.67 | 195.53±29.40 | 193.58±29.88 | >0.05 |
| 3. | HDL | 46.82±6.91 | 47.9±6.41 | 48.60±6.46 | >0.05 |
| 4. | LDL | 106.17±10.40 | NA | 105.84±7.74 | >0.05 |
* Significant
Mean triglycerides, total cholesterol, HDL and LDL in (mg/dl) after six and 12 weeks of treatment in Group III (metformin and 2 g omega-3 fatty acids).
| Sr. No. | Parameters | 0 DayMean±S.D | 6 weeksMean±S.D | 12 weeksMean±S.D | p-value |
|---|
| 1. | Triglycerides | 144.83±22.17 | 104±18.8 | 86±17.46 | <0.05 * |
| 2. | TotalCholesterol | 201.16±32.90 | 194.44±32.76 | 192.5±32.04 | >0.05 |
| 3. | HDL | 47±3.51 | 49.2±4.36 | 50.14±4.46 | >0.05 |
| 4. | LDL | 106.33±19.57 | NA | 107.06±19.60 | >0.05 |
* Significant
Effect on mean triglycerides (TG), total cholesterol (TC) and HDL in (mg/dl) across treatment groups.
| Sr No | Duration | Group I Mean±S.D | Group II Mean±S.D | Group III Mean±S.D |
|---|
| | T.G. | T.C. | HDL | T.G. | T.C. | HDL | T.G. | T.C. | HDL |
| 1 | 0 day | 147.67±18.57 | 197.18±23.9 | 45.82±3.52 | 144.59±14.18 | 199.52±32.30 | 46.82±6.91 | 144.8±22.17 | 201.16±32.90 | 47±3.51 |
| 2 | 6 weeks | 146.24±18.7 | 196±23.6 | 45.6±3.78 | 111±3.28 | 195.53±29.40 | 47.9±6.41 | 104±18.8 | 194.44±32.76 | 49.2±4.36 |
| 3 | 12 weeks | 145.8±19.86 | 194.8±23.8 | 46.02±4.26 | 101±13.31 | 193.58±29.88 | 48.60±6.46 | 86±17.46 | 192.5±32.04 | 50.14±4.46 |
On the other hand, effect of 1 g and 2 g of omega-3 fatty acids on mean total cholesterol, HDL and Tryglyceride (TG) level as compared to placebo at the end of study was not significant (p>0.05) [Table/Fig-8].
Adverse Drug Reactions
The adverse effects of metformin are metallic taste, anorexia, nausea, vomiting, diarrhoea, abdominal discomfort and rarely lactic acidosis. In the present study, adverse effects observed were- in Group I metallic taste (n=1), anorexia (n=1), in Group II metallic taste (n=1) and Group III metallic taste (n=1). The difference is not statistically significant (p>0.05). No other adverse effect was observed. Omega-3 fatty acids neither showed any adverse drug reaction nor did it interfere with the efficacy of metformin.
Discussion
Diabetic dyslipidaemia is a condition characterized by hypertriglyceridaemia along with elevated VLDL remnants and reduced HDL-C levels in blood. Additionally small-dense LDL particles, which are derived from LDL-cholesterol particles, are major predisposing factor for various macrovascular complications [5]. Omega-3 fatty acids is FDA approved treatment for hypertriglyceridaemia [6].
Percentage reduction in fasting and postprandial BSL in both omega-3 fatty acids treated groups was not significant as compared with Group I [Table/Fig-3]. Friday KE and Childs MT et al., show significant rise of plasma blood sugar level after supplementation of omega-3 fatty acids [7]. This could be possibly because of the high dose used in the study i.e., 8 g/day. Omega-3 fatty acids supplementation in high doses may increase plasma blood sugar level by increasing glycerol gluconeogenesis, which could contribute to deterioration of glycaemic control during long-term treatment [8].
Also we didn’t see any effect of omega-3 fatty acids on the mean glycosylated haemoglobin level throughout our study period [Table/Fig-4]. Similar findings were shown by Woodman RJ et al., [9].
Omega-3 fatty acids has significantly reduced triglyceride level as compared to placebo group, in which Group III has shown stronger association with reduction of triglyceride level as compared to Group II (p<0.001) [Table/Fig-8]. Similar findings were shown by Montori VM et al., Friedberg C et al., and Hartweg J et al., in diabetic patients [10–12]. Two main mechanisms have been proposed to explain the triglyceride lowering effects of omega-3 fatty acids. Firstly, the inhibition of acyl coA1, 2 diacylglycerol acyl transferase by omega-3 fatty acids may reduce the hepatic synthesis of triglycerides. Eicosapentaenoic Acid (EPA) and Docosahexaenoic Acid (DHA) have high affinity for the enzymes involved in triglyceride synthesis, but are poor substrates for these enzymes. Thus, the esterification and release of other fatty acids is prevented. Secondly, omega-3 fatty acids have high affinity for peroxisome proliferator activated receptor subtypes, thereby increasing hepatic peroxisomal β-oxidation and up regulating fatty acids metabolism in the liver. This reduces the quantity of free fatty acids available for triglyceride synthesis, and reduces triglyceride levels; secretion of triglyceride rich in Very Low Density Lipoprotein (VLDL) is also inhibited. Omega-3 fatty acids also affect other nuclear receptors involved in the modulation of triglyceride levels e.g., liver X receptor, hepatocyte nuclear factor 4α and farnesol X receptor and may increase the removal of triglycerides from circulating VLDL and chylomicron particles via upregulation of enzymes, such as lipoprotein lipase [13]. The main effect of dietary omega-3 fatty acids on plasma lipids and lipoproteins in general is a reduction in plasma triglycerides, by 20-50% in healthy subjects and even more in subjects with hypertriglyceridaemia in diabetic patients. The effect is dose dependent but generally substantial with intake of omega-3 fatty acids above 2-3 g/day [14].
But there was no significant effect of omega-3 fatty acids on serum total cholesterol, HDL and LDL level (p>0.05). For cholesterol, similar findings were shown by Friedberg C et al., and Hendra TJ [11,15].
For HDL, similar findings were shown by Woodman RJ et al., Bork man M et al., and Schectman G et al., [9,16,17]. For LDL, similar findings were shown by Goh YK et al., and Peterson et al., [18,19].
In another study conducted in patients of type II diabetes mellitus it was seen that for every increase of 1 g/day of omega-3 fatty acids there was a decrease in triglyceride levels by 0.36 mmol/L but this was also accompanied by increase in LDL cholesterol level by 0.14 mmol/L [20].
In the present study omega-3 fatty acids was given in the dose of 1 g and 2 g/day since the triglyceride levels at baseline were within normal limits. The total EPA and DHA dose recommended for triglyceride lowering is approximately 2–4 g/day. In patients with triglyceride levels above 500 mg/dl, approximately 4 g/day of EPA and DHA reduce triglyceride levels by 45% and VLDL cholesterol levels by more than 50% [21].
Omega-3 fatty acids has also shown some efficacy in treating neurological disorders, inflammatory conditions, cancers, ophthalmological disorders but evidence is weak compared to efficacy in cardiac conditions [22]. Omega-3 fatty acids may boost the effectiveness of statins on lipid profile and decrease the risk of coronary vascular disease [23]. It also has shown to increase insulin sensitivity in rodents but more studies in humans are encouraged as earlier showed no beneficial effect of omega-3 fatty acids in Type 2 DM [24].
Limitation
This study has few limitations. First, the sample size was small so results cannot be generalized. Secondly duration of study was short. Despite that, during the short duration of 12 weeks treatment, omega-3 fatty acids did not interfere adversely with the efficacy of metformin neither were any adverse effects observed. Though omega-3 fatty acids did not reduce blood sugar level significantly, it affected atherogenic index favourably at 12 weeks of treatment. On this background it is possible to plan a trial on a much bigger sample size for a prolong duration as an adjuvant treatment in Type II diabetes mellitus to determine the true effect of omega-3 fatty acids on DM.
Conclusion
We have observed that omega-3 fatty acid does not have any effect on fasting and postprandial blood glucose level and glycosylated haemoglobin. We found that omega-3 fatty acids were effective in reducing the triglyceride level significantly as compared to placebo. Two gram of omega-3 fatty acids was more effective than 1 g of omega-3 fatty acids in reducing triglyceride levels. No effect was found on the serum level of total cholesterol, high density lipoprotein and low density lipoprotein. It can be also concluded that omega-3 fatty acids can be given along with metformin with no adverse drug reactions and no drug interaction.
* Significant
* Significant