Diabetes mellitus is a public health problem throughout the world with a patient burden of 387 million which is expected to rise to 592 million by 2035 [1,2]. Diabetes is approaching to get the status of a potential epidemic in India with more than 62 million diabetic individuals and it is predicted to reach the 80 million mark by 2030 [3].
Type 2 diabetes is commonly associated with obesity and dyslipidemia, which represents a synergistic risk factor for cardiovascular disease [4]. The National Cholesterol Education Program Adult Treatment Panel III (ATP III) has listed diabetes as a Coronary Heart Disease (CHD) risk equivalent for setting therapeutic goals for LDL cholesterol of <100 mg/dl [5], which would evoke the use of cholesterol-lowering drugs, particularly statins. With recent FDA approved indications for statins being widened because of its lipid lowering and pleiotropic effects, statins are currently amongst the most widely used drugs in patients with or without diabetes [6].
Although cardiovascular risk is reduced by statin therapy, its association with the development of diabetes is disputed. Retrospective analysis of the West of Scotland Coronary Prevention Study (WOSCOPS) revealed that 5 years of treatment with Pravastatin reduced diabetes incidence by 30% [7]. On the contrary, Pravastatin did not decrease diabetes incidence in another trial including glucose-intolerant humans [8]. Similarly, Simvastatin was found not to alter incidence of diabetes in patients with atherosclerosis in the Heart Protection Study [9]. In contrast, Atorvastatin marginally increased diabetes incidence in the Anglo-Scandinavian Cardiac Outcomes Trial (ASCOT-LLA) [10]. The researchers noted small but statistically significant increase in the rate of physician-reported diabetes and glycated haemoglobin values in the Rosuvastatin group in JUPITER trial which was a randomized double-blind placebo-controlled study investigating the use of Rosuvastatin in the primary prevention of cardiovascular disease [11]. A recent review of 13 studies by Naveed Sattar, et al., published in Lancet in 2010, on statins and their side-effects including a total of more than 91,140 participants suggested that, use of statins is associated with increased risk of Type 2 diabetes by 9% [12].
Thus, exploring the role of statins in the initiation or progression of diabetes mellitus is an exciting area for investigation. With this background the present study was conducted with the objective to find out the effect of Atorvastatin on the glycaemic parameters of normoglycaemic and prediabetic individuals from eastern part of India, and the significance of various doses of Atorvastatin.
Materials and Methods
The present study is an observational, prospective panel study conducted at SCB Medical College and Hospital, Cuttack, Odisha, which is a tertiary care centre. The study was conducted over a period of approximately 2 years from July 2011 to March 2013. Subjects aged 18-65 years of both sexes, receiving Atorvastatin (≤1 month) for either dyslipidemia, or primary or secondary prevention of cardiovascular disease were assessed for recruitment. Both normoglycaemic and prediabetic subjects patients who agreed to participate in the study and signed the informed consent form without any external motivation were included in the study. The American Diabetes Association (ADA) guidelines were followed for diagnosis of diabetes mellitus and prediabetic state [13]. The prediabetic stage is defined as FPG 100 mg/dL (5.6 mmol/L) to 125 mg/dL (6.9 mmol/L) Impaired Fasting Glucose (IFG), or 2 hour plasma glucose in the 75g Oral Glucose Tolerance Test (OGTT): 140 mg/dL (7.8 mmol/L) to 199 mg/dL (11.0 mmol/L) (IGT), or HbA1c: 5.7 -6.4%. Diagnosed cases of diabetes mellitus (both type 1 and 2) on different anti-diabetic regimen; patients on β-blockers, thiazide diuretics, corticosteroids; pregnant and lactating women and patients with co-existing cardiovascular, renal, hepatic diseases were excluded from the study.
At the Outpatient Department of Cardiology and Medicine, patients were screened and following inclusion and exclusion criteria 75 subjects were recruited for the study. Considering glycosylated haemoglobin as the primary outcome, the sample size has been calculated taking the level of significance (α) as 0.05, power of the study (1 – β) as 0.80, expected mean difference as 0.3 and standard deviation of 0.4. Our recruitment strategy was to take consecutive subjects depending on their glycaemic status and recruitment of a particular group was stopped as soon as 25 subjects were recruited in that particular group. At baseline, all demographic and relevant clinical data were collected. As all subjects were on Atorvastatin, Alanine Aminotransferase (ALT) was measured for all to exclude existing hepatotoxicity and non-directive questions were asked to elicit any other side effect related to atorvastatin. Based on the baseline glycaemic status the participants were divided into 3 study groups:
Group A (Normoglycaemic): normal baseline blood glucose level.
Group B {Impaired fasting glucose with normal Glucose Tolerance Test (GTT)}: baseline fasting blood glucose level 100-125 mg/dl with normal 2 hour GTT.
Group C (Impaired glucose tolerance):baseline 2 hour post-glucose blood sugar 140-199 mg/dl.
In each of the above mentioned group, some patients were receiving low dose of Atorvastatin (10-20 mg/day) whereas, other patients were receiving higher dose (40-80 mg/day).
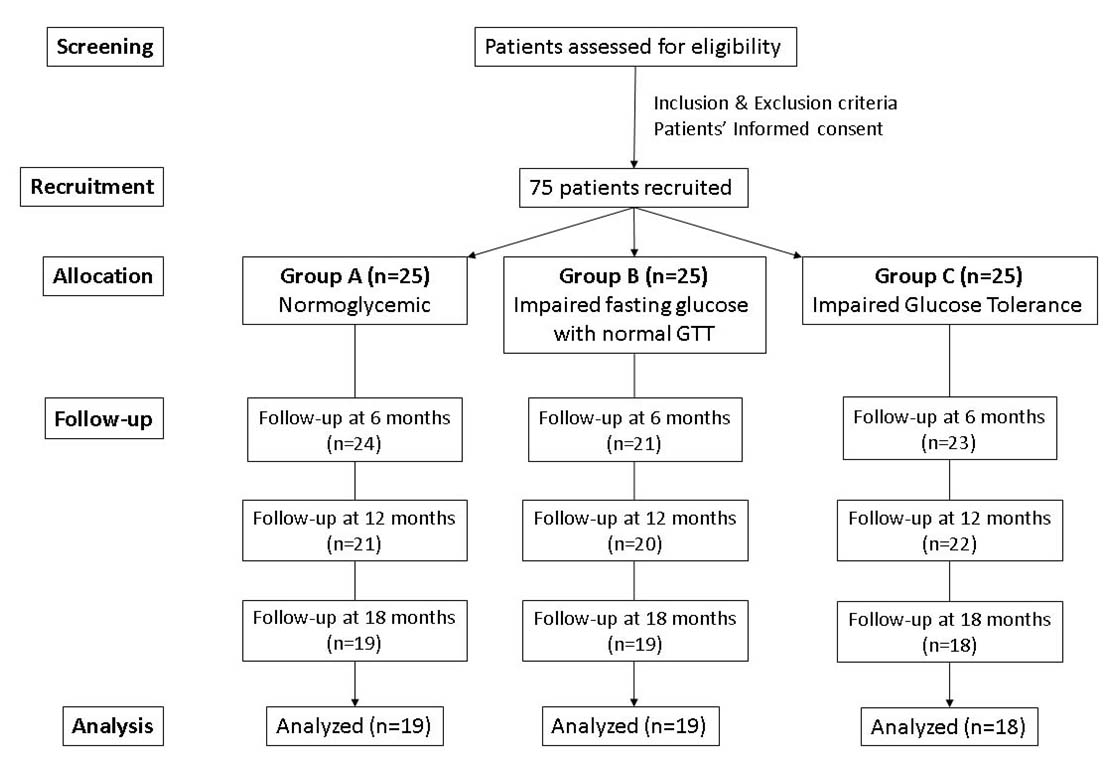
All the subjects were on Atorvastatin and were followed-up at 6 months, 12 months and 18 months [Table/Fig-1]. At every follow up all the glycaemic parameters were evaluated and all subjects were assessed for continuation of statin therapy and the dosing schedule. Progression of glycaemic state to diabetic stage was considered as study end point.
Recruitment, allocation and follow up of study participants.
Outcome measures
Glycosylated haemoglobin (HbA1c%): The blood HbA1c level was determined by ion-exchange HPLC (Bio Rad D10) method [14].
Fasting Blood glucose level: Serum glucose was measured by the glucose oxidase-peroxidase method in autoanalyser (TOSHIBA TBA120FR).
Two-hour post-prandial blood glucose level: The patient was administered 75 g of glucose in 150 ml of water orally over the course of 5 minutes. Blood samples were drawn 2 hours after test load. The blood glucose level was estimated 2 hours after the oral glucose challenge similarly as above. The blood sample was collected in a tube containing sodium fluoride (6 mg/mL of whole blood) and centrifuged promptly to separate out the plasma. The plasma was frozen until the glucose measurement was done.
Lipid profile: Lipid profile was estimated by routine enzymatic methods according to the protocols of the lipid Research Clinics.
Ethical issues
The study was approved by Institute Ethics Committee and procedures followed in this study are in accordance with the ethical standard laid down by ICMR’s ethical guidelines for biomedical research on human subjects (2006). A written informed consent was taken from all the subjects participating in the study after explaining the patient’s diagnosis, the nature and purpose of a proposed treatment, the risks and benefits of a proposed treatment (Atorvastatin), alternative treatment, and the risks and benefits of the alternative treatment.
Safety evaluation
At follow up visits, the patients were asked some non-directive questions to detect any adverse effects among the participants. Patients were directed to call the investigators for reporting any adverse effects experienced by them. According to protocol, ALT and creatine kinase were done when any patient presents with symptoms of myopathy or hepatotoxicity.
Statistical Analysis
The data were analysed using the Statistical Package for Social Sciences (SPSS version 17; SPSS Inc., Chicago, IL, USA). The alpha level was set at p < 0.05 (two-tailed) for statistical significance. One-way ANOVA followed by Tukey-Kramer multiple comparison post-test and chi-square test were used to compare baseline demographic and clinical variables between the groups. Repeated measures analysis of variance (RM-ANOVA) followed by Dunnet’s multiple comparison post-test was used to analyse the change in different parameters at follow up from baseline over different time frames. Before RM-ANOVA, Mauchly’s test was done to assess sphericity. If assumption of sphericity is violated, correction was done according to epsilon (ε) value. When epsilon (ε) >0.75, Huynh-Feldt correction has been used and where epsilon(ε) <0.75, Greenhouse-Geisser correction has been used. Depending on the dose of Atorvastatin (10-20 mg: Low dose group; 40-80 mg: High dose group) sub-group analysis has been done. Regression analysis has been done with dose of atorvastatin as independent variable and change in primary outcome (HbA1c%) as dependent variable.
Results
For the present study, 25 subjects were recruited in each of the three study groups based on their baseline glycaemic status. The participants were evaluated every 6 months up to 18 months. In group A and B, 6 subjects were lost to follow up and 19 were evaluated at the end of the study. In group C, 7 subjects were lost to follow up and 18 were analysed at the end of the study [Table/Fig-1]. Out of 19 drop-outs, 4 patients were due to development of side effect to high dose of Atorvastatin. At 18 months follow up, FBS of 9 subjects (47%) of Group A was found to progress to prediabetic state whereas, in 17 subjects (46%) of Group B and C, FBS was in diabetic range. Atorvastatin monotherapy was replaced by a combination of low dose Atorvastatin and Ezetimibe in all 26 patients thereafter. The patients were also advised life style modification (150 min/week moderate intensity physical activity such as walking).
Analysis of baseline demographic and clinical data
The mean age of the participants was 53 years and 69% were male. There was no statistically significant difference in age, sex, mean duration of Atorvastatin therapy, body mass index, blood pressure and lipid profile in between the groups proving their homogeneity. However, the groups differed significantly in their baseline blood glucose parameters, based on which they were divided into normoglycaemic and prediabetic groups [Table/Fig-2].
Baseline demographic and clinical data.
| Parameters | Study groups | p-value† | Tukey-Kramer post-hoc test (q-value) |
|---|
| Group A(n=25) | Group B(n=25) | Group C(n=25) | Group A vs.Group B | Group A vs.Group C | Group B vs.Group C |
|---|
| Age (years) | 53.95±6.9 | 51.05±7.1 | 52.4±7.6 | 0.45 | Not applicable‡ |
| Female sex (%) | 36 | 24 | 32 | 0.17 | Not applicable‡ |
| Mean duration of statin therapy at baseline (weeks) | 2.4±1.12 | 3.1±0.91 | 2.5±0.98 | 0.12 | Not applicable‡ |
| BMI (Kg/m2) | 23.04±3.1 | 24.90±2.9 | 24.35±3.0 | 0.14 | Not applicable‡ |
| Systolic blood pressure (mm of Hg) | 122.5±19.9 | 128.9±13.4 | 124.7±16.7 | 0.49 | Not applicable‡ |
| Diastolic blood pressure (mm of Hg) | 78.1±11.3 | 79.0±12.1 | 75.2±10.7 | 0.55 | Not applicable‡ |
| Fasting blood sugar (mg/dl) | 89.65±7.8 | 111.65±8.6 | 107.25±12.9 | <0.001 | 9.787* | 7.829* | 1.957 |
| 2-hr Postprandial blood sugar (mg/dl) | 116.35±13.8 | 124.1±10.2 | 156.15±14.3 | <0.001 | 2.689 | 13.811* | 11.122* |
| Glycosylated haemoglobin (HbA1c %) | 5.48±0.32 | 5.99±0.32 | 6.02±0.37 | <0.001 | 6.761* | 7.225* | 0.464 |
| Total cholesterol (mg/dl) | 217.7±82.4 | 184.5±51.8 | 179.4±85.9 | 0.22 | Not applicable‡ |
| HDL-C (mg/dl) | 42.5±6.0 | 41.4±6.4 | 41.2±5.7 | 0.76 | Not applicable‡ |
| LDL-C (mg/dl) | 135.1±68.2 | 111.4±35.7 | 117.5±69.6 | 0.43 | Not applicable‡ |
| Triglyceride (mg/dl) | 208.6±92.2 | 154.1±59.4 | 172.6±79.9 | 0.11 | Not applicable‡ |
Group A: Normoglycaemic group, Group B: Impaired Fasting glucose with normal glucose tolerance test
Group C: Impaired glucose tolerance test, * Statistically significant (p<0.05), †ANOVA or Chi-square test, ‡Tukey-Kramer post hoc test done only when p<0.05
Change in glycaemic parameters in Group A
The group as a whole irrespective of dose of atorvastatin therapy showed a statistically significant increase in all the three glycaemic parameters. The participants on high dose atorvastatin also showed a statistically significant increase in all the three glycaemic parameters over the study period. The increase in FBS and HbA1c% was also statistically significant in participants on low dose Atorvastatin therapy. Repeated measure ANOVA reveals that change of glycaemic status over time is significant in the group as a whole and the result of post-test also showed that there was a significant change at follow up when compared to baseline. In case of low Atorvastatin group, there was no significant (p=0.07) change in 2-hr Post Prandial Blood Sugar (PPBS) but change in HbA1c% and Fasting Blood Sugar (FBS) was significant especially from 12 months onwards. In case of high atorvastatin group, changes in 2-hr PPBS and HbA1c% were significant from 6 months onwards [Table/Fig-3].
Change in glycaemic parameters in Group A (Normoglycaemic group).
| Subgroup | Parameters | Time frame | p-value‡ | Dunnet multiple comparison post-test (q-value) |
|---|
| T1 (N=25) | T2 (N=24) | T3 (N=21) | T4 (N=19) | T1 vs T2 | T1 vs T3 | T1 vs T4 |
|---|
| Overall(n=19) | FBS (mg/dl) | 89.15±7.7 | 92.26±7.5 | 96.84±8.9 | 100.63±9.0 | <0.0001 | 2.444* | 6.241† | 9.384† |
| 2-hr PPBS (mg/dl) | 116.68±14.1 | 120.37±13.6 | 123.89±13.8 | 127.89±15.8 | <0.0001 | 4.062† | 7.950† | 12.361† |
| HbA1c % (mg/dl) | 5.46±0.32 | 5.54±0.34 | 5.71±0.37 | 5.86±0.39 | <0.0001 | 1.951 | 5.854† | 9.390† |
| Low dose group(n=10) | FBS (mg/dl) | 89.0±6.1 | 91.5±6.5 | 93.6±5.7 | 96.0±5.1 | <0.0001 | 3.285† | 6.045† | 9.199† |
| 2-hr PPBS (mg/dl) | 112.6±17.6 | 115.2±15.8 | 117.8±15.7 | 121.5±14.8 | 0.070 | Not applicable§ |
| HbA1c % (mg/dl) | 5.49±0.37 | 5.54±0.42 | 5.64±0.42 | 5.74±0.44 | 0.0004 | 0.920 | 2.760* | 4.600† |
| High dose group(n=9) | FBS (mg/dl) | 89.67±9.8 | 93.11±8.8 | 100.44±10.7 | 105.78±9.8 | 0.0002 | 1.060 | 3.317† | 4.959† |
| 2-hr PPBS (mg/dl) | 121.22±7.3 | 126.11±8.1 | 130.7±7.2 | 136.6±9.3 | <0.0001 | 5.040† | 9.737† | 15.808† |
| HbA1c % (mg/dl) | 5.42±0.26 | 5.54±0.25 | 5.79±0.26 | 6.01±0.25 | <0.0001 | 2.705* | 8.114† | 13.031† |
T1: Baseline, T2: Follow up at 6 months, T3: Follow up at 12 months, T4: Follow up at 18 months, * Statistically significant (p<0.05), †Statistically significant (p<0.01)
‡Repeated measure ANOVA, §Dunnet multiple comparison post-test done only when p<0.05
Change in glycaemic parameters in Group B
All subjects with impaired fasting glucose irrespective of dose of atorvastatin therapy showed a significant (p<0.0001) increase in all three blood glucose parameters. Subgroup analysis shows that the subjects on both low and high dose Atorvastatin therapy showed a statistically significant increase in all three glycaemic parameters. Repeated measure ANOVA reveals that change of glycaemic status over time is significant in the group as a whole and the result of post-test also showed that, there was a significant change at follow up when compared to baseline. In case of high dose and low dose subgroups, post test showed that, the changes were significant from 12 months onwards [Table/Fig-4].
Change in glycaemic parameters in Group B Impaired Fasting glucose with normal glucose tolerance test).
| Subgroup | Parameters | Time frame | p-value‡ | Dunnet multiple comparison post-test (q-value) |
|---|
| T1 (N=25) | T2 (N=21) | T3 (N=20) | T4 (N=19) | T1 vs T2 | T1 vs T3 | T1 vs T4 |
|---|
| Overall(n=19) | FBS (mg/dl) | 111.13±8.9 | 114.84±9.4 | 118.74±10.1 | 121.37±10.2 | <0.0001 | 2.456* | 5.436† | 7.449† |
| 2-hr PPBS (mg/dl) | 125.05±9.5 | 128.16±9.3 | 131.53±11.4 | 136.68±13.9 | <0.0001 | 2.068 | 4.311† | 7.746† |
| HbA1c % (mg/dl) | 5.97±0.32 | 6.03±0.33 | 6.14±0.34 | 6.29±0.38 | <0.0001 | 1.737 | 4.896† | 9.476† |
| Low dose group(n=12) | FBS (mg/dl) | 111.33±9.2 | 113.25±9.5 | 117.33±10.0 | 120.25±9.2 | <0.0001 | 1.190 | 3.726† | 5.537† |
| 2-hr PPBS (mg/dl) | 125.58±10.5 | 127.92±9.9 | 130.33±10.2 | 134.33±10.8 | <0.0001 | 2.200 | 4.478† | 8.250† |
| HbA1c % (mg/dl) | 5.94±0.38 | 5.97±0.39 | 6.07±0.40 | 6.18±0.39 | <0.0001 | 0.747 | 3.734† | 7.219† |
| High dose group(n=7) | FBS (mg/dl) | 112.14±9.0 | 117.57±9.4 | 121.14±10.5 | 123.29±12.3 | 0.0007 | 2.368 | 3.926† | 4.860† |
| 2-hr PPBS (mg/dl) | 124.14±8.2 | 128.57±8.8 | 133.57±13.8 | 140.71±18.5 | 0.0012 | 1.256 | 2.675* | 4.701† |
| HbA1c % (mg/dl) | 6.03±0.19 | 6.14±0.18 | 6.26±0.17 | 6.47±0.27 | <0.0001 | 1.786 | 3.573† | 6.922† |
T1: Baseline, T2: Follow up at 6 months, T3: Follow up at 12 months, T4: Follow up at 18 months, * Statistically significant (p<0.05), †Statistically significant (p<0.01), ‡Repeated measure ANOVA
Change in glycaemic parameters in Group C
The group as a whole irrespective of dose of Atorvastatin therapy showed a statistically significant (p<0.0001) increase in all the three glycaemic parameters. The participants on high dose statin therapy showed a statistically significant (p<0.0001) increase in all three parameters. The increase in the FBS was not statistically significant (p=0.42) in participants with impaired glucose tolerance on low dose Atorvastatin therapy but the change in 2-hr PPBS and HbA1c% showed a significant increase. Repeated measure ANOVA reveals that change of glycaemic status over time is significant in the group as a whole and the result of post-test also showed that, there was a significant change at follow up when compared to baseline. In case of low Atorvastatin group, there was no significant change in FBS but change in HbA1c% and 2-hr PPBS were significant especially from 12 months onwards. In case of high Atorvastatin group, changes in all parameters were significant from 6 months onwards [Table/Fig-5].
Change in glycaemic parameters in Group C (Impaired glucose tolerance test).
| Subgroup | Parameters | Time frame | p-value‡ | Dunnet multiple comparison post-test (q-value) |
|---|
| T1 (N=25) | T2 (N=21) | T3 (N=20) | T4 (N=19) | T1 vs T2 | T1 vs T3 | T1 vs T4 |
|---|
| Overall(n=18) | FBS (mg/dl) | 107.67±13.5 | 107.44±18.0 | 114.33±18.7 | 120.33±19.3 | <0.0001 | 0.083 | 2.498* | 4.746† |
| 2-hr PPBS (mg/dl) | 155.17±12.0 | 160.06±12.4 | 166.72±14.5 | 173.06±17.4 | <0.0001 | 2.599* | 6.143† | 9.510† |
| HbA1c % (mg/dl) | 6.07±0.33 | 6.16±0.33 | 6.30±0.33 | 6.52±0.39 | <0.0001 | 2.434* | 5.678† | 11.087† |
| Low dose group(n=10) | FBS (mg/dl) | 107.4±9.8 | 107.2±9.6 | 106.7±15.7 | 112.6±17.6 | 0.420 | Not applicable§ |
| 2-hr PPBS (mg/dl) | 155.1±10.8 | 157.3±10.2 | 163.3±13.6 | 167.9±16.6 | <0.0001 | 0.970 | 3.617† | 5.646† |
| HbA1c % (mg/dl) | 6.04±0.31 | 6.07±0.30 | 6.21±0.28 | 6.37±0.29 | <0.0001 | 0.553 | 3.132* | 6.080† |
| High dose group(n=8) | FBS (mg/dl) | 108.0±17.9 | 115.75±18.6 | 123.88±18.6 | 130.0±17.7 | <0.0001 | 3.103* | 6.357† | 8.809† |
| 2-hr PPBS (mg/dl) | 155.3±14.2 | 163.5±14.7 | 171.0±15.3 | 179.5±17.2 | <0.0001 | 3.016* | 5.757† | 8.865† |
| HbA1c % (mg/dl) | 6.10±0.38 | 6.29±0.35 | 6.41±0.38 | 6.71±0.44 | <0.0001 | 3.852† | 6.419† | 12.582† |
T1: Baseline, T2: Follow up at 6 months, T3: Follow up at 12 months, T4: Follow up at 18 months, * Statistically significant (p<0.05), †Statistically significant (p<0.01), ‡Repeated measure ANOVA
§Dunnet multiple comparison post-testdone only when p<0.05
Comparison between groups
The results shown in [Table/Fig-6] reveal that, there was no statistically significant difference in the mean change in glycaemic parameters from baseline to 18 months among all the three groups. The glycaemic parameters showed that in normoglycaemic group (Group A), 9 subjects out of 19 followed up at 18 months progressed to prediabetic stage whereas, 17 out of 37 prediabetic subjects (Group B and C together) progressed to diabetes stage at the end of 18 months. These findings were put in a 2x2 contingency table and tested by Fischer’s-exact test and was found to be statistically not significant (>0.05).
Mean change in glycaemic parameters from baseline after 18 months and comparison between the groups.
| Parameters | Mean change from baseline after 18 months | p-value* |
|---|
| Group A | Group B | Group C |
|---|
| Fasting blood sugar (mg/dl) | 11.3 | 9.7 | 12.7 | 0.73 |
| 2-hr Postprandial blood sugar (mg/dl) | 11.9 | 11.6 | 17.9 | 0.17 |
| Glycosylated haemoglobin (HbA1c %) | 0.36 | 0.32 | 0.46 | 0.22 |
Group A: Normoglycaemic group
Group B: Impaired Fasting glucose with normal glucose tolerance test
Group C: Impaired glucose tolerance test
* ANOVA
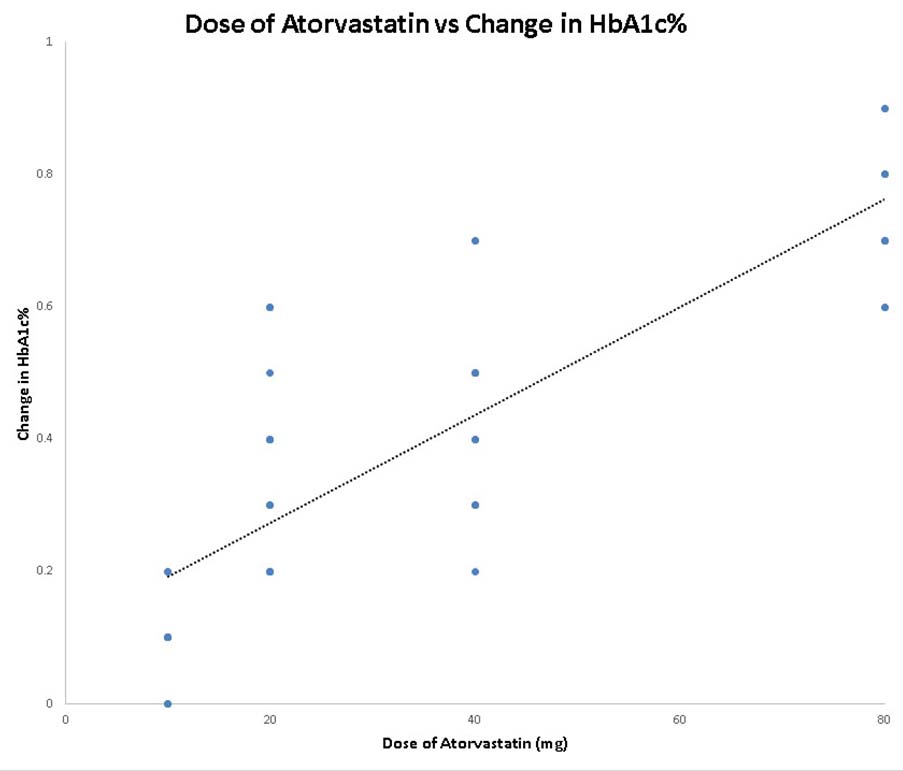
Regression Analysis
Regression analysis has been done with dose of Atorvastatin as independent variable (predictor variable) and change in primary outcome (HbA1c%) as dependent variable (criterion variable). The result reveals that the dependent variable (change in HbA1c%) changes significantly when the dose of Atorvastatin is varied, while the other independent variables are held fixed [Table/Fig-7,8]. The regression analysis also suggests that a higher dose of Atorvastatin is more associated with glucose intolerance.
Regression analysis with dose of atorvastatin as independent variable and change in HbA1c% as dependent variable.
| Groups | R2 | t-value testingslope=0 | p-value | 95% Confidence Intervalfor slope |
|---|
| Group A (N=19) | 0.619 | 5.26 | 0.01 | 0.0047 to 0.01046 |
| Group B (N=19) | 0.605 | 5.10 | 0.01 | 0.00447 to 0.01077 |
| Group C (N=18) | 0.613 | 5.03 | 0.01 | 0.00437 to 0.01074 |
| Total (N=56) | 0.616 | 9.31 | <0.001 | 0.00603 to 0.00935 |
Group A: Normoglycaemic group
Group B: Impaired Fasting glucose with normal glucose tolerance test
Group C: Impaired glucose tolerance test
Scatter diagram for regression analysis with dose of atorvastatin as independent variable and change in HbA1c% as dependent variable in follow up subjects (N=56).
Safety evaluation
A total of four subjects (two from Group A and one each from Group B and C) who were on 80 mg of atorvastatin presented with symptoms of myopathy at 12 months follow up. Serum creatine kinase and ALT was done and Atorvastatin was discontinued. These four patients were excluded from analysis.
Discussion
The present study revealed that, there exists clinically important risk of developing glucose intolerance during Atorvastatin therapy especially where high dose of Atorvastatin is prescribed. There was a statistically significant increase in fasting blood glucose, 2-hr Post Prandial Blood Sugar (PPBS) and HbA1c% with statin therapy, irrespective of the initial glycaemic status of the individual, at the end of 18 months of study period.
The findings of the present study is in contrast to the first study that evaluated the statin-diabetes association, where Freeman et al., reported a statistically significant protective effect of statins use, on diabetes incidence in the WOSCOPS, but used additional non standardized criteria for diabetes diagnosis [7]. The study concluded that Pravastatin therapy (40 mg/day) resulted in a 30% reduction in risk of becoming diabetic. This protective effect was not confirmed/supported by subsequent statin trials like HPS (Simvastatin 40 mg) by Collins R et al., [9] LIPID (Pravastatin 40 mg) by Keech A et al., [8] and CORONA (Rosuvastatin 10 mg) by Kjekshus J et al., [15]. These studies reported a null association between statin use and diabetes risk. In contrast Atorvastatin 10 mg marginally increased diabetes incidence in ASCOT-LLA trial by Sever PS et al., [10]. In recent JUPITER trial (Rosuvastatin 20 mg) by Ridker PM et al., a small but significant increase in physician-reported diabetes was reported among statin users compared with those taking placebo [16]. Takano T et al., (compared Atorvastatin against Pravastatin) and Yamakawa T et al., (compared Atorvastatin against Pravastatin and Pitavastatin) have reported potential adverse effect of Atorvastatin on glucose control in diabetic patients [17,18].
A meta-analysis by Rajpathak et al., suggests that, statins may interfere with normal glucose metabolism along with cardioprotective effects [19]. In this domain the data from both in vitro and in vivo study by Nakata et al., reveals that, Atorvastatin decreases maturation of adipocyte resulting in a decrease in expression of GLUT4 and up regulation of GLUT1 in cultured pre-adipocytes and in mice [20]. These results in a marked reduction in insulin-mediated cellular glucose uptake caused by decreased insulin sensitivity, which may possibly result in exacerbation of glucose intolerance [21]. It has been found that statin-induced insulin resistance can be reversed by isoprenoid precursor mevalonate and this finding suggests that statin- induced insulin resistance may result from inhibition of isoprenoid biosynthesis, an intermediate product in cholesterol formation [19,20,22]. Not only induction of insulin resistance, insulin secretion may be affected by statin therapy directly. From this aspect, Yada et al., demonstrated through animal experiment that if pancreatic beta cells are incubated with statins, insulin secretion is reduced due to inhibition of glucose- stimulated increase in free cytoplasmic Ca2+ ion and L- type Ca2+ channels [23]. Similar findings were also reported in another study using a β-cell line, MINC cells, where investigators demonstrated that high doses of lipophilic but not hydrophilic statins decrease insulin secretion, either due to hydroxymethylglutaryl-CoA inhibition or cytotoxicity [24]. In JUPITER trial 77% of study population who developed diabetes had IGT. A few studies have suggested that, statin use may result in an increase in HbA1c level, although these effects have been quite small [9,16]. The report of PROVE-IT TIMI 22 trial reveals that treatment with both 80 mg atorvastatin and 40 mg Pravastatin were both associated with a small increase in HbA1c% but Atorvastatin significantly increased risk of increasing HbA1c > 6% in comparison to Pravastatin [19,25].
From the present study, it is evident that the effect of Atorvastatin on glycaemic status is dose dependent. High dose (40-80 mg) of statin therapy showed significant increase in blood glucose parameters after 6 months of therapy whereas, low dose is associated with statistically significant increase in glycaemic parameters after 12 months of therapy. Similar report was given by Preiss D et al., who stated that new onset diabetes was significantly more frequent in patients receiving intensive statin treatment (12% increased risk) compared with those receiving moderate statin treatment [26]. Although in our study, we found Atorvastatin especially in high doses increases the risk of dysglycaemia and we switched over to a combination of low dose Atorvastatin and ezetimibe, no change is recommended to current practice because the benefits of statin therapy for the reduction of cardiovascular events in patients at risk for diabetes (including prediabetic patients) outweigh this risk. However, counselling regarding life style modification like weight loss and physical activity should be done for prediabetic patients [13,27]. Till date most of the studies on glycaemic effect of statin have been conducted on Type 2 DM and done abroad. This is the first Indian study done on prediabetic subjects from east India.
Limitation
Single centre design and small cohort being the major limitation of the present study, the findings of this study can be confirmed by a large prospective cohort study in future.
Conclusion
Thus, Atorvastatin therapy at higher dose and for longer duration was found to cause glucose intolerance in normoglycaemic persons and also caused progression towards diabetes in prediabetic individuals.