Calcium is one of the common cations found in Extracellular Fluid (ECF) and of great importance in critical care practice. The ECF concentration of calcium is kept constant by processes that continuously add or remove calcium. Pumping intracellular calcium out of the cytosol in to the sarcoplasmic reticulum or ECF is energy dependant. During shock, intracellular energy is depleted and calcium accumulates within cells which may facilitate cell death [1]. Kidneys are the major organ responsible for regulating the plasma concentration of calcium. As acute kidney injury, sepsis, shock etc., are very much prevalent in critically ill patients, extracellular calcium is expected to be low in such severely ill patients. APACHE and SOFA are two commonly used and validated scoring tool used to assess the severity of illness in critically ill patients [2]. The present study was aimed to evaluate the relation of on admission hypocalcaemia as measured by iCaO concentration with severity of illness as measured by APACHE II and SOFA scores.
Materials and Methods
After approval from the Institute Research Board, the present prospective observational study was conducted in an adult Intensive Care Unit (ICU) of mixed surgical and medical patients. Patients of either sex with age more than >18 years; admitted during May 2016 to June 2016; who remained hospitalized for at least 24 hours were included. Patient who died before 24 hours of ICU stay and who had received intravenous calcium supplement just before ICU admission were excluded. Age and sex on admission, iCa0 levels measured using ESCHWEILER combiline CL 1234568-12-HB blood gas analyzer (Eschweiler GmbH and Co. KG, Germany) were noted. The on-admission APACHE-II and SOFA scores were calculated for each patient. The cohort was then stratified into four classes based on iCa0 levels {i.e., normocalcaemic (> 1.15 mmol/L), mild hypocalcaemic (0.91–1.15 mmol/L), moderate hypocalcaemia (0.81–0.90 mmol/L) and severe hypocalcaemic (< 0.80 mmol/L)}. The cohort was also stratified into three classes based on APACHE-II scores {class a (score < 9), class b (score 10-19) and class c (score > 20)} and SOFA scores {class a (score < 4), class b (score 5-8) and class c (score > 9)}. Incidence prevalence data are presented in absolute number and percentage scale.
Statistical Analysis
The correlation between calcium level, length of ICU stay, relative risk of mortality and severity scoring were analyzed by Fisher’s exact test using INSTAT software (GraphPad Prism software Inc., La Zolla, USA) and p<0.05 was considered as significant.
Results
One hundred eleven patients {58 (52.25%) males and 53 (47.75%) females} with mean age 47.85±19.29 years and mean ICU stay of 4.96±4.98 (95% confidence interval: CI 4.02–5.90) days were analyzed for the present study. The mean iCa0 level, APACHE-II and SOFA scores for the entire cohort were 1.00±0.27 mmol/L, 18.50±7.51 and 5.18±2.64 respectively. Seventy eight patients (70.27 %) of the cohort were having hypocalcaemia (36.94% mild, 9.91% moderate and 23.42% severe) on admission. The mean iCa0 of normal, mild, moderate and severe hypocalcaemic patients were 1.31±0.13, 1.03±0.07, 0.86±0.03, 0.64±0.11 mmol/L respectively.
The mean APACHE-II score of normocalcaemic patients were significantly (p<0.05) lower as compared to moderate and severe hypocalcaemic patients (15.57±6.85 versus 21.72±6.37 and 15.57±6.85 versus 22.34±7.53 respectively) [Table/Fig-1]. However, although the mean SOFA score of normocalcaemic patients were significantly (p<0.05) lower as compared to moderate hypocalcaemic (4.84±2.69 versus 7.0±3.40; p<0.05); there was no statistical significance in difference noted when compared to severe hypocalcaemic patients (4.84±2.69 versus 6.07±2.57; p> 0.05) [Table/Fig-1]. The mean iCa0 level in patients with APACHE-II <9 (class a) were significantly higher than patients with APACHE-II >20 (class c) (1.09±0.24 versus 0.88±0.26; p<0.05). The mean iCa0 levels in patients with SOFA < 4 (class a) were however not significantly higher than the patients with SOFA class b, as well as c (1.04±0.23 versus 0.98±0.27 and 0.99±0.41 respectively; p>0.05) [Table/Fig-2].
APACHE II, SOFA scores and LOS in ICU of normocalcaemic and hypocalcaemic patients analysed using unpaired t-test. (iCa0- on admission ionized calcium, SD- standard deviation, CI- confidence interval, LOS- length of stay, ICU – intensive care unit, Ref - <0.05)
| iCa0 based category | APACHE II score | SOFA score | LOS in ICU |
|---|
| Mean (SD) | 95% CI | p-value | Mean (SD) | 95% CI | p-value | Mean (SD) (in Days) | 95% CI | p-value |
|---|
| Normocalcaemic | 15.57 (6.85) | 13.14–18.00 | Reference | 4.84 (2.69) | 3.89–5.80 | Reference | 4.42 (4.92) | 2.67–6.17 | Reference |
| Mild Hypocalcaemic | 18.0 (7.37) | 15.67–20.32 | 0.151 | 4.51 (2.13) | 3.83–5.18 | 0.550 | 4.53 (5.08) | 2.93–6.14 | 0.923 |
| Moderate Hypocalcaemic | 21.72 (6.37) | 17.44–26.00 | 0.012 | 7.00 (3.40) | 4.71–9.28 | 0.037 | 7.63 (7.20) | 2.79–12.47 | 0.104 |
| Severe Hypocalcaemic | 22.34 (7.53) | 19.30 – 25.39 | 0.0007 | 6.07 (2.57) | 5.03 – 7.11 | 0.081 | 5.19 (3.48) | 3.78 – 6.60 | 0.503 |
Patient distribution across the different score based classes and their on admission ionized calcium levels (mmol/L) compared using unpaired t-test. (SD- standard deviation, CI- confidence interval, total number 111)
| Score based class | Number (%) | Mean (SD) | 95% CI | p-value |
|---|
| APACHE-II class a | 7 (6.31) | 1.09 (0.24) | 0.87–1.31 | Reference |
| APACHE-II class b | 61 (54.95) | 1.08 (0.24) | 1.02–1.15 | 0.940 |
| APACHE-II class c | 43 (38.74) | 0.88 (0.26) | 0.79–0.96 | 0.050 |
| SOFA class a | 47 (42.34) | 1.04 (0.23) | 0.97–1.10 | Reference |
| SOFA class b | 54 (48.65) | 0.98 (0.27) | 0.90–1.05 | 0.266 |
| SOFA class c | 10 (9.01) | 0.99 (0.41) | 0.69–1.29 | 0.610 |
A total of 27.93% patients died. On admission severe hypocalcaemic patients had highest mortality (38.46%). The Relative Risk (RR) of mortality of on-admission moderate and severe hypocalcaemic patients were higher than normocalcaemic patients (RR>1.5 for both); but the difference was not statistically significant [Table/Fig-3]. The mean length of ICU stay of on-admission moderate hypocalcaemic patients (7.63±7.20 days) was the highest; yet the difference was not statistically significant [Table/Fig-1].
Relationship of different iCa0 with mortality analysed using Fisher’s exact-test. (iCa0- on admission ionized calcium, RR- relative risk, CI- confidence interval, n- number)
| iCa0 based category | Mortalityn (%) | RR (95% CI) | p-value |
|---|
| Normocalcaemic (33) | 7 (21.21) | | Reference |
| Mild Hypocalcaemic (41) | 10 (24.39) | 1.08 (0.68–1.71) | 0.788 |
| Moderate Hypocalcaemic (11) | 4 (36.36) | 1.71 (0.61–4.76) | 0.424 |
| Severe Hypocalcaemic (26) | 10 (38.46) | 1.54 (0.88–2.68) | 0.162 |
Discussion
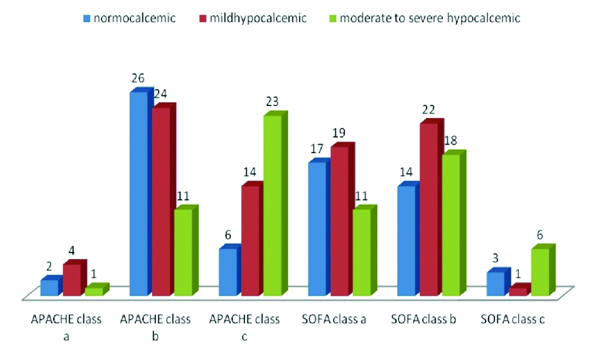
Calcium plays an important role in contraction of muscles and endocrine, exocrine and neurocrine functions in human body [3]. Hypocalcaemia is multifactorial in critically ill patients and can affect these physiological functions [4]. In ICU, 35%-60% of the patients are shown to have hypocalcaemia and 6.2% have severe hypocalcaemia [5–7]. In the present study, the incidence of on admission hypocalcaemia was as high as 69.37%. This finding though resembles with the Multiparameter Intelligent Monitoring in Intensive Care II (MIMIC-II) database analysis from China but it is far higher than the findings of an ICU of Saudi Arabia [5,7]. A study has shown 53.9% of severely ill patients having hypocalcaemia [5]. In the present study, although 33.34% patients in the APACHE-II class c were having hypocalcaemia and 53.49% were moderately or severely have hypocalcaemia; the difference was not statistically significant as compared to APACHE-II class a [Table/Fig-4,5]. Similar results were also noted for SOFA score and its relation with hypocalcaemia, where it has been found that more severe illness as measured by higher SOFA score is not associated with more on admission hypocalcaemia [Table/Fig-4].
Number and risk of on admission hypocalcaemia with different classes of APACHE-II and SOFA analyzed using Fisher’s exact test. (iCa0- on admission ionized calcium, RR- relative risk, CI- confidence interval, n - number).
| iCa0 based category | APACHE-II [N=111] n (%) | SOFA [N=111] n (%) |
|---|
| class a | class b | class c | class a | class b | class c |
|---|
| Normocalcaemic | 2 (1.80) | 25 (22.52) | 6 (5.40) | 16 (14.41) | 14 (12.61) | 3 (2.70) |
| Hypocalcaemic | 5 (4.50) | 36 (32.44) | 37 (33.34) | 31 (27.93) | 40 (36.04) | 7 (6.31) |
| RR95% CIp-value | Reference | 0.9480.81–1.100.694 | 1.170.77–1.770.309 | Reference | 1.200.78 – 1.860.391 | 1.160.33 – 4.011.00 |
Clustered column chart of on admission ionized calcium based patient distribution across different score based classes.
Although in a large multicentre retrospective evaluation has failed to show independent association with hospital or ICU mortality in combined medical/surgical ICU patients, an initial iCa ≤0.88 mmol/L has shown to be a significant risk factor associated with mortality in adult trauma patients [8,9]. Analysis of MIMIC-II database has shown that the non-survivors had lower on admission iCaO than the survivors. Multivariate analysis of these data further showed that, moderate hypocalcaemia on admission was significantly associated with increased risk of death [7]. The present study also showed increased mortality and length of stay in ICU in patients admitted with moderate hypocalcaemia (iCaO of 0.81 – 0.90 mmol/L), but the differences as compared to other on admission hypocalcaemic as well as normocalcaemic patients were not statistically significant [Table/Fig-1,3]. These indicate that the association of hypocalcaemia with increased mortality is still not well proved. Moreover, the relationship of more severely ill patients with on admission hypocalcaemia is also relatively less studied. The present study was aimed to assess the relationship of iCaO/ hypocalcaemia with disease severity as measured by commonly used predictive scoring systems used in ICU.
Many predictive scoring systems have been developed to assess the severity of critical illness and mortality in ICU patients. APACHE II developed in 1985 is the world’s most widely used and best known severity of illness score assess disease severity on admission and is used to predict outcome while SOFA assess the presence and severity of organ dysfunction [2,10]. SOFA has been validated in mixed medical–surgical patient ICU as well as for sepsis related organ dysfunction/problems [11,12].
In the present study, APACHE-II scoring has shown increasing trend with decreasing iCaO on admission. However, the mean APACHE-II score in moderately and severely hypocalcaemic patients were not much different (21.72±6.37 versus 22.34±7.53). On the other hand, disease severity as measured by SOFA score has shown an “U” shaped relation with iCa0 level with moderate hypocalcaemia at the nadir of severity (i.e., moderate hypocalcaemic patients were having higher scores than normocalcaemic as well as severely hypocalcaemic patients) [Table/Fig-1]. This finding indirectly resembles with the findings of MIMIC II database analysis where it has been found that mild and severe hypocalcaemia on ICU entry were not associated with altered ICU mortality but moderate hypocalcaemia was significantly associated with increased risk of death [7]. However, the present study, although found increased mortality with moderate and severe hypocalcaemia on admission, the difference was not statistically significant when compared to on admission normocalcaemic patients.
While the finding of significantly lower iCa0 level in patients with APACHE-II score > 20 as compared to patients with APACHE-II score < 9 suggests that hypocalcaemia is associated with illness severity; it is nullified by the findings of statistically indifferent iCa0 in patients with SOFA score > 9 as compared to patients with SOFA score < 4.
Limitation
The present study finding cannot give a conclusive interpretation of whether increasing hypocalcaemia is associated with increasing severity of illness or not in adult ICU patients. However, it is indicative of the fact that, hypocalcaemia of moderate and severe grade should most probably be considered as similar clinical entity of importance and targeted for treatment and research. The present study was also limited with the fact that the sample size is relatively smaller.
Conclusion
The iCa0 of <0.9 mmol/L is probably associated with increasing illness severity, mortality and length of stay in ICU. Mild hypocalcaemia (1.14 – 0.9 mmol/L) on admission probably does not need much attention in adult ICU patients. However, further study with higher sample size is required to draw a stronger conclusion.