MS, also called Syndrome X, is a constellation of risk factors for the development of cardiovascular disease and Type 2 DM. The syndrome includes dyslipidaemia, hypertension, hyperglycaemia and abdominal obesity. The syndrome has complex multifactorial aetiology and pathogenesis [1].
The prevalence of MS varies worldwide. According to the National Health and Nutrition Examination Survey (NHANES) conducted from 1988 to 1994, the prevalence in the USA was found to be 23.7% [2]. Data pertaining to the Indian subcontinent is currently unavailable.
The National Cholesterol Education Program and Adult Treatment Panel III (NCEP: ATPIII) 2001 criteria (revised in 2005) are one of the most widely used diagnostic aids. The criteria are as follows [1,3,4]:
Presence of three or more of the above criteria entitles the physician to diagnose a patient of MS [1]. Other defining criteria that are less commonly in use include the Harmonization definition criteria, WHO criteria (1998), IDF criteria (2005) and EGIR criteria (1999) [1,3].
Treatment of MS requires a multimodal approach, including pharmacological and non pharmacological modalities. If a drug was the precipitating factor for the onset of MS, then the drug has to be discontinued. Most commonly, atypical anti psychotics (clozapine, olanzapine, etc.,) are the drugs responsible for development of MS [5]. Each component of MS is managed with separate groups of drugs. Phentermine, topiramate and lorcaserin are drugs that can be used to suppress the patient’s appetite, while orlistat is a drug that inhibits the absorption of fats from the gut [1,6]. Insulin resistance, which is the hallmark of MS, is usually managed using biguanides or thiazolidinediones [1]. For management of hypertriglyceridaemia, fibrates are the drugs of choice. Statins also help by significantly reducing LDL cholesterol levels and minimizing cardiovascular complications. In addition, statins have cholesterol independent effects (anti inflammatory, anticoagulant, antioxidant, etc.,). Nicotinic acid can additionally raise the levels of HDL cholesterol. However, trials have shown that nicotinic acid may not have any influence on the cardiovascular risk [1,6]. For hypertension in MS, the drugs of choice are the ACEIs or the Angiotensin Receptor Blockers (ARBs), as they possess the ability to retard or prevent the development of frank Type 2 DM [1]. Although, beta blockers are known to be potent anti-hypertensives and to also reduce the incidence of sudden cardiac deaths, their adverse profile on glycaemic control excludes these agents in the management of MS [6].
In the clinical setup, most often, there is improper management, due to non compliance of the patient (due to pill burden) or due to improper initiation of therapy. To circumvent this issue, the underlying pathogenesis has to be targeted, and not the individual components. Statins, ACEIs and ARBs are drugs that have this potential [6].
Currently, ACEIs are the drugs of choice for managing the hypertensive component of MS [6,7]. However, the pathways that are blocked by these drugs signal that ACEIs may also be used for the non hypertensive components in the syndrome. While captopril was the earliest synthesized ACEI, newer drugs like enalapril, ramipril and lisinopril are more commonly prescribed in modern practice. Enalapril, a prodrug (that gets converted to its active form, enalaprilat), is the most commonly used ACEI [8].
To study the therapeutic effect of enalapril on olanzapine-induced MS in Wistar rats, using parameters like body weight, random blood glucose and serum lipid profile (total cholesterol, LDLs, HDLs, triglycerides).
Materials and Methods
The study was an experimental animal study, done over a period of around 45 days (April 2015 to May 2015), after obtaining the approval of the Institutional Animal Ethics Committee.
Animal Selection
A total of 36 adult female wistar albino rats (Rattus norvegicus), each weighing 150-250 grams were obtained. Female rats were chosen as they have been shown to be more sensitive to metabolic changes, when compared to males [9,10]. All rats were housed in the Central Animal House, Manipal, at room temperature (23±2°C) with a 10-14 hours of light:dark environment. They were given standard laboratory feed (VRK Nutritional Solutions, Pune, India) and water ad libitum. The experiment protocol was approved by the Institutional Animal Ethics Committee, and the experiments were conducted in accordance with the Committee for the Purpose of Control and Supervision of Experiments on Animals (CPCSEA) guidelines.
Drugs, Reagents and Other Materials
Olanzapine fine powder was mixed with a small volume (0.1 ml) of glacial acetic acid, and then made to volume using distilled water. Enalapril fine powder was made to volume with adequate volume of distilled water. Reagents for the biochemical assay (serum lipid profile) were obtained from Agappe Diagnostics Pvt. Ltd. Digital glucometer and testing strips (from AccuChek) were used for measurement of blood glucose levels. Capillary tubes were used for retro-orbital blood collection. Incubator, centrifuge and semiautomatic analyser from the Department of Pharmacology, Kasturba Medical College, Manipal were utilized.
Selection of Dosage of Drugs
The dose (2 mg/kg/day), duration (three weeks) and route (intraperitoneal – i.p.) of olanzapine administration were chosen based on previous studies that showed positive induction of MS in female Wistar rats with this regimen. Olanzapine (Olz) was administered in two divided doses (one dose between 09 to 10 a.m., and the other between 04 to 05 p.m.) because of short half life following i.p. administration of the drug [9,10].
Enalapril was chosen among the several ACEIs because it is one of the most commonly used in the clinical scenario. Three different doses (E1 - 1 mg/kg/day, E2 - 10 mg/kg/day and E3 - 20 mg/kg/day) of enalapril were selected so that the response to each dose can be studied, and the most appropriate dose can be used for further studies, or in clinical studies.
Experimental Groups
Thirty-six female wistar rats were randomly assigned to six different groups, as follows: (also shown in [Table/Fig-1]).
Consort flow diagram showing the study conduct.
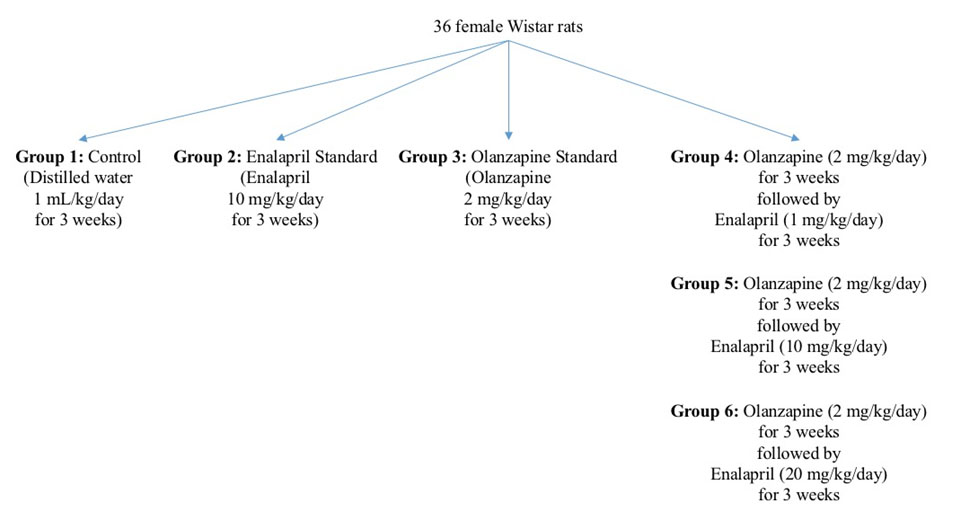
Group 1 (Control) – Rats received 1 ml/kg/day of distilled water i.p. as a single daily dose for a period of six weeks.
Group 2 (Enalapril standard) – Rats received 10 mg/kg/day of enalapril orally as a single daily dose for a period of three weeks.
Group 3 (Olanzapine standard) – Rats received 2 mg/kg/day of olanzapine i.p. in two divided doses for a period of three weeks.
Group 4 (Olanzapine followed by low dose enalapril – E1) – Rats received 2 mg/kg/day of olanzapine i.p. in two divided doses for a period of three weeks, to induce the development of MS. Following this, rats were given 1 mg/kg/day of enalapril orally as a single daily dose for a period of another three weeks.
Group 5 (Olanzapine followed by moderate dose enalapril – E2) – Rats received 2 mg/kg/day of olanzapine i.p. in two divided doses for a period of three weeks, to induce the development of MS. Following this, rats were given 10 mg/kg/day of enalapril orally as a single daily dose for a period of another three weeks.
Group 6 (Olanzapine followed by high dose enalapril – E3) – Rats received 2 mg/kg/day of olanzapine i.p. in two divided doses for a period of three weeks, to induce the development of MS. Following this, rats were given 20 mg/kg/day of enalapril orally as a single dose for a period of another three weeks.
Parameters Measured
Total body weight: All rats were weighed once daily prior to dosing of the drugs, and the values were noted down in grams. For comparison of results, weights at two time points (baseline and at the end of the study) were tabulated.
Random blood glucose: A digital glucometer was used to measure random blood glucose using tail pricks, once a week. All values were noted down in mg/dL. For comparison of results, values at two time points (baseline and at the end of the study) were tabulated.
Serum lipid profile: Venous blood was obtained from all rats from the retro-orbital venous plexus for estimation of lipid parameters – total cholesterol, LDL, HDL and triglycerides. The obtained blood was centrifuged, and the serum was subjected to a semiautomatic analyser (using the reagent kits mentioned above). All values were noted down in mg/dl. This estimation was done at baseline and at the end of the study.
Estimation of total cholesterol: 10 μl of serum sample was added to 1000 μl of the testing reagent, mixed and incubated for five minutes at 37°C. The absorbance was compared against that of the standard (and multiplied by a factor of 200) to arrive at the value of total cholesterol.
Estimation of LDL: 5 μl of serum sample was added to 450μL of the testing reagent 1 and 150 μl of the testing reagent 2, mixed and incubated for five minutes at 37°C. The absorbance was compared against that of the standard (and multiplied by the calibrator concentration factor) to arrive at the value of LDL.
Estimation of HDL: 3 μl of serum sample was added to 270 μl of the testing reagent 1 and 90 μl of the testing reagent 2, mixed and incubated for five minutes at 37°C. The absorbance was compared against that of the standard (and multiplied by the calibrator concentration factor) to arrive at the value of HDL.
Estimation of triglycerides: 10 μl of serum sample was added to 1000 μl of the testing reagent, mixed and incubated for five minutes at 37°C. The absorbance was compared against that of the standard (and multiplied by a factor of 200) to arrive at the value of triglycerides.
All parameters were subjected to statistical analysis.
Statistical Analysis
The data obtained were analysed using IBM Statistical Package for Social Sciences (SPSS) v. 22.0. The results were expressed as Mean±SEM. The significance of differences within the groups at different time points was assessed using repeated measures One-way Analysis of Variance (ANOVA). Similarly, the significance of differences between the various groups was checked for using ANOVA, followed by post-hoc Tukey’s test. All test groups were compared against the control and standard groups, to arrive at a conclusion regarding the results.p-value of <0.05 was considered to be statistically significant.
Results
1. Effect on Body Weight
All baseline values were comparable, and there were no statistically significant differences (p>0.05) among them (as in [Table/Fig-2]).
Body weight comparison of the different experimental groups.
| S. No. | Group(n=6) | Baseline body weight ing (Mean±S.E.M.) | Body weight at theend of the study ing (Mean±S.E.M.) |
|---|
| 1 | Control | 165.33±1.82 | 165.83±1.87 |
| 2 | E2 Standard | 166.33±2.33 | 164.50±2.29 |
| 3 | Olz Standard | 165.50±1.82 | 184.00±2.02 *† |
| 4 | Olz f.b. E1 | 165.33±2.25 | 194.17±2.89 *†‡ |
| 5 | Olz f.b. E2 | 164.67±2.82 | 184.00±1.18 *† |
| 6 | Olz f.b. E3 | 165.17±2.32 | 164.67±1.91‡ |
(n – number of animals in each group; S.E.M. – Standard Error of Mean) (* denotes p<0.05 versus control group; † denotes p<0.05 versus enalapril standard group; ‡ denotes p<0.05 versus olanzapine standard group; p-value calculated by One-way ANOVA followed by Tukey’s post-hoc test)
Therapeutic administration of enalapril
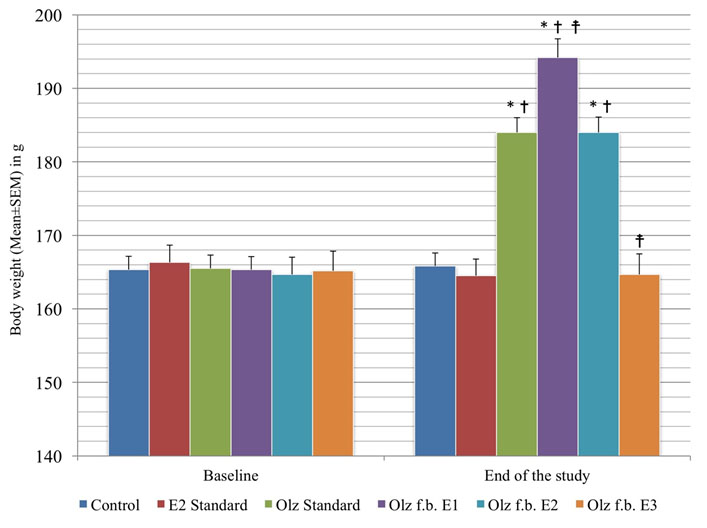
As in [Table/Fig-2], when 20mg/kg/day of enalapril (E3) was given after induction of MS by olanzapine, the body weight was reduced (164.67±1.91; p<0.001), when compared with the olanzapine standard group (184.00±2.02), and was comparable to control group (165.83±1.87; p=0.999). However, the body weight in the E1 group kept increasing till the end of the study (194.17±2.89; p<0.001), when compared with the control group. The E2 group did not reduce the body weight significantly (184.00±1.18; p=1.000), when compared with the olanzapine standard group.
[Table/Fig-3] shows the comparison of body weights in different groups.
Inter group comparison of body weights.
(* denotes p<0.05 versus control group; † denotes p<0.05 versus enalapril standard group; ‡ denotes p<0.05 versus olanzapine standard group; p-value calculated by One-way ANOVA followed by Tukey’s post-hoc test).
2. Effect on Blood Glucose
[Table/Fig-4] shows the baseline blood glucose levels of the rats in all the different experimental groups. The values were all comparable, and there were no statistically significant differences (p>0.05) among them.
Blood glucose level comparison of all the experimental groups.
| S. No. | Group(n=6) | Baseline bloodglucose in mg/dl(Mean±S.E.M.) | Blood glucose at theend of the study in mg/dl(Mean±S.E.M.) |
|---|
| 1 | Control | 78.17±3.21 | 78.67±2.95 |
| 2 | E2 Standard | 77.83±3.35 | 65.33±1.23 * |
| 3 | Olz Standard | 77.17±4.39 | 134.33±3.32 *† |
| 4 | Olz f.b. E1 | 71.67±2.70 | 133.17±1.89 *† |
| 5 | Olz f.b. E2 | 75.17±3.73 | 126.67±3.38 *† |
| 6 | Olz f.b. E3 | 76.17±4.11 | 76.67±3.19‡ |
(n – number of animals in each group; S.E.M. – Standard Error of Mean) (* denotes p<0.05 versus control group; † denotes p<0.05 versus enalapril standard group; ‡ denotes p<0.05 versus olanzapine standard group; p-value calculated by One-way ANOVA followed by Tukey’s post-hoc test).
Therapeutic administration of enalapril
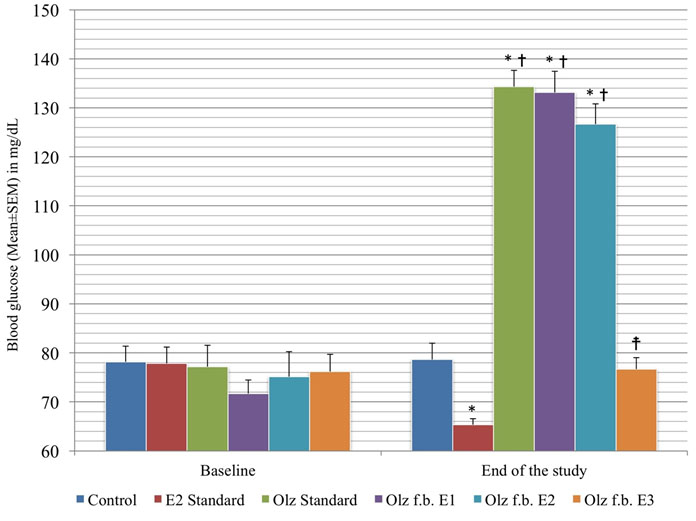
As in [Table/Fig-4], 20 mg/kg/day of enalapril (E3), when administered after induction of MS by olanzapine, brought about a fall in blood glucose levels (76.67±3.19; p<0.001) at the end of the study, when compared with the olanzapine standard group, and was comparable to the values in the control group (78.67±2.95; p=0.995). However, enalapril at the other doses (E1 - 133.17±1.89; p=1.000; E2 - 126.67±3.38; p=0.394) did not show this significant fall, when compared with the olanzapine standard group.
[Table/Fig-5] shows the comparison of blood glucose in the different groups.
Inter group comparison of blood glucose levels.
(* denotes p<0.05 versus control group; † denotes p<0.05 versus enalapril standard group; ‡ denotes p<0.05 versus olanzapine standard group; p-value calculated by One-way ANOVA followed by Tukey’s post-hoc test).
3. Effect on Lipid Profile
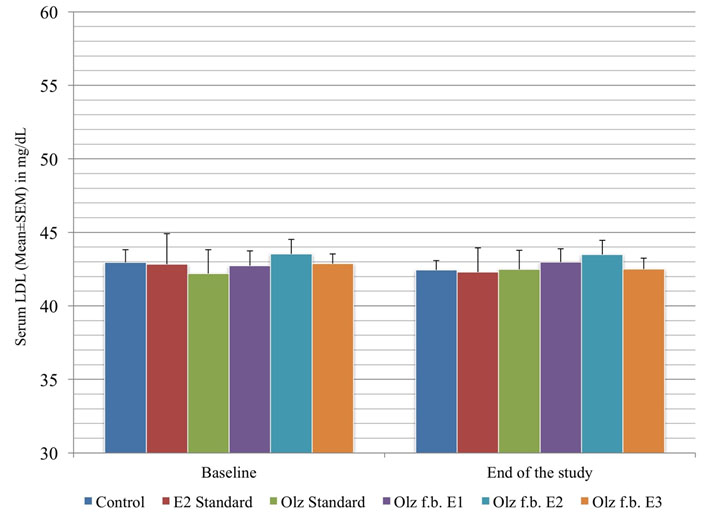
[Table/Fig-6] shows the baseline HDL and LDL levels of the rats in all the different experimental groups. The values were all comparable, and there were no statistically significant differences (p>0.05) among them.
HDL and LDL level comparison of the different experimental groups.
| S. No. | Group (n=6) | Baseline HDL in mg/dl (Mean±S.E.M.) | HDL at the end of the study in mg/dl (Mean±S.E.M.) | Baseline LDL in mg/dl (Mean±S.E.M.) | LDL at the end of the study in mg/dl (Mean±S.E.M.) |
|---|
| 1 | Control | 43.15±0.89 | 43.54±0.50 | 42.95±0.88 | 42.45±0.68 |
| 2 | E2 Standard | 43.97±2.09 | 43.69±1.63 | 42.83±2.07 | 42.29±1.66 |
| 3 | Olz Standard | 43.57±0.50 | 42.74±0.75 | 42.20±1.62 | 42.48±1.29 |
| 4 | Olz f.b. E1 | 43.42±0.87 | 43.24±0.64 | 42.74±0.81 | 42.98±0.64 |
| 5 | Olz f.b. E2 | 42.40±1.23 | 42.42±0.80 | 43.53±0.86 | 43.49±0.81 |
| 6 | Olz f.b. E3 | 42.68±0.71 | 42.72±0.86 | 42.87±0.93 | 42.50±0.97 |
(n – number of animals in each group; S.E.M. – Standard Error of Mean) (p>0.05 as calculated by One-way ANOVA followed by Tukey’s post-hoc test).
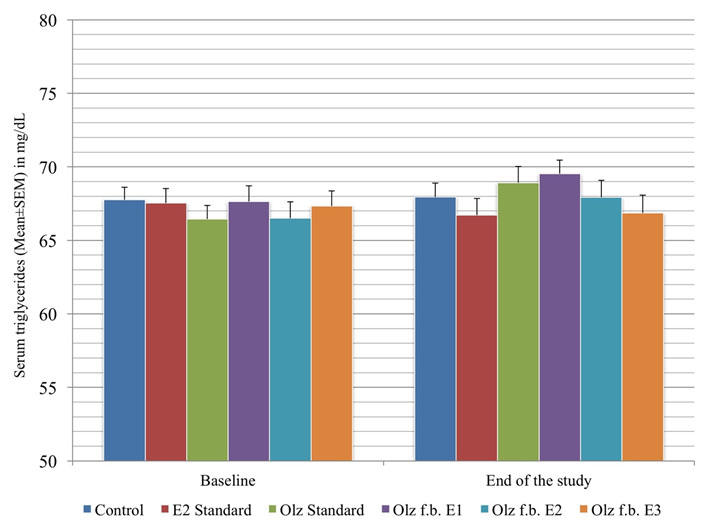
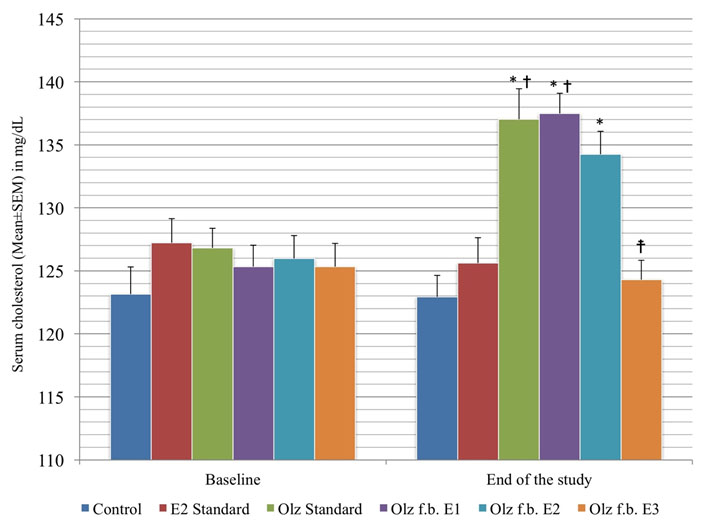
[Table/Fig-7] shows the baseline triglycerides and total cholesterol levels of the rats in all the different experimental groups. The values were all comparable, and there were no statistically significant differences (p>0.05) among them.
Triglyceride and total cholesterol level comparison of the different experimental groups.
| S. No. | Group (n=6) | Baseline triglycerides in mg/dl (Mean±S.E.M.) | Triglycerides at the end of the study in mg/dl (Mean±S.E.M.) | Baseline total cholesterol in mg/dl (Mean±S.E.M.) | Total cholesterol at the end of the study in mg/dl (Mean±S.E.M.) |
|---|
| 1 | Control | 67.76±0.84 | 67.94±0.90 | 123.16±2.14 | 122.94±2.32 |
| 2 | E2 Standard | 67.53±1.00 | 66.72±1.13 | 127.22±1.93 | 125.62±2.02 |
| 3 | Olz Standard | 66.45±0.93 | 68.92±1.11 | 126.81±1.57 | 137.04±2.40 *† |
| 4 | Olz f.b. E1 | 67.65±0.92 | 69.53±0.93 | 125.33±1.67 | 137.49±2.15 *† |
| 5 | Olz f.b. E2 | 66.52±1.37 | 67.93±1.15 | 125.98±1.83 | 134.24±1.77 * |
| 6 | Olz f.b. E3 | 67.34±0.99 | 66.86±1.15 | 125.33±2.50 | 124.29±1.93‡ |
[n – number of animals in each group; S.E.M. – Standard Error of Mean](* denotes p>0.05 versus control group; † denotes p>0.05 versus enalapril standard group; ‡ denotes p>0.05 versus olanzapine standard group; p-value calculated by One-way ANOVA followed by Tukey’s post-hoc test)
Therapeutic administration of enalapril
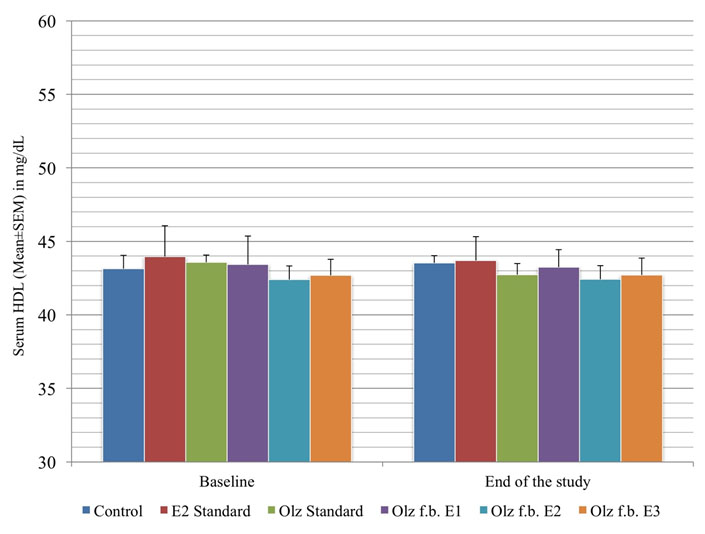
As in [Table/Fig-6], enalapril did not have statistically significant effect on the levels of HDL and LDL (p>0.05), when given after MS was induced by olanzapine. However, it is to be noted that there was no significant shift in the HDL and LDL profiles of the olanzapine standard group, when compared with the control group (p>0.05).
As in [Table/Fig-7], enalapril, given alone or after olanzapine therapy, did not have any statistically significant effect on the triglyceride levels, when compared with the control group (p>0.05). However, olanzapine itself did not produce any rise in triglyceride levels, as evidenced from the olanzapine standard group, compared with the control group (p>0.05). 20 mg/kg/day of enalapril (E3), when given after olanzapine, brought about a drop in the total cholesterol levels, when compared with the olanzapine standard group (124.29±1.93; p=0.002), and was comparable to the levels in the control group (122.94±2.32; p=0.997). But the other two doses of enalapril (E1 - 137.49±2.15; p=1.000 and E2 - 134.24±1.77; p=0.933) did not show any significance fall, when compared against the olanzapine standard group.
[Table/Fig-8,9,10 and 11]-HDL, LDL, triglycerides, TC show the comparison of serum lipid profile in the different groups.
Inter group comparison of serum HDL levels.
Inter group comparison of serum LDL levels.
Inter group comparison of serum triglyceride levels.
Inter-group comparison of total serum cholesterol levels.
(* denotes p>0.05 versus control group; † denotes p>0.05 versus enalapril standard group; ‡ denotes p>0.05 versus olanzapine standard group; p-value calculated by One-way ANOVA followed by Tukey’s post-hoc test).
To summarize the results, 20 mg/kg/day of enalapril (E3 group) could treat or reverse the rise in the body weight, blood glucose and total cholesterol, without altering the levels of HDL, LDL and triglycerides.
Discussion
The study was done to assess the effect of enalapril on total body weight, blood glucose and serum lipid profile. The hypertensive component of MS was not assessed, as it is well known that enalapril is an effective anti hypertensive agent, and is generally a preferred first line agent in treating the same [11,12].
The rodent model used in the study was olanzapine induced MS, wherein olanzapine at a dose of 2 mg/kg/day was given intra-peritoneally for three weeks. At the end of three weeks, the total body weight was found to be significantly elevated, probably due to increased feeding and decreased locomotor activity caused by sedation. Similar results were observed when olanzapine was used to induce weight gain, in other studies like those of Arjona et al., (administered for a duration of ten days) [13], Fell et al., (administered for a period of three weeks) [14], and Pouzet et al., (administered for a duration of three weeks) [15]. Similarly, a statistically significant rise in the blood glucose levels was also observed at the end of three weeks of olanzapine injection. This was also consistent with previous studies in which olanzapine was used to induce hyperglycaemia [16–18]. The total serum cholesterol and triglyceride levels were also significantly elevated at the end of three weeks. Similar results have been reported by earlier studies [19,20]. In the present study, the levels of HDL and LDL were not significantly changed as compared to the baseline. The same has been experienced in a few studies done earlier [20,21]. The reason for this partial modification in the lipid profile is unclear.
Enalapril at the dose of 20 mg/kg/day for three weeks reversed the total body weight, which was raised by the olanzapine therapy. The weight of the rats at the end of enalapril therapy was comparable with the baseline value. The group that received 10 mg/kg/day for three weeks did not exhibit reversal of the body weight changes. However, the drug prevented any further rise in the body weight from the time of administration of enalapril. In contrast, the 1 mg/kg/day group showed a continuing trend towards a rise in the body weight till the end of the study.
Frantz et al., reported that enalapril at a dose of 30 mg/kg/day in mice showed similar changes in body weight [22]. Santos et al., analysed the effect of enalapril (10 mg/kg/day) on weight gain and documented that decrease in weight gain, when compared against control, was experienced [23]. However, a study by Radin et al., showed that enalapril (9.8 mg/kg/day) had brought about no significant changes in the weight of obese rats [24]. The mechanism behind body weight reduction by enalapril could involve Peroxisome proliferator-Activated Receptor-γ (PPAR-γ) modulation. PPAR-γ is lipolytic in nature, and hence, could play a major role in weight reduction. In addition, PPAR-γ has been known to upregulate the levels of Hormone-Sensitive Lipase (HSL), which in turn is an important neutral lipase present intracellularly [23]. Also, a reduction in the accumulation of visceral and subcutaneous fat plays a role [25]. Further, an increase in the locomotor activity may be seen following ACEI treatment, which in turn facilitates weight loss [26].
Similar results were observed in terms of the rise in blood glucose levels. While the high dose (20 mg/kg/day) group brought the glucose level back to normal (baseline level), the mid dose (10 mg/kg/day) group merely prevented further rise of the value (after three weeks of olanzapine), and the low dose (1 mg/kg/day) group still had an increase in glucose levels at the end of the study period.
Similar results were published in two previous studies that used 20 mg/kg/day of enalapril [27,28]. Although there may be several factors that play a role in the emergence of hyperglycaemia, oxidative stress plays a significant role in both MS and Type 2 DM. ACEIs, as explained earlier, possess a clear antioxidant role, thereby, eliminating the oxidative stress cited above [29,30]. In addition, it has also been hypothesized that activation of kallikrein-kinin system by the ACEIs could be responsible for an increase in peripheral utilization of glucose. This has been tested using local bradykinin accumulation at the muscular level [31]. However, direct receptor-mediated actions of ACEIs cannot be ruled out.
When enalapril at a high dose of 20 mg/kg/day was given following the induction of MS, reversal of hypercholesterolaemia was seen at the end of the treatment period. Enalapril at 10 mg/kg/day did not have this effect, but it prevented a further rise in total cholesterol and triglycerides. However, in the 1 mg/kg/day group, the rise continued to occur even after initiation of enalapril therapy.
A study conducted with enalapril at a dose of 5 mg/kg/day for duration of 12 weeks showed fall in total cholesterol and triglyceride levels, as compared to the untreated diabetic rats. However, a fall in the serum LDL was also observed, which was not seen in the present study [32]. When enalapril (20 mg/kg/day) was used along with danazol in another study, the former prevented the rise in total cholesterol and triglycerides that were seen with the latter [33]. But, in yet another rodent study, enalapril (10 mg/kg/day) did not alter the baseline levels of total cholesterol or triglycerides, when given for two weeks [34]. The mechanism could be linked to reduction of sympathetic activity by the Renin Angiotensin Aldosterone System (RAAS) inhibitors, or due to their direct effect on the lipid cascade [32]. Previous studies have shown that enalapril and other ACEIs reduce the levels of ApoB in the serum. ApoB is the chief apoprotein of LDL and VLDL cholesterol. Further, normalization of insulin control may also play a role in managing hyperlipidaemia [35].
A recent study with enalapril/lercanidipine combination has also shown promise in the management of obesity related hypertension [36].
Limitation
Plasma insulin levels were not assessed, which could reflect a more accurate assessment of the status of insulin resistance. Only Wistar rats were utilized in this study. The study may be extended to the other animal species in the future. Also, only one ACEI (enalapril) was used as an intervention. The other ACEIs and ARBs can also be studied in a similar fashion, and correlated with the results of the present study. Further, the antihypertensive action of enalapril was considered to be well established, and hence was not assessed in this study. The exact mechanism by which enalapril has a beneficial role in MS at high doses was not assessed. Lastly, the study duration may have been too short for the low and moderate doses of enalapril to show positive effects.
Conclusion
MS is a condition that requires utilization of multiple drugs owing to the constellation of features like hyperglycaemia, weight gain, hyperlipidaemia and hypertension. Thereby, there is a huge pill load on the patient, which may lead to incompliance. Currently, enalapril is used only for the management of the hypertensive component of MS. Based on the results obtained in the current study, we conclude that high dose of enalapril can be considered part of therapeutic regimens for management of weight gain, hyperglycaemia and dyslipidaemia seen in MS. Further pre clinical and clinical studies may be required to check for similar properties with the other ACEIs (like ramipril, lisinopril, etc.,) and ARBs (like losartan, telmisartan, etc.,).