Childhood obesity is a global public health challenge which shows widespread rising trends of prevalence over the past decades, especially in developing countries [1,2]. The World Health Organization estimated that in 2013 there were over 42 million children under the age of five who were overweight, and nearly 31 million of them lived in developing countries [3]. In Thailand, the estimated national prevalence of children who were overweight or obese was reported at around 20%, which shared the same increasing trend as the regional and global prevalence [4].
Preventing excessive weight gain is widely accepted as the important strategy to combat with the rising problems of obesity, since once children become obese, treatment is more difficult [5]. School based intervention in the form of obesity prevention programs is a promising approach to reach a large percentage of at risk population, because children spend the majority of time at school [6]. Using computer based technology to deliver education, support and self monitoring is a promising method. Internet based intervention has been found to be attractive because of its interactive nature compared to other media [7–9]. Moreover, there is a capability to standardize content and a potential to reach a large number of subjects with a relatively reasonable cost, and to receive immediate feedback [10]. Several studies, with a high variation in study setting, conducted to test the efficacy of school based internet obesity prevention programs for children have shown inconsistent results [11–15]. The majority of the previous studies indicated that school based internet program results in significant improvements in health behaviours, however, the recorded impacts on BMI are mixed. To date, there is no similar study done on Thai children. Therefore, the present study was conducted to investigate the efficacy of internet based school program to control the rising prevalence of obesity and excessive weight gain in Thai school children.
Materials and Methods
A randomized control trial was conducted of school children studying in Grade 1 to 6 of public elementary schools in Portan township of Ongkharak district, Central Thailand, over the course of November 2014 to February 2015. Portan township, with a population of 4,513 (November 2014), is 14 kilometres from Srinakharinwirot University Ongkharak campus. There are two public elemental schools in Portan. All healthy children who were studying in Grade 1 to 6 of these schools were eligible for the study. The study was approved by the Human Ethic Committee of Srinakharinwirot University. The study purpose was explained to children verbally and a study information sheet was sent to their parents or guardians. Written informed consent and assent were obtained from children’s parent or guardians and participating children, respectively, before they were recruited. Exclusion criteria were: (1) children with a known history of chronic illness; (2) children who could not stand upright or bear weight on their legs for measuring actual height and weight; or (3) children who had a Body Mass Index (BMI) lower than -1SD based on World Health Organization references [16]. This study has been registered with the Thai Clinical Trials Registry (TCTR20140926002).
Study design
After enrolment, demographic data and anthropometric characteristics of children were collected by trained research assistants. Weight was measured to the nearest of 100 g using an electronic scale. Height was measured without shoes to the nearest millimetre using a height rod. Waist circumference was measured at the midpoint between the lower costal margin and the top of the iliac crest using a non stretch tape in a standing position. Hip circumference was measured using a non stretch tape over the maximum circumference of the buttock. BMI was calculated as the ratio of weight (kg) to square of height (m). Waist to height ratio (WHtR) was calculated as the ratio of waist circumference (cm) to height (cm).
Children were randomly assigned to the intervention group or the control group. Children in the intervention group (Internet-based program) were shown how to use the program by research assistants and received a login name and password which granted them access to the program. The contents of the program consisted of personal data collection, anthropometric variables and the interpretation of nutritional status as normal, overweight or obese, information related to healthy nutrition, food habits and physical activity. Information presented over the internet included text and graphics. Information related to healthy nutrition such as daily amounts of each food group, portion and serving sizes was instructed to individual child based on their nutritional status [17]. Participants were encouraged to have daily physical activity for at least 60 minutes per day. However, the 60-minute activity did not need to be done all at once but could be broken down into shorter blocks of time. The examples of physical activities were provided as appropriate for age such as active play for fun was advised for younger children and moderate to vigorous intensity activities were advised for older children.
At the beginning of the study, research assistants demonstrated the software and help children to put individual anthropometric variables into the program. The nutritional status of children was interpretation based on the BMI, based on gender- and age-specific BMI criteria of the WHO as normal (-1SD<BMI≤1SD), overweight (1SD <BMI ≤2SD) and obese (BMI >2SD) [16].
Informed knowledge of proper healthy diet and physical activities and sedentary behaviours were provided to the children based on their nutritional status. The interpretation of nutritional status, recommendation of daily amounts of portion and serving sizes of each food groups were showed on the computer screen. Teachers might give some explanation of meaning to young children. Children in the intervention group were encouraged to log into the program as often as possible. However, weight and height of children were measured by their teachers and filled the data in the program monthly. After compiling the data, the program calculated the current nutritional status and provided the trends of weight and BMI changes to children.
Children in the control group had their anthropometric variables measured by trained research assistants, the same as in the intervention group. Individual nutritional status was interpreted and informed knowledge of proper healthy diet, physical activities and sedentary behaviours were advised by trained research assistants. Children in the control group were asked to measure weight and height by their teachers monthly and record the information in the report form. At the end of the fourth month, children in both groups were measured by weight, height, waist and hip circumference by the same trained staff as at the beginning of the study.
The primary outcome was changes in the percentage of overweight and/or obese children at the end of study. Changes in BMI and other anthropometric parameters were assessed as secondary outcomes. We estimated that with 93 participants per group, we would be able to detect decreased percentage of obesity in the intervention group by 20% compared to the control group with 80% power and a two-tailed alpha error of 0.05. We plan to enroll 103 participants per group to account for a possible 10% follow up loss.
Statistical Analysis
The normality of distributions of continuous variables was assessed using the Kolmogorov-Smirnov test. Normally distributed variables were descriptively presented as means and standard deviations whereas non-normally distributed variables were descriptively presented as medians and Interquartile Ranges (IQR). The Pearson chi-square or the Fisher-exact test was used, where appropriate, to compare proportions between the groups. Student’s t-test and the Mann-Whitney U-test were employed to determine the significant difference of the normally distributed and non-normally distributed variables of the two groups, respectively. A paired t-test was used to compare the z-score changes of weight, height and BMI at the end of study from their baselines. Statistical analysis was performed using the computer software SPSS (version 16.0, SPSS, Chicago, IL, USA). A p-value <0.05 was considered statistically significant.
Results
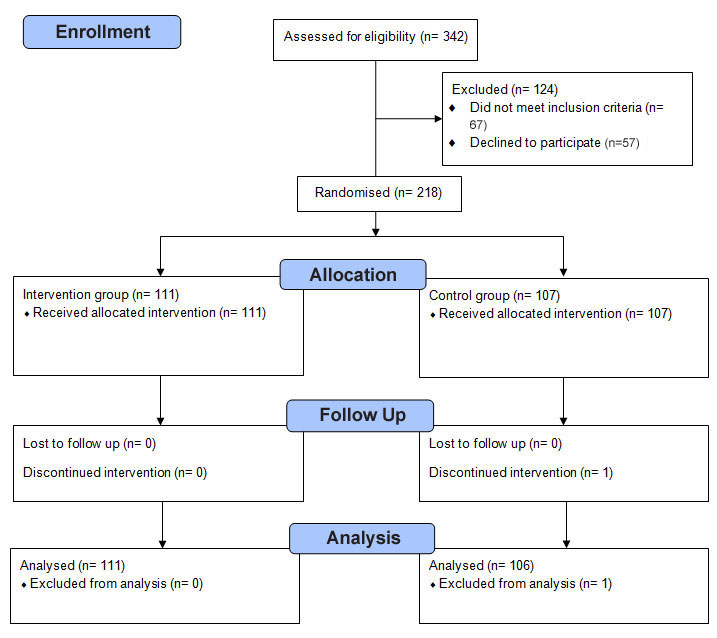
Of the 342 children who were invited, 57 declined to participate to the study. Of the remaining 285 children, 67 children had a BMI lower than-1SD of the standard gender- and age matched BMI and were excluded from the study. Of the remaining 218 children participating in the study, 111 and 107 children were randomly assigned using a computerized program (GraphPad QuickCals) to the intervention group and control group, respectively. During the study periods, one participant moved out from the school and was excluded from the analysis. All of the remaining participants were follow up through the end of study and data of all 217 children were included in the final analysis [Table/Fig-1].
Study flow chart and enrolment.
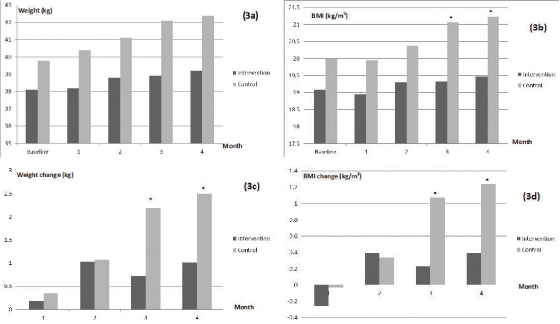
Among the 217 participants, 106 (49%) were male with the mean age of 10.7 years (SD 3.1 years). The median weight and BMI of the participants were 35.2 kg (IQR 26.0 to 48.3 kg) and 18.36 kg/m2 (IQR 16.08 to 22.09 kg/m2), respectively. Overall prevalence of being overweight and obesity was 23.5% and 19.8%, respectively. Prevalence of being overweight and obesity in children in the intervention group was 21.6% and 17.1%, respectively, whereas, the prevalence in the control group was 25.5% and 22.6%, respectively (p-value=0.365). There were no significant differences in baseline age, weight, height, BMI, waist and hip circumference and nutritional status between the two groups. Baseline demographic and anthropometric characteristics of each group are detailed in [Table/Fig-2]. Body weight and BMI of both groups continually increased during the study. There were no significant differences in body weight and BMI at each follow up month between groups except that the control group had significant higher weight and BMI at the third and the fourth month than the intervention group. The net weight gains and BMI gains from the baseline in the control group were significant higher than those in the intervention group at the third month (weight gain 2.2 kg vs. 0.7 kg, p-value=0.008; BMI gain 1.07 kg/m2 vs. 0.23 kg/m2, p-value=0.027) and the fourth month of the study (weight gain 2.4 kg vs. 1.0 kg, p-value=0.008; BMI gain 1.24 kg/m2 vs. 0.40 kg/m2, p-value=0.027) [Table/Fig-3].
Baseline demographic and anthropometric characteristics of the study population present as mean (SD) unless otherwise indicated.
| Participant Characteristics | Intervention(n= 111) | Control(n= 106) | p-value |
|---|
| Male, n (%) | 52 (46.8) | 54 (50.9) | 0.588 |
| Age, year | 10.2 (3) | 10 (3.1) | 0.691 |
| Weight (kg) | 37 (24.6 to 47.0)* | 34 (26.7 to 49.9)* | 0.785† |
| Weight z-score | 0.32 (1.22) | 0.62 (1.36) | 0.092 |
| Height (cm) | 138.3 (17.6) | 137.8 (17.6) | 0.818 |
| Height z-score | -0.14 (1.01) | -0.2 (1.06) | 0.381 |
| Body mass index (kg/m2) | 18.12 (16.10 to 20.61)* | 18.40 (15.95 to 23.11)* | 0.450† |
| Body mass index z-score | 0.63 (1.22) | 0.92 (1.43) | 0.113 |
| Nutritional status, n (%) | | | 0.365 |
| Normal | 68 (61.3) | 55 (51.9) | |
| Overweight | 24 (21.6) | 27 (25.5) | |
| Obesity | 19 (17.1) | 24 (22.6) | |
| Waist circumference (cm) | 63.5 (56.0 to 72)* | 65.0 (56 to 77)* | 0.503† |
| Hip circumference (cm) | 77.1 (13.9) | 78.7 (14.3) | 0.408 |
| Waist to height ratio | 0.47 (0.06) | 0.49 (0.07) | 0.099 |
*Presented as median (IQR); †Mann-Whitney U-test
Comparison of weight: a) BMI; b) and changes in weight; 3c) and BMI; d) during the study between the study groups.
*Significant difference from control group (p-value<0.05)
At the end of the study, children in the control group had significantly higher BMI, BMI z-score, weight z-score and waist-to-height ratio than the children in the intervention group [Table/Fig-4]. There was a significant higher percentage of being overweight and/or obesity in the control group than in the intervention group (56.6% vs. 39.6%, respectively; p-value=0.009). Compared to their baseline, children in the intervention group had no changes in weight z-score (-0.04, 95%CI -0.16 to 0.07, p-value 0.438) and BMI z-score (-0.001, 95%CI -0.19 to 0.18, p-value=0.988) at the end of the study. Contrary to the intervention group, children in the control group had significant increases in weight z-score (0.25, 95%CI 0.11 to 0.39, p-value<0.001) and BMI z-score (0.45, 95%CI 0.27 to 0.63, p-value<0.001) at the end of the study.
Anthropometric characteristics of the study population at the end of study present as mean (SD) unless otherwise indicated.
| Participant characteristics | Intervention(n= 111) | Control(n= 106) | p-value |
|---|
| Weight (kg) | 37.8 (26 to 48.1)* | 36.3 (29.5 to 57.1)* | 0.324† |
| Weight z-score | 0.28 (1.34) | 0.87 (1.3) | 0.001 |
| Height (cm) | 138.9 (17.5) | 138.3 (17.7) | 0.798 |
| Height z-score | -0.17 (0.99) | -0.16 (1.06) | 0.427 |
| Body mass index (kg/m2) | 18.26 (16.19 to 21.23)* | 19.44 (17.21 to 24.06)* | 0.006† |
| Body mass index z-score | 0.63 (1.53) | 1.37 (1.35) | <0.001 |
| Nutritional status, n (%) | | | 0.038 |
| Normal | 67 (60.4) | 46 (43.4) | |
| Overweight | 21 (18.9) | 32 (30.2) | |
| Obesity | 23 (20.7) | 28 (26.4) | |
| Waist circumference (cm) | 67 (59 to 73)* | 68 (59 to 79.1)* | 0.310† |
| Hip circumference (cm) | 78.5 (14.3) | 80 (13.7) | 0.429 |
| Waist to hip ratio | 0.49 (0.06) | 0.51 (0.07) | 0.031 |
*Presented as median (IQR); †Mann-Whitney U-test
Discussion
The present study demonstrates that the internet based obesity prevention program was effective in modifying anthropometric parameters and could control the increasing prevalence of being overweight and/or obesity in Thai school children in the short term (four months). Children in the intervention program were relatively stable in the adjusted weight and BMI z-score during the four month study whereas the non intervention children had increases in weight z-score and BMI z-score during the same follow up period. Prevalence of overweight/obesity was also significant increased in the non intervention group as 9 (8.5%) children who were of normal status turned to overweight/obese compared to 1 (0.9%) child in the intervention group.
Prevention is generally advocated as an important strategy to combat the rising prevalence of childhood obesity [18,19]. Recently, the target of obesity prevention is to modify unhealthy lifestyle behaviours such as unhealthy dietary habits and being less physically active are found to contribute to the risk of childhood obesity [20]. However, the number of effective obesity prevention strategies is limited [8]. Internet based prevention programs is one of the promising health communication techniques to promote healthy behaviours [14]. It can prove attractive with interactive interfaces and reach a large number of children with the capability for standardised content. A school based approach is also suitable for providing obesity prevention programs to children as they stay approximately 6-8 hours per day at school and usually has 1-2 meals a day at school. Moreover, schools have an infrastructure such as computers, internet accessibility and can provide obesity prevention education as a part of course curriculum. Systematic reviews indicated that Internet based obesity prevention results in significant improvements in knowledge, self efficacy and health behaviour, especially in a short term follow up; however, the impact on BMI is inconclusive [7,8,21].
The present finding of effective control of weight and BMI by computer based intervention was consistent with previous studies [12]. Casazza K et al., conducted a three month study in adolescents aged 13-18 years [12]. They found that adolescents in the computer based intervention group showed significant reduction in BMI score from pre to post-intervention (23.1±0.7 to 22.9±0.7 kg/m2; p-value<0.001), whereas, the traditional education group had no significant change in BMI score and the control group had significant increase in BMI score. Even though the computer based intervention group in the present study had increased in gross weight and BMI score at the end of study by 1.0 kg and 0.4 kg/m2, respectively, the adjusted age and gender-matched weight z-score and BMI z-score were decreased. On the other hand, some studies reported inconsistent results of efficacy of computer-based intervention regarding obesity prevention. Long JD et al., reported that the web based nutrition education in school children aged 12-16 years led to significant improvement of dietary knowledge compared to the traditional classroom education, however, both groups had increased BMI scores at the end of study [13].
This study had a limitation in that the efficacy of the program was evaluated in a very short term, at the end of four month follow up. Whittemore R et al., reported that the two different school based Internet programs showed improved health behaviour such as increased physical activity, healthy eating, and a decrease in sedentary behaviour, however, there was no effect on BMI score [14]. Ezendam NP et al., reported the efficacy of school based internet programs in promoting healthy eating but no effects on improvement in sedentary behaviours, BMI and waist circumference [11].
Contrary to previous studies that evaluated the benefit of obesity prevention programs by measuring the change in BMI, we evaluated the efficacy of the intervention program by measuring the change of weight z-score and BMI z-score, which were adjusted for age and gender. In general, weight and BMI score were simultaneously changed with increased age and the cut off levels of BMI for diagnosis of overweight or obesity in children vary with age and gender [22]. Though, BMI is commonly used to characterize obesity, using it alone to evaluate the efficacy of the program may result in under- or over-estimation of the outcomes [11–14]. The present study’s method as described above decreased the confounding factor of growing age. Even though increases in weight and BMI were observed during the follow up period, the weight z-score and BMI z-score were relatively unchanged in the intervention group compared to the control. Additionally, the prevalence of being overweight/obesity, which was assessed according to the cut off levels of BMI z-score, was decreased in the intervention group. All of these findings showed the usefulness of the internet based programs for the reduction of obesity risk in Thai children.
Studies on self reported physical activity and dietary records often have limitations due to their potential lack of precision, validity and reliability, particularly when applied in children [23,24] due to their limited cognitive abilities [25]. However, a recent systematic review found that school based Internet obesity prevention program had successful improvement in dietary behaviour and/or physical activity, regardless of theoretical perspective, content, or number of modules [7]. We believed the present internet based obesity prevention program also helped to promote healthy behaviours, as seen in other studies, and led to the improvement of anthropometric indices.
Limitation
The present study had some limitations. The study had a small sample size from one township in Central Thailand. Therefore, the results may not be generalized to other populations which have socioeconomic differences. The present study did not evaluate the outcomes of dietary behaviour and physical activity after the intervention due to concern of the validity and reliability of data. Finally, there might be concern about accuracy of data during inter-study follow up due to assessment by their teachers. However, we choose to use anthropometric data at the beginning and the end of study which measured by the same research assistance for assessment of the efficacy of the program at the time of study analysis.
Conclusion
This study indicates that the internet based obesity prevention program was effective in modifying anthropometric outcome measures and helped to address the rising prevalence of being overweight and obesity in Thai children. Further studies with larger sample sizes, long term follow up and broader geographical coverage are needed to better examine the efficacy of this prevention program for the whole country.
Role of Funding Source: The study sponsor had no role in the planning, execution or analysis of the study.
Author Contribution
Both authors defined and developed the initial research idea. Both authors were also involved in designing and implementing the study, as well as analysis of the results, interpretation, and writing the manuscript.
*Presented as median (IQR); †Mann-Whitney U-test
*Presented as median (IQR); †Mann-Whitney U-test