Colorectal Carcinoma (CRC) is the third most prevalent type of cancer in the world with the disease incidence rising with advanced age [1]. CRC represents the second leading cause of cancer death in western societies [2]. In Egypt, the prevalence of CRC is 2.27% and that of rectal carcinoma is 2.08% [3].
In the Cancer Stem Cell (CSC) paradigm, cancers originate from uncommon cells that show pluripotency and self-renewal. CSC was first identified in leukemias and in solid tumours [4].
A promising new marker for CSC is aldehyde dehydrogenase 1 (ALDH1) which is a member of a family of intracellular enzymes that are involved in cellular proliferation, differentiation, detoxification, and drug resistance through the oxidation of cellular aldehydes [5].
Materials and Methods
This retrospective study is complementary to a study done by the same authors on CD44 and previously accepted in Menoufia medical journal [7]. The current study included 71 cases divided into 49 CRC, 13 adenoma and 9 normal cases (obtained from cases diagnosed as Hirschsprung disease). The cases were collected from the Pathology Department, Faculty of Medicine, Menoufia University, during the period from 2011 to 2015. The clinicopathological data were collected from patients’ records and survival data were available for 31 out of 49 of the studied colorectal carcinoma cases.
Histopathological Evaluation
The Haematoxylin and Eosin (H&E)-stained sections were evaluated for histological type, according to Hamilton et al., [8]. Tumour grading was assessed based on gland formation, either low grade (≥50% gland formation) or high grade (<50% gland formation) [9]. The mitotic figures in tumour cells were counted in 10 randomly selected high-power fields [10]. Similarly, apoptosis was counted in 10 high-power fields [11]. Lymphovascular invasion was assessed [12]. Pathologic staging of the tumour was performed according to TNM American Joint Committee on Cancer-Union International Center [13], as well as modified Dukes’ staging system [14].
Immunohistochemical Staining
One section, 4μm in thickness, from each case was stained for ALDH1. Negative control slide (omitting the primary antibody) and positive tissue control (normal kidney) were included in each run of staining.
The method used for immunostaining was streptavidin-biotin amplified system. The primary antibody used was rabbit polyclonal antibody against ALDH 1 (Biotechnology, Cambridge, ab50581 UK, CA), with a dilution of 1:200.
The detection Kit used was Ultra Vision LP detection system anti-polyvalent HRP/DAB (catalog #TP-015-HD) (Lab vision, USA). In this system, two reagents were utilized: The biotinlated secondary anti-immunoglobulin which is a purified goat polyvalent anti-mouse IgG capable of binding to both the primary antibodies and the streptvidin-biotin enzyme complex.
The reaction was visualized by substrate/chromogen Diaminobenzidine (DAB) reagent.
ALDH 1 Immunostaining Interpretation
ALDH1 expression was assessed in tumour cells, stromal cells and normal cells. Cytoplasmic expression is required to assign positive expression. The staining was scored according to cytoplasmic staining of the cancer cells. The degree of staining was evaluated using a four-score grading system. Cases with <5% ALDH1-positive cells were given a score of 0, those with 5-20% ALDH1-positive cells were given a score as 1, those with 20-50% positive cells were scored as 2 and those with >50% positive cells were scored as 3 [15].
For statistical analysis, cases were divided into two groups: Low expression (with scores of 0 or 1) and high expression (with scores of 2 or 3) [15].
The proportion of cells that stained were multiplied with their corresponding staining intensity, then summated for the total H-score (maximum 300) [16]. H-score was applied as per the intensity of antibody staining (0 = no staining, 1 = minimal staining, 2 = moderate staining, 3 = intense staining). Stromal expression of ALDH1 was evaluated as positive or negative [17].
Overall Survival Data
Data about overall survival and disease free survival were available for 31 out of 49 patients (63.3%). Overall survival was calculated for the data of diagnosis till last visit or death of patient. Recurrence free survival was calculated for the data of surgery till the last visit or recurrence.
Statistical Analysis
Data were collected, tabulated and statistically analyzed in terms of mean±SD, percentages, Chi- square test (χ2- test), Fisher’s-exacts test (F), Kruskal wallis test (K), Mann-Whitney test (U) and Kaplan–Meier test by using SPSS “statistical package for the social science” program for windows, version 21, SPSS, INC., Chicago, Illinois, USA. p≤0.05 was considered to indicate statistical significance in all tests.
Results
The clinicopathological characteristics of adenoma and colorectal carcinoma patients are shown in [Table/Fig-1,2].
Clinico-pathological data of the studied adenoma cases.
| Variables | Number (Percentage) |
|---|
| Age |
| Mean±SD | 55.38±10.75 |
| ≤ 45 | 3(23.1%) |
| > 45 | 10(76.9%) |
| Sex |
| Male | 9(69.2%) |
| Female | 4(30.8%) |
| M:F | 1:0.4 |
| Type |
| Tubular | 9(69.2%) |
| Villous | 3(23.1%) |
| Tubulovilllous | 1(7.7%) |
| Dysplasia |
| Low grade | 7(53.8%) |
| High grade | 6(46.2%) |
M: F=male to female ratio, SD= Standard deviation.
Clinico-pathological data of the studied colorectal carcinoma cases.
| Variables | Number | Percentage |
|---|
| Age | | |
| Mean±SD | 53.27±13.57 | |
| Range | 23-75 | |
| ≤ 45 | 14 | 28.6% |
| > 45 | 35 | 71.4% |
| Sex | | |
| Male | 19 | 38.8% |
| Female | 30 | 61.2% |
| M:F: | 0.6:1 | |
| Size | | |
| Mean±SD | 6±3.14 | |
| ≤ 5 | 27 | 55.1% |
| > 5 | 22 | 44.9% |
| Site | | |
| Left | 24 | 49% |
| Right | 25 | 51% |
| Gross picture | | |
| Fungating | 26 | 53.1% |
| Ulcerating | 20 | 40.8% |
| Annular | 3 | 6.1% |
| Type | | |
| Adenocarcinoma | 40 | 81.6% |
| Mucoid carcinoma | 9 | 18.4% |
| Grade | | |
| I | 1 | 2% |
| II | 39 | 79.6% |
| III | 9 | 18.4% |
| Vascular invasion | | |
| Present | 7 | 14.3% |
| Absent | 42 | 85.7% |
| Necrosis | | |
| Present | 24 | 49% |
| Absent | 25 | 51% |
| Perineural invasion | | |
| Present | 7 | 14.3% |
| Absent | 42 | 85.7% |
| Lymph node invasion | | |
| Present | 21 | 42.9% |
| Absent | 28 | 57.1% |
| N0 | 28 | 57.1% |
| N1 | 13 | 26.5% |
| N2 | 8 | 16.3% |
| Stage | | |
| T1 | 1 | 2% |
| T2 | 11 | 22.4% |
| T3 | 25 | 51% |
| T4 | 12 | 24.5% |
| Modified Dukes stage | | |
| A | 1 | 2% |
| B1 | 4 | 8.2% |
| B2 | 22 | 44.9% |
| C1 | 10 | 20.4% |
| C2 | 12 | 24.5% |
| Mitotic count | | |
| Mean±SD | 8.53±4.45 | |
| Apoptotic count | | |
| Mean±SD | 4.31±3.65 | |
M: F= male to female ratio, SD= Standard deviation.
Immunohistochemical Results of ALDH1
Immunohistochemical results in non-malignant and malignant group have been shown in [Table/Fig-3,4 and 5]. There was no statistical significant association between immunohistochemical expression of ALDH1 and clinicopathological factors of studied adenoma cases.
Immuno-histochemical expression of ALDH1 in non- malignant group.
| Variables | ALDH1 expression |
|---|
| Low (score 0-1) | High (score 2-3) |
|---|
| Normal mucosa (9 cases) | 9(100%) | 0(0%) |
| Normal mucosa adjacent CRC (18 cases) | 13(72.2%) | 5(27.8%) |
| Adenoma (13 cases) | 11(84.6%) | 2(15.38%) |
Immunohistochemical expression of ALDH1 in Colorectal Carcinoma CRC cases.
| Variables | Number (Percentage) |
|---|
| ALDH1 expression | |
| Positive | 37(75.5%) |
| Negative | 12(24.5%) |
| Score of expression | |
| 0 | 12(24.5%) |
| 1 | 4(8.2%) |
| 2 | 6(12.2%) |
| 3 | 27(55.1%) |
| ALDH1 expression | |
| Low expression (0-1) | 16(32.7%) |
| High expression (2-3) | 33(67.3%) |
| ALDH1 H. score | |
| Mean±SD | 105.31±98.07 |
| Median | 100 |
| Range | 0-300 |
| Stromal expression | |
| Positive | 3(6.12%) |
| Negative | 46(93.8%) |
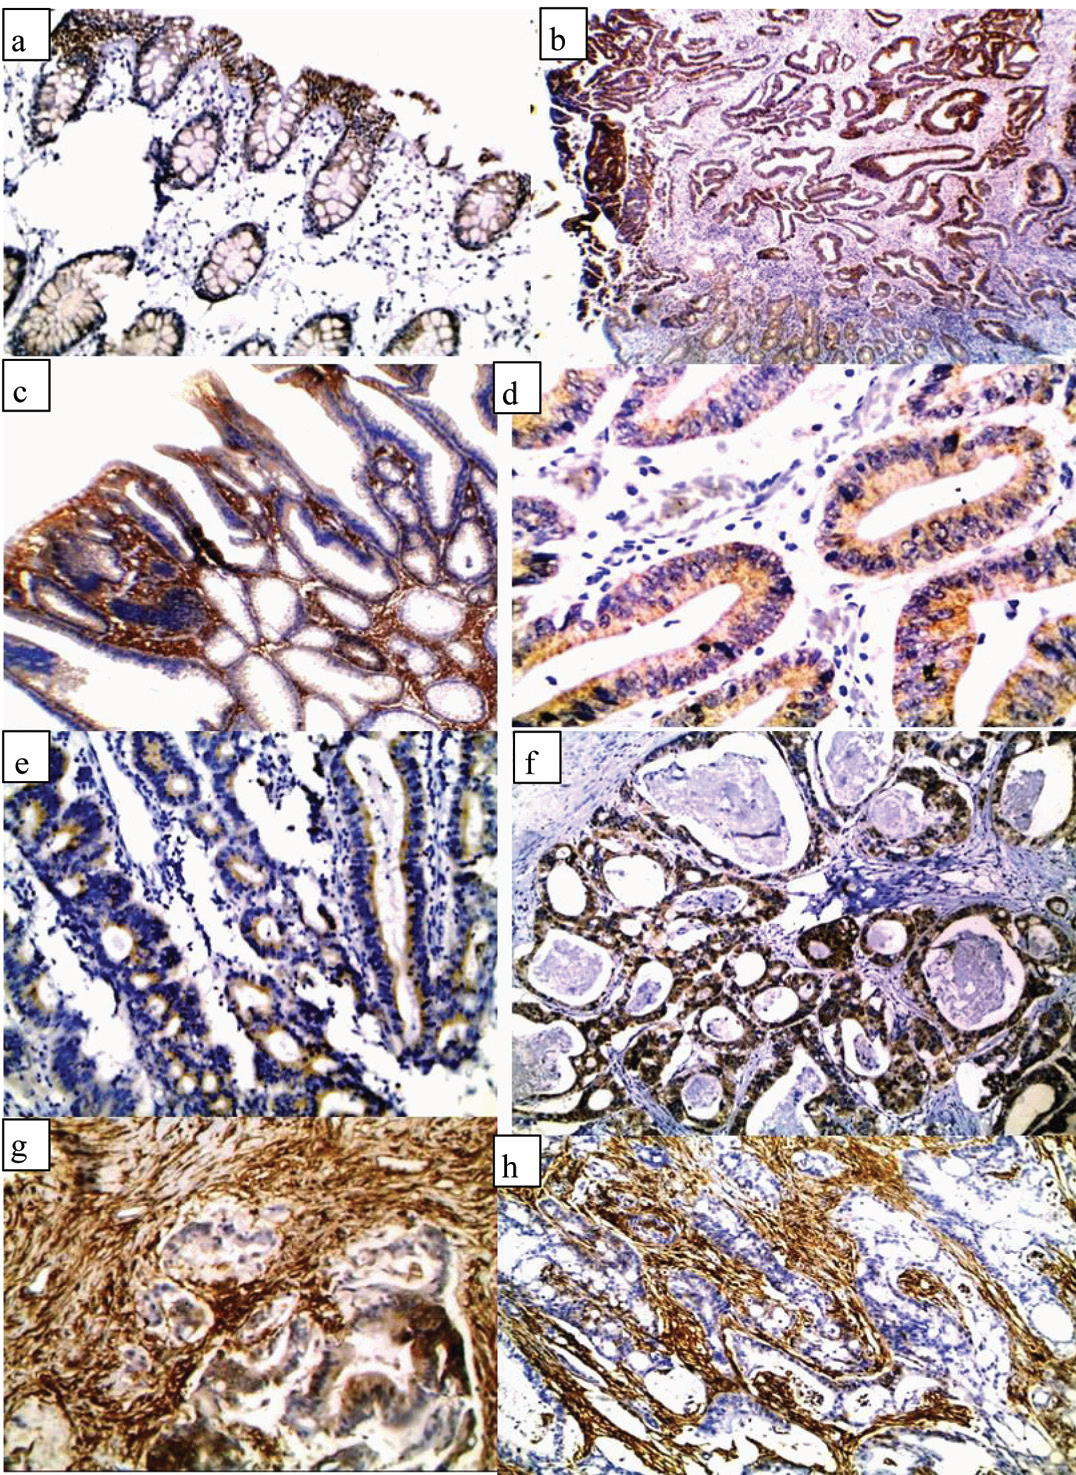
a) normal colonic epithelium showing low expression of ALDH1 (IHCx200); b) A case of moderately differentiated CRC showing high expression of ALDH1 in tumour cells and low expression in adjacent normal epithelium (IHCx100); c) A case of tubulovillus adenoma showing high expression of ALDH1 (IHCx100); d) A case of tubular adenoma showing low expression of ALDH1 (IHCx200); e) A case of moderately differentiated CRC showing low epithelial expression of ALDH1 (IHCx200); f) A case of moderately differentiated CRC showing high epithelial expression of ALDH1 (IHCx200); g) A case of moderately differentiated CRC showing high epithelial and stromal expression of ALDH1 (IHCx200); h) A case of moderately differentiated CRC showing high stromal expression and negative epithelial expression of ALDH1 (IHCx200).
There was a statistically significant association between positivity of ALDH1 and younger age (p=0.003), right sided tumour (p=0.03) and presence of lymph node invasion (p= 0.03) [Table/Fig-6].
Relationship between immunohistochemical expression of ALDH1 and clinicopathologic factors in the studied colorectal carcinoma.
| Variables | Expression of ALDH1 | Test of significance | p-value |
|---|
| Positive | Negative |
|---|
| Age | | | | |
| Mean±SD | 50.51±12.41 | 62.17.±13.7 | u=96.5 | 0.003** |
| ≤ 45 | 12(85.7%) | 2(14.3%) | FE=1.11 | 0.45 |
| > 45 | 25(71.4%) | 10(28.6%) | | |
| Sex | | | | |
| Male | 15(78.9%) | 4(21.1%) | FE=1.98 | 0.74 |
| Female | 22(73.3%) | 8(26.7%) | | |
| Size | | | | |
| Mean±SD | 6.43±3.44 | 4.75±1.73 | u=171.5 | 0.24 |
| ≤ 5 | 18(66.7%) | 9(33.3%) | χ2=2.54 | 0.11 |
| > 5 | 19(86.4%) | 3(13.6%) | | |
| Site | | | | |
| Left | 15(62.5%) | 9(37.5%) | χ2=4.31 | 0.03* |
| Right | 22(88%) | 3(12%) | | |
| Gross | | | | |
| Fungating | 23(88.5%) | 3(11.5%) | χ2=5.09 | 0.08 |
| Ulcerating | 12(60%) | 8(40%) | | |
| Annular | 2(66.7%) | 1(33.3%) | | |
| Type | | | | |
| Adenocarcinoma | 29(72.5%) | 11(27.5%) | FE=1.07 | 0.42 |
| Mucoid carcinoma | 8(88.9%) | 1(11.1%) | | |
| Grade | | | | |
| I | 1(100%) | 0(0%) | χ2=1.49 | 0.48 |
| II | 28(71.8%) | 11(28.2%) | | |
| III | 8(88.9%) | 1(11.1%) | | |
| Vascular invasion | | | | |
| Present | 6(85.7%) | 1(14.3%) | FE=0.46 | 0.67 |
| Absent | 31(73.8%) | 11(26.2%) | | |
| Necrosis | | | | |
| Present | 16(66.7%) | 8(33.3%) | χ2=1.99 | 0.19 |
| Absent | 21(84%) | 4(16%) | | |
| Perineural invasion | | | | |
| Present | 6(85.7%) | 1(14.3%) | FE=0.46 | 0.67 |
| Absent | 31(73.8%) | 11(26.2%) | | |
| Lymph node invasion | | | | |
| Present | 19(90.5%) | 2(9.5%) | χ2=4.45 | 0.03* |
| Absent | 18(64.3%) | 10(35.7%) | | |
| N0 | 18(64.3%) | 10(35.7%) | χ2=4.51 | 0.10 |
| N1 | 12(92.3%) | 1(7.7%) | | |
| N2 | 7(87.5%) | 1(12.5%) | | |
| Stage | | | | |
| T1 | 1(100%) | 0(0%) | χ2=1.56 | 0.67 |
| T2 | 7(63.6%) | 4(36.4%) | | |
| T3 | 19(76%) | 6(24%) | | |
| T4 | 10(83.3%) | 2(16.7%) | | |
| Modified Dukes stage | | | | |
| A | 1(100%) | 0(0%) | χ2=3.54 | 0.47 |
| B1 | 3(75%) | 1(25%) | | |
| B2 | 14(63.6%) | 8(36.4%) | | |
| C1 | 9(90%) | 1(10%) | | |
| C2 | 10(83.3%) | 2(16.7%) | | |
| Mitotic count | | | | |
| Mean±SD | 8.68±4.56 | 8.1±4.23 | U=201.5 | 0.63 |
| Apoptotic | | | | |
| Mean±SD | 3.29±2.61 | 4.05.±3.54. | U=186.5 | 0.41 |
SD: standerd deviation FE: Fisher’s Exact χ2=Chi-Squares U= Mann-Whitney *=significance **= highly significance
Regarding score of immunohistochemical expression of ALDH1, there was a statistically significant association between high expression of ALDH1 and older age (p=0.04), ulcerating gross picture (p=0.01) and presence of vascular invasion (p= 0.04) [Table/Fig-7].
Relationship between score of immunohistochemical expression of ALDH1 and clinicopathologic factors in the studied colorectal carcinoma cases.
| Variables | Expression of ALDH1 | Test of significance | p-value |
|---|
| Positive | Negative |
|---|
| Age | | | | |
| Mean±SD | 55.94±13.37 | 48.06±12.76 | u=167 | 0.04* |
| ≤ 45 | 8(57.1%) | 6(42.9%) | FE=0.93 | 0.5 |
| > 45 | 25(71.4%) | 10(28.6%) | | |
| Sex | | | | |
| Male | 11(57.9%) | 8(42.1%) | χ2=1.26 | 0.26 |
| Female | 22(73.3%) | 8(26.7%) | | |
| Size | | | | |
| Mean±SD | 5.5±2.6 | 7.09±3.87 | U=206.5 | 0.22 |
| ≤ 5 | 20(74.1%) | 7(25.9%) | χ2=1.24 | 0.27 |
| > 5 | 13(59.1%) | 9(40.9%) | | |
| Site | | | | |
| Left | 17(70.8%) | 7(29.2%) | χ2=0.26 | 0.61 |
| Right | 16(64%) | 9(36%) | | |
| Gross | | | | |
| Fungating | 14(53.8%) | 12(46.2%) | χ2=8.4 | 0.01* |
| Ulcerating | 18(90%) | 2 (10%) | | |
| Annular | 1(33.3%) | 2(66.7%) | | |
| Type | | | | |
| Adenocarcinoma | 26(65%) | 14(35%) | FE=0.55 | 0.7 |
| Mucoid carcinoma | 7(77.8%) | 2(22.2.8%) | | |
| Grade | | | | |
| I | 1(100%) | 0(0%) | χ2=0.5 | 0.78 |
| II | 26(66.7%) | 13(33.3%) | | |
| III | 6(66.7%) | 3(33.3%) | | |
| Vascular invasion | | | | |
| Present | 7(100%) | 0(0%) | χ2=3.96 | 0.04* |
| Absent | 26(61.9%) | 16(38.1%) | | |
| Necrosis | | | | |
| Present | 16(66.7%) | 8(33.3%) | χ2=0.01 | 0.92 |
| Absent | 17(68%) | 8(32%) | | |
| Perineural invasion | | | | |
| Present | 5(71.4.9%) | 2(28.6%) | FE=0.06 | 1 |
| Absent | 28(66.7%) | 14(33.3%) | | |
| Lymph node invasion | | | | |
| Present | 14(66.7%) | 7(33.3%) | χ2=0.008 | 0.93 |
| Absent | 19(67.9%) | 9(32.1%) | | |
| N0 | 19(67.9%) | 9(32.1%) | χ2=0.11 | 0.95 |
| N1 | 9(69.2%) | 4(30.8%) | | |
| N2 | 5(62.5%) | 3(37.5%) | | |
| Stage | | | | |
| T1 | 1(100%) | 0(0%) | χ2=1 | 0.8 |
| T2 | 7(63.6%) | 4(36.4%) | | |
| T3 | 16(64%) | 9(36%) | | |
| T4 | 9(75%) | 3(25%) | | |
| Modified Dukes stage | | | | |
| A | 1(100%) | 0(0%) | χ2=0.76 | 0.94 |
| B1 | 3(75%) | 1(25%) | | |
| B2 | 14(63.6%) | 8(36.4%) | | |
| C1 | 7(70%) | 3(30%) | | |
| C2 | 8(66.7%) | 4(33.3%) | | |
| Mitotic count | | | | |
| Mean±SD | 7.9±4.33 | 9.8±4.32 | U=183.5 | 0.08 |
| Apoptotic | | | | |
| Mean±SD | 4.6±3.73 | 3.63±3.48 | U=220 | 0.34 |
FE: Fisher’s Exact χ2=Chi-Squares U= Mann-Whitney SD: standard deviation
Furthermore, there was a statistically significant association between H-score values and presence of vascular invasion (p=0.02).
Positive stromal expression of ALDH1 was significantly associated with smaller tumour size (p=0.03). Furthermore, stromal expression of ALDH1 was inversely associated with grade of tumour (p=0.000) and perineural invasion (p=0.05).
There was a highly statistical significant difference between studied normal mucosa and that adjacent to CRC and CRC cases regarding ALDH1 expression (p=0.000 and 0.004 respectively).
Also, a highly statistical significant difference was seen between adenoma and colorectal carcinoma cases regarding ALDH1 expression in favor of it (p =0.001).
There was an inverse relationship between CD44 expression and ALDH1 expression as all studied colorectal carcinoma cases that were negative for CD44 were positive for ALDH1 (p=0.001). The results for CD44 have been taken from a previous study published by the authors on same sample [Table/Fig-8] [7].
Comparison between immunohistochemical expression of CD44 and ALDH1.
| Variables | ALDH1 expression | Test of significance | p-value |
|---|
| Positive | Negative |
|---|
| CD44 expression | 21(100%) | 0(0%) | χ2=11.92 | 0.001** |
| Negative Positive | 16(57.5%) | 12(42.5%) | | |
**= Highly significant. χ2= Chi-Square
Note: The results for CD44 have been taken from a previous study published by the authors on same sample7
Survival Analysis [Table/Fig-9-12]
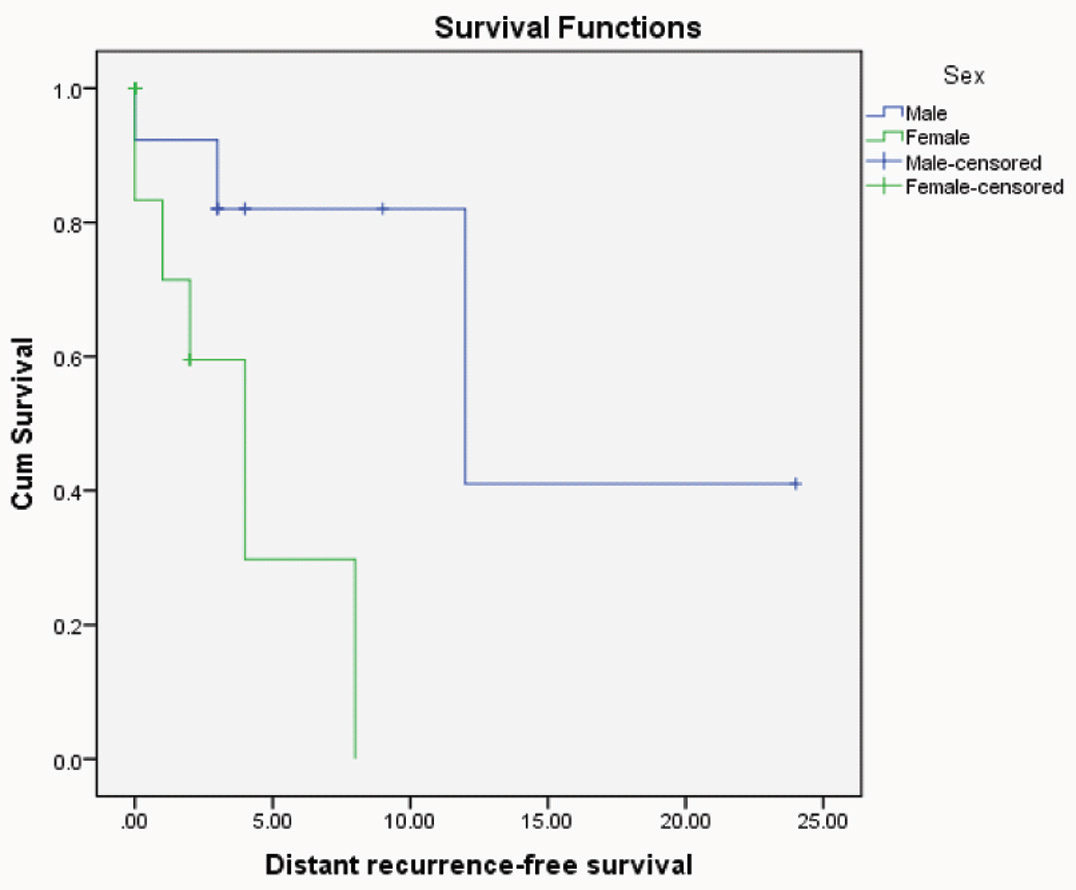
Kaplan-Meier distant recurrent free survival for CRC patients with different sexes (p=0.02"significant", Log rank= 5.12).
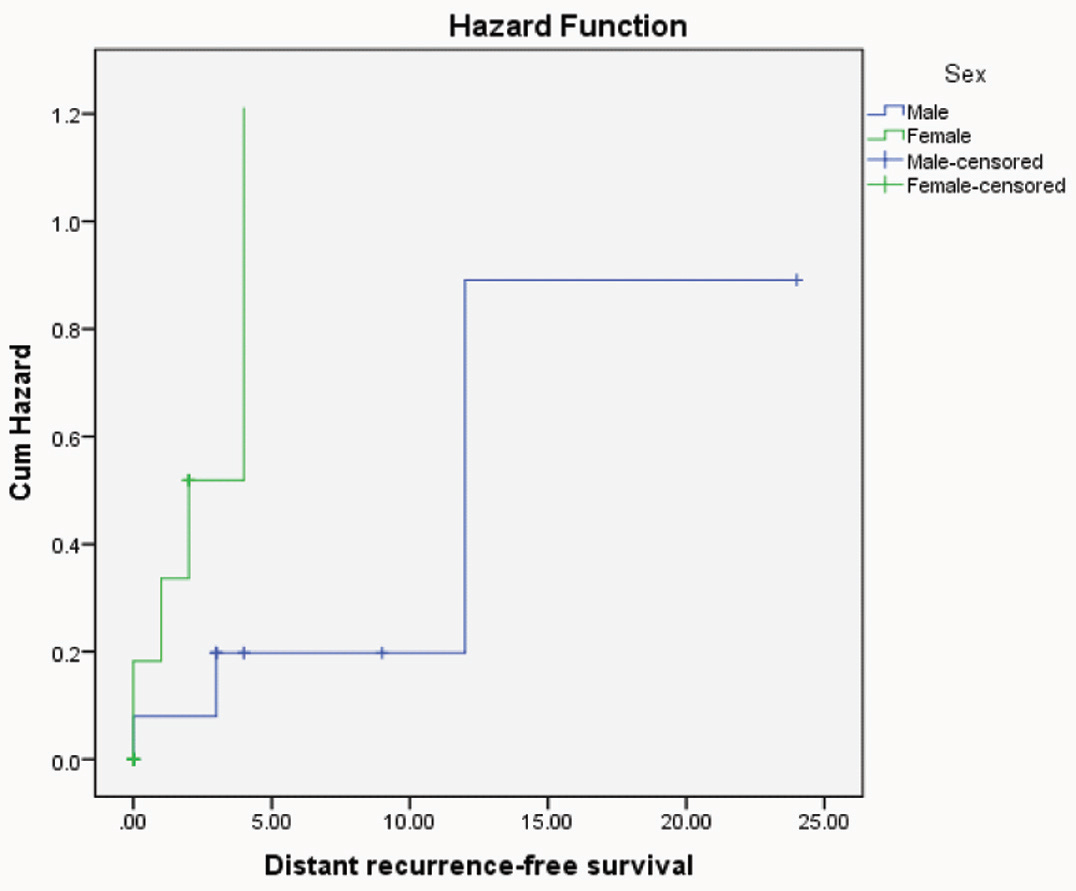
Hazard function curve of distant recurrent free survival for CRC patients with different sexes indicating that female patients were more hazardous.
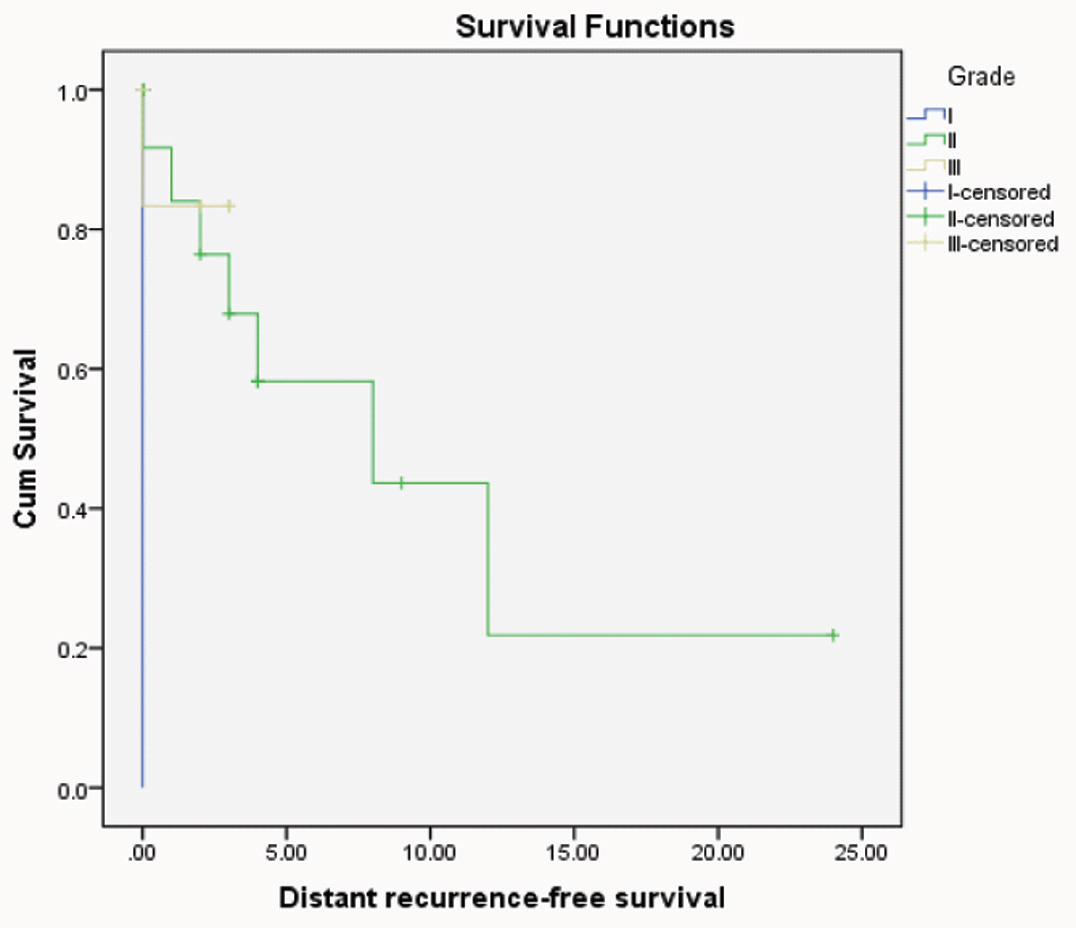
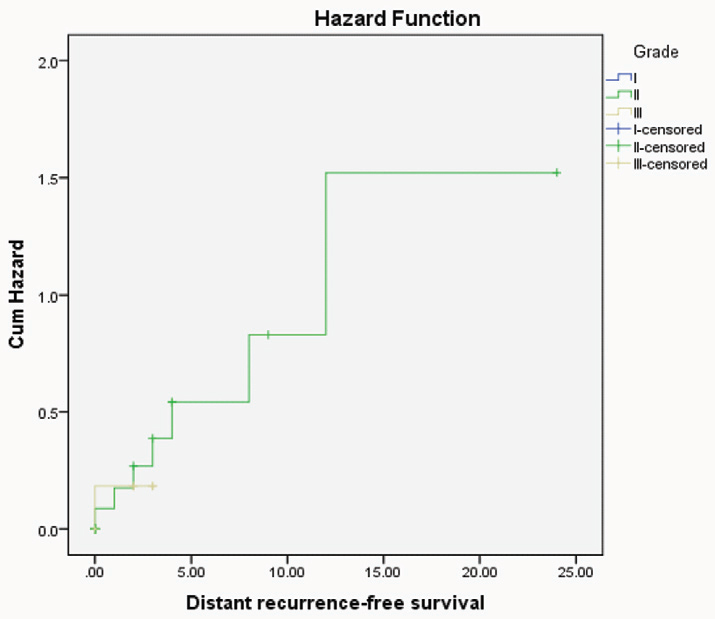
Kaplan-Meier distant recurrent free survival for CRC patients with different grades (p=0.03"significant", Log rank= 6.83).
Hazard function curve of distant recurrent free survival for CRC patients with different grades indicating that patients had high grade were more hazardous.
The survival ranged between 2 and 40 months with a mean±SD of (15.8±10.1) months and a median of 14 months. Nine out of 31 CRC cases died with offending disease.
Univariate recurrence free survival analysis revealed the bad prognostic impact of high grade (p=0.03) and female sex (p=0.02) on patient outcome.
But no statistical significance was observed between overall survival and clinicopathological data nor immunohistochemical expression of ALDH1.
Discussion
In the present study, ALDH1 showed mainly cytoplasmic localization similar to previous studies in different tumours [18–20].
All the studied cases of normal non-neoplastic colonic epithelium showed low cytoplasmic ALDH1 immunoreactivity and this agreed with Zhou et al., who found that ALDH1 immunohistochemistry was identified in a small sub-population of cells (≤5%) localized to the bottom of normal crypts where SC reside [21].
In the current study, 77.2% of normal mucosa adjacent to CRC cases showed cytoplasmic ALDH1 immunostaining. This result agreed with Xu et al., who found that expression of ALDH1A1 was detected in CRC samples including both the tumour tissue and the corresponding adjacent mucosa [6]. This might be explained as ALDH1 expression can represent an early event in the process of cancer cell transformation as a result of field cancerization.
In the current study, 84.6% of studied adenoma cases showed ALDH1 positivity and this agreed with Huang et al., who explained this by increasing number of colonic SC over the course of colon cancer progression [22]. However, there was no statistical significant association between immunohistochemical expression of ALDH1 and clinicopathological factors of studied adenoma cases and this was similar to Bartley et al., [23].
ALDH1 positivity was observed in 75.5% of studied CRC cases and this result was near to Hou et al., who found that 76.5% of the studied cases showed positive expression of ALDH1 [24].
There was a highly statistical significant association between epithelial positivity of ALDH1 and younger age (p=0.003). This result agreed with Goossens-Beumer et al., which might explain the poor prognosis of CRC in younger age patients [25]. In contrast Timothy et al., found no significant relationship between ALDH1 expression and the age [26].
In the present study, there was a statistically significant association between epithelial ALDH1 positivity and right sided tumours (p= 0.038) and this agreed with Goossens-Beumer et al., who found that high ALDH1 expression was associated with colonic tumour rather than rectal tumour [25]. Meguid et al., found that right-sided colon cancers had a worse prognosis than left-sided colon cancers due to differences in embryologic origin, genetic, environmental factors and fecal exposure [27]. This might predict that increased ALDH1 expression in right side might be associated with poor prognosis.
Moreover, the present study showed a statistically significant association between epithelial ALDH1 positivity and lymph node invasion (P=0.04). This agreed with Hou et al., and Chen et al., and also agreed with Hessman et al., who found that 52.9% of cases with nodal metastasis showed positive expression of ALDH1 [24,28,29]. Similar result had been reported in cervical cancer with association to poor prognosis [30]. On the contrary, Zhou et al., found that no association was identified between lymph node metastasis and ALDH1 expression [21].
The current study showed that high epithelial expression of ALDH1 was significantly associated with ulcerating gross picture. No previous studies found significant relationship between ALDH1 expression and ulcerating gross picture of tumour. This result might add evidence that ulcerating gross picture is associated with poor prognosis.
Moreover, in the present study there was a statistical significant association between high epithelial expression of ALDH1 and presence of vascular invasion (p=0.05). This result was similar to Hiroshi et al., who found that ALDH1 had significant association with vascular invasion in breast cancer [31]. ALDH1 acts as a promoter, inducing Epithelial-Mesenchymal Transition (EMT) in cancer cells [32]. EMT can contribute to invasive and metastatic tumour growth. This process is considered to promote cancer cell progression through the basement membrane and invasion into the surrounding micro-environment, such as the lymph and blood vascular systems [28,31].
In contrast positive stromal expression of ALDH1 had a statistically significant association with small tumour size (p-value =0.03). Also there was a highly significant association between negative stromal expression of ALDH1 and high grade tumour (p=0.000) and presence of perineural invasion (p=0.05). These results were similar to Bednarz-Knoll et al., who found that stromal ALDH1 staining was correlated with favorable prognosis in breast cancer [33]. ALDH1 staining in stromal cells might result from the presentation of ALDH1 protein by dendritic cells known to attenuate tumour outgrowth [33]. Also, it might be reasoned that ALDH1expressed in different types of cells was involved in different molecular pathways. It can be suspected that ALDH1 (+) stromal cells might synthesize and secrete retinoic acid into the tumour micro-environment [34]. In turn, stromal cell-derived retinoic acid might induce tumour cell differentiation, inhibit proliferation directly or via regulation of other immune cells which is finally, decreased the aggressiveness of the tumour [35]. These findings suggest that, ALDH1 (+) stromal cells might act as local guardians of tumour cells reducing tumour progression [33].
The current study showed statistically significant difference between ALDH1 expression in normal colonic tissue, adjacent normal mucosa and colon carcinoma passing through adenoma (p=0.004, 0,000 and 0.001). These results agreed with Zhou et al., Huang et al., Lugli et al., and Hou et al., [21,22,36,37]. This might be explained as the expression of stem cell population leads to expansion of the proliferating cell population during the stepwise progression to colon carcinoma [38].
In addition, ALDH1A1 is responsible for the synthesis of Retinoic Acid (RA) from retinal and is crucial in regulating RA signaling [39]. The RA generated by ALDHs initiates transcription of genes which thereby regulate a variety of biological processes such as proliferation, differentiation, and apoptosis [40].
Anti-aldehyde dehydrogenase therapeutic strategies are planned in different preclinical settings [41]. However, Bednarz-Knoll et al., suggested that such drugs might exert adverse effects if the tumour contains ALDH1 (+) stromal cells [33].
The present study showed inverse significant association between CD44 (this marker was used in a previous study by the same authors [7]) and ALDH1 expression (p=0.001). This result was similar to Koukourakis et al., in head and neck tumours and showed that high CD44 and low ALDH1 expression had the poorest prognosis [42]. Examination of ALDH1 and CD44 together in one CRC Patient-Derived Tumour Xenograft (PDTX) models to determine the tumourigenic properties of CD44+ cells [43]. Despite ALDH+/CD44+ cells showing some tumourigenic growth, ALDH+/CD44-cells exhibited a higher incidence and faster growing tumours. On the other hand this result was against that of Keymoosi et al., Dacruz Paula et al., Erfani et al., who found that, there was positive correlation between CD44 and ALDH1 in breast carcinoma, urothelial carcinoma and skin tumours respectively and associated with poor prognosis [43–45].
Survival analysis was performed for single-marker expression and for the combination of the two markers. There was no significant relationship between ALDH1 and overall survival. This result was similar to Kahlert et al., and Lugli et al., [17,36] but was opposite to Goossens-Beumer et al., who found that over-expression of ALDH1 was associated with poor prognosis [25]. Finally we concluded that epithelial expression of ALDH1 might be associated with poor prognosis while its stromal expression might be associated with good prognosis.
Limitation
The limitations that we faced in the current study were the small number of colorectal carcinoma cases as they were 49 cases only, also short duration of follow up that enable us to get significant results in overall survival.
Conclusion
Epithelial expression of ALDH1 might be associated with poor prognosis as positivity of ALDH1 was associated with right sided tumour and presence of lymph node invasion, also score of immunohistochemical expression of ALDH1 was associated with older age, ulcerating gross picture and presence of vascular invasion while its stromal expression might be associated with good prognosis as it was significantly associated with smaller tumour size. Furthermore, it was inversely associated with grade of tumour and Perineural invasion.
M: F=male to female ratio, SD= Standard deviation.
M: F= male to female ratio, SD= Standard deviation.