Estimation of Serum Protein in Oral Potentially Malignant Disorders and Oral Malignancy – A Cross-Sectional Study
Chandramani B. More1, Palak H. Shah2, Rashmi Venkatesh3
1 Professor and Head, Department of Oral Medicine and Radiology, K. M. Shah Dental College and Hospital, Sumandeep Vidyapeeth University, Piparia, Vadodara, Gujarat, India.
2 Postgraduate Student, Department of Oral Medicine and Radiology, K. M. Shah Dental College and Hospital, Sumandeep Vidyapeeth University, Piparia, Vadodara, Gujarat, India.
3 Reader, Department of Oral Medicine and Radiology, K. M. Shah Dental College and Hospital, Sumandeep Vidyapeeth University, Piparia, Vadodara, Gujarat, India.
NAME, ADDRESS, E-MAIL ID OF THE CORRESPONDING AUTHOR: Dr. Chandramani B. More, Professor and Head, Department of Oral Medicine and Radiology, K. M. Shah Dental College and Hospital, Sumandeep Vidyapeeth University, Piparia, Vadodara, Gujarat-391760, India.
E-mail: drchandramanimore@rediffmail.com
Introduction
In carcinogenesis, increased oxidative stress and weakened antioxidant defense produces damage to the macromolecules like proteins. Thus, protein can act as potential biomarker in oral premalignant and malignant lesions.
Aim
To determine and compare the levels of serum proteins in Oral Submucuous Fibrosis (OSMF), Oral Leukoplakia (OL), Nicotina Stomatitis (NS), Oral Malignancy (OM) and Healthy Controls (HC).
Materials and Methods
A total of 250 participants, were equally divided in five groups i.e., OSMF, OL, NS, OM and HC. Five ml of blood was collected from antecubital vein from each participant. The serum was analyzed for total protein, albumin and globulin levels using EBRA EM 200 semi-quantitive analyzer with the help of diagnostic kits.
Results
There were total 193 males and 57 females, who were between 18 to 82 years of age, with a mean of 46.32±13.89 years. The serum protein and globulin levels were significantly decreased in OSMF, OL and NS and increased in OM as compared to HC (p<0.001). No statistically significant difference was found in serum albumin levels between the study groups (p>0.05).
Conclusion
Serum proteins can be used as diagnostic and prognostic marker for oral premalignant and malignant lesions.
Albumin, Globulin, Nicotina stomatitis, Oral Leukoplakia, Oral malignancy, Oral submucous fibrosis, Serum protein
Introduction
Like an evil with many faces, tobacco and areca nut habits are practiced in different forms in India since centuries. India is world’s second largest consumer of tobacco, where about one-third of the adults consume some or the other form of tobacco [1]. The carcinogens of these substances may cause oral precancerous and cancerous lesions, which are associated with significant morbidity and mortality. Daily the number of new cases and deaths is increasing worldwide, and more than half of all cancer cases occur in developing countries [2].
The oral cancerous lesions are always preceded by Oral Potentially Malignant Disorder (OPMD’s) like OL, OSMF, NS etc., [3]. Although, the assessment of probable behaviour of OPMD’s is mainly based on histological examination, various biochemical alterations occur at every step of oncogenic process, during which, various substances change quantitatively in the serum and are collectively termed as tumour markers or biochemical serum markers, which may act as reliable indicator. Studies involving relationship of enzymes, proteins and glycoproteins are reported by many workers and had observed significant alterations in serum levels of OPMD’s and OM [4–6].
Free radicals attack the healthy cells of the body leading to loss of structure and function [7]. Excessive production of reactive oxygen species within the tissue can damage DNA, proteins, lipids and carbohydrates. The oxidation of proteins plays an important role in pathogenesis of oral cancer [8,9]. Hypoproteinemia is commonly observed in oral malignancy and it is expressed as cachexia [10]. Thus, serum protein may serve as an important diagnostic and prognostic marker for OPMD’s and OM. Hence, the present study was planned to assess and correlate the serum levels of proteins in OPMD’s and OM.
Materials and Methods
The present prospective study was conducted in the Department of Oral Medicine and Radiology, after obtaining the approval from the Institutional Ethics Committee (IEC) of Sumandeep Vidyapeeth, bearing number SVIEC/ON/DENT/RP/1520 dtd. 04/12/2014 and SVIEC/ON/DENT/RP/15034 dtd. 29/06/2015.
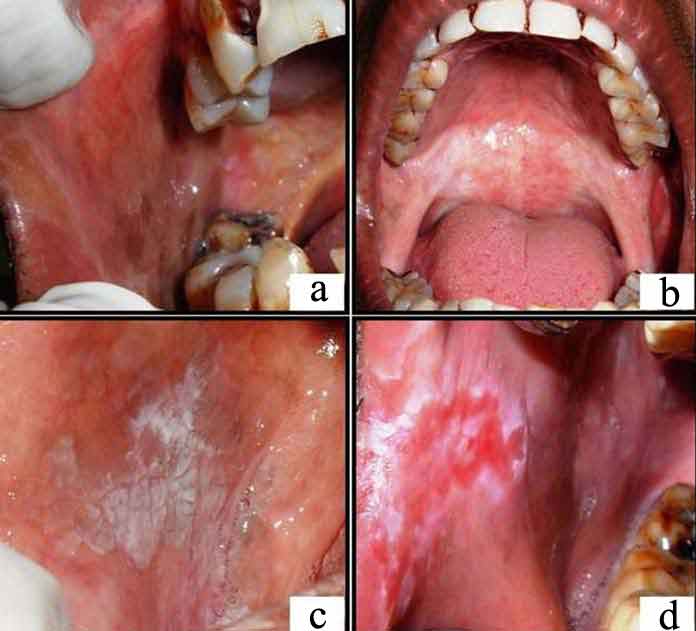
The total of 250 participants, equally divided into five study groups – OSMF, OL, NS, OM and age and sex matched HC, which were diagnosed clinically and histopathologically and were classified accordingly [3,11,12] depending on the severity; formed the part of the study [Table/Fig-1,2]. Participants who had undergone treatment for the lesions and having systemic disease (like scleroderma, anemia etc.,) were excluded from the study.
(a) Shows blanching and presence of fibrous bands in right buccal mucosa; (b) Shows blanching of soft palate; (c) Shows homogenous oral leukoplakia on right buccal mucosa; (d) Shows non-homogenous oral leukoplakia on right commissure and buccal mucosa.
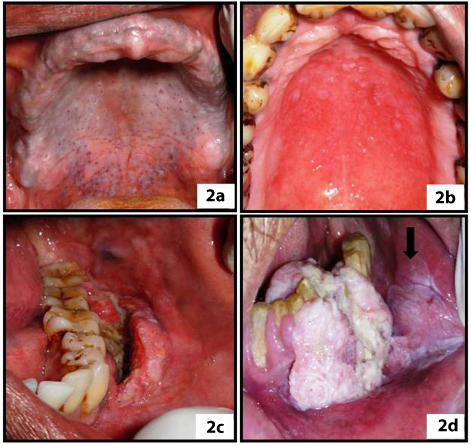
(a) shows grayish black pigmentation on palatal mucosa with inflamed openings of minor salivary glands; (b) Shows erythematous palatal mucosa; (c) Shows deep burrowing ulceration in lower left gingival; (d) Shows proliferative lesion in lower canine premolar region. The black arrow denotes the extent of the lesion towards the buccal mucosa.
After obtaining informed consent, 5 ml of blood was aspirated from right/left antecubital vein, which was centrifuged at 2000 rpm for 10 minutes to separate the serum. The serum was then analyzed for total proteins and albumin levels using diagnostic kit-Liquixx Total Protein Erba Mannheim and Liquixx Albumin Erba Mannheim respectively, and EBRA EM 200 fully automatic analyzer. The serum globulin levels were obtained by subtracting the values of total proteins and albumin. The statistical analysis was performed using SPSS version 19.0 and tests applied were one-way ANOVA and Tukey’s Post-Hoc analysis for multiple comparisons.
Results
The participant’s age ranged from 18 to 82 years, with a mean age of 46.32±13.89. There were total 193 males and 57 females with the M:F ratio of 3.4:1 [Table/Fig-3].
Distribution of participants according to age and sex.
| Group | Age | Sex |
|---|
| Minimum Age (Yrs) | Maximum Age (Yrs) | Mean Age (Yrs) | Male | Female |
|---|
| OSMF | 18 | 79 | 43.66 | 45 | 05 |
| OL | 24 | 75 | 46.32 | 47 | 03 |
| NS | 20 | 80 | 51.74 | 50 | 00 |
| OM | 30 | 82 | 50.20 | 29 | 21 |
| HC | 21 | 65 | 39.68 | 22 | 28 |
| Overall | 18 | 82 | 46.32±13.89 | 193 | 57 |
(OSMF – Oral Submucous Fibrosis, OL – Oral Leukoplakia, NS – Nicotina Stomatitis, OM – Oral Malignancy, HC – Healthy Control, Yrs. – Years)
The serum protein levels were estimated in all the groups and the statistical difference was analyzed by using one-way ANOVA test. The mean value of total protein was minimum (5.012±1.493) g/dl in NS group and was maximum (6.212±1.618) in OM group; which was statistically significant (p<0.001). The mean value of albumin was minimum (3.389±0.911) g/dl in NS group and maximum (3.762±0.716) g/dl in OSMF group; which was statistically not significant (p>0.05). Similarly, the mean value of globulin was minimum (1.623±0.844) g/dl in NS group and maximum (2.675±1.145) g/di in OM group; which was statistically significant (p<0.001) [Table/Fig-4].
Serum levels of proteins (one-way ANOVA).
| Study Group | Serum Protein levels (g/dl)Mean±SD | p-value | Serum Albumin levels (g/dl)Mean±SD | p-value | Serum Globulin levels (g/dl)Mean±SD | p- value |
|---|
| OSMF | 5.442±1.214 | 0.000Highly Significant(p<0.001) | 3.762±0.716 | 0.102Not Significant(p>0.05) | 1.680±0.830 | 0.000Highly Signiicant(p< 0.001) |
| OL | 5.410±1.192 | 3.417±0.870 | 1.994±0.790 |
| NS | 5.012±1.493 | 3.389±0.911 | 1.623±0.844 |
| OM | 6.212±1.618 | 3.548±0.799 | 2.675±1.145 |
| Healthy | 6.154±1.579 | 3.644±0.619 | 2.509±1.219 |
(OSMF – Oral Submucous Fibrosis, OL – Oral Leukoplakia, NS – Nicotina Stomatitis, OM – Oral Malignancy, HC – Healthy Control, g/dl – gram/deciliter, p- probability)
The correlation of total protein levels between each study group was performed by Tukey’s Post-Hoc analysis. The difference was statistically significant (p<0.05) between OL and OM group, and NS and HC group; whereas statistically highly significant (p<0.001) difference was noted between NS and OM group [Table/Fig-5].
Intergroup comparison of serum protein levels (Tukey’s Post-Hoc Analysis).
| Study Groups | Mean Difference | Std. Error | p-value | 95% Confidence Interval |
|---|
| Lower Bound | Upper Bound |
|---|
| OSMF | OL | 0.03220 | 0.28610 | 1.000 | -0.7541 | 0.8185 |
| NS | 0.43060 | 0.28610 | 0.560 | -0.3557 | 1.2169 |
| OM | -0.77000 | 0.28610 | 0.058 | -1.5563 | 0.0163 |
| HC | -0.71120 | 0.28610 | 0.097 | -1.4975 | 0.0751 |
| OL | OSMF | -0.03220 | 0.28610 | 1.000 | -0.8185 | 0.7541 |
| NS | 0.39840 | 0.28610 | 0.633 | -0.3879 | 1.1847 |
| OM | -0.80220 | 0.28610 | 0.043(S) | -1.5885 | -0.0159 |
| HC | -0.74340 | 0.28610 | 0.074 | -1.5297 | 0.0429 |
| NS | OSMF | -0.43060 | 0.28610 | 0.560 | -1.2169 | 0.3557 |
| OL | -0.39840 | 0.28610 | 0.633 | -1.1847 | 0.3879 |
| OM | -1.20060 | 0.28610 | 0.000(HS) | -1.9869 | -0.4143 |
| HC | -1.14180 | 0.28610 | 0.001(S) | -1.9281 | -0.3555 |
| OM | OSMF | 0.77000 | 0.28610 | 0.058 | -0.0163 | 1.5563 |
| OL | 0.80220 | 0.28610 | 0.043(S) | 0.0159 | 1.5885 |
| NS | 1.20060 | 0.28610 | 0.000(HS) | 0.4143 | 1.9869 |
| HC | 0.05880 | 0.28610 | 1.000 | -0.7275 | 0.8451 |
| HC | OSMF | 0.71120 | 0.28610 | 0.097 | -0.0751 | 1.4975 |
| OL | 0.74340 | 0.28610 | 0.074 | -0.0429 | 1.5297 |
| NS | 1.14180 | 0.28610 | 0.001(S) | 0.3555 | 1.9281 |
| OM | -0.05880 | 0.28610 | 1.000 | -0.8451 | 0.7275 |
(OSMF – Oral Submucous Fibrosis, OL – Oral Leukoplakia, NS – Nicotina Stomatitis, OM – Oral Malignancy, HC – Healthy Control, S – Significant, HS – Highly Significant, p - probability)
The correlation of albumin level between each study group was performed by Tukey’s Post-Hoc analysis and was statistically not significant (p>0.05) [Table/Fig-6].
Intergroup comparison of serum albumin levels (Tukey’s Post-Hoc analysis).
| Study Groups | Mean Difference | Std. Error | p-value | 95% Confidence Interval |
|---|
| Lower Bound | Upper Bound |
|---|
| OSMF | OL | 0.34560 | 0.15803 | 0.188 | -0.0887 | 0.7799 |
| NS | 0.37320 | 0.15803 | 0.130 | -0.0611 | 0.8075 |
| OM | 0.21460 | 0.15803 | 0.655 | -0.2197 | 0.6489 |
| HC | 0.11780 | 0.15803 | 0.946 | -0.3165 | 0.5521 |
| OL | OSMF | -0.34560 | 0.15803 | 0.188 | -0.7799 | 0.0887 |
| NS | 0.02760 | 0.15803 | 1.000 | -0.4067 | 0.4619 |
| OM | -0.13100 | 0.15803 | 0.921 | -0.5653 | 0.3033 |
| HC | -0.22780 | 0.15803 | 0.601 | -0.6621 | 0.2065 |
| NS | OSMF | -0.37320 | 0.15803 | 0.130 | -0.8075 | 0.0611 |
| OL | -0.02760 | 0.15803 | 1.000 | -0.4619 | 0.4067 |
| OM | -0.15860 | 0.15803 | 0.854 | -0.5929 | 0.2757 |
| HC | -0.25540 | 0.15803 | 0.489 | -0.6897 | 0.1789 |
| OM | OSMF | -0.21460 | 0.15803 | 0.655 | -0.6489 | 0.2197 |
| OL | 0.13100 | 0.15803 | 0.921 | -0.3033 | 0.5653 |
| NS | 0.15860 | 0.15803 | 0.854 | -0.2757 | 0.5929 |
| HC | -0.09680 | 0.15803 | 0.973 | -0.5311 | 0.3375 |
| HC | OSMF | -0.11780 | 0.15803 | 0.946 | -0.5521 | 0.3165 |
| OL | 0.22780 | 0.15803 | 0.601 | -0.2065 | 0.6621 |
| NS | 0.25540 | 0.15803 | 0.489 | -0.1789 | 0.6897 |
| OM | 0.09680 | 0.15803 | 0.973 | -0.3375 | 0.5311 |
(OSMF – Oral Submucous Fibrosis, OL – Oral Leukoplakia, NS – Nicotina Stomatitis, OM – Oral Malignancy, HC – Healthy Control, p - probability)
The correlation of globulin levels between each study group was performed by Tukey’s Post-Hoc analysis. The difference was statistically significant between OL and OM groups (p<0.05); whereas statistically highly significant difference was noticed between OSMF and OM, OSMF and HC groups, NS and OM, NS and HC groups (p<0.001) [Table/Fig-7].
Intergroup comparison of serum globulin levels (Tukey’s Post-Hoc analysis).
| Study Groups | Mean Difference | Std. Error | p-value | 95% Confidence Interval |
|---|
| Lower Bound | Upper Bound |
|---|
| OSMF | OL | -0.31340 | 0.19643 | 0.502 | -0.8532 | 0.2264 |
| NS | 0.05740 | 0.19643 | 0.998 | -0.4824 | 0.5972 |
| OM | -0.99460 | 0.19643 | 0.000(HS) | -1.5344 | -0.4548 |
| HC | -0.82900 | 0.19643 | 0.000(HS) | -1.3688 | -0.2892 |
| OL | OSMF | 0.31340 | 0.19643 | 0.502 | -0.2264 | 0.8532 |
| NS | 0.37080 | 0.19643 | 0.327 | -0.1690 | 0.9106 |
| OM | -0.68120 | 0.19643 | 0.006(S) | -1.2210 | -0.1414 |
| HC | -0.51560 | 0.19643 | 0.069 | -1.0554 | 0.0242 |
| NS | OSMF | -0.05740 | 0.19643 | 0.998 | -0.5972 | 0.4824 |
| OL | -0.37080 | 0.19643 | 0.327 | -0.9106 | 0.1690 |
| OM | -1.05200 | 0.19643 | 0.000(HS) | -1.5918 | -0.5122 |
| HC | -0.88640 | 0.19643 | 0.000(HS) | -1.4262 | -0.3466 |
| OM | OSMF | 0.99460 | 0.19643 | 0.000(HS) | 0.4548 | 1.5344 |
| OL | 0.68120 | 0.19643 | 0.006(S) | 0.1414 | 1.2210 |
| NS | 1.05200 | 0.19643 | 0.000(HS) | 0.5122 | 1.5918 |
| HC | 0.16560 | 0.19643 | 0.917 | -0.3742 | 0.7054 |
| HC | OSMF | 0.82900 | 0.19643 | 0.000(HS) | 0.2892 | 1.3688 |
| OL | 0.51560 | 0.19643 | 0.069 | -0.0242 | 1.0554 |
| NS | 0.88640 | 0.19643 | 0.000(HS) | 0.3466 | 1.4262 |
| OM | -0.16560 | 0.19643 | 0.917 | -0.7054 | 0.3742 |
(OSMF – Oral Submucous Fibrosis, OL – Oral Leukoplakia, NS – Nicotina Stomatitis, OM – Oral Malignancy, HC – Healthy Control, HS – Highly Significant, S – Significant, p - probability)
Discussion
The term free radical is generally used to describe a molecular fragment containing one or more unpaired electron in its valance shell and is capable of existing independently. Free radicals in high concentrations interact with intracellular macromolecules such as DNA, proteins, carbohydrate and lipid thereby, initiating and promoting inflammation and carcinogenesis [13]. Oxidation of protein plays an important role in pathogenesis of cancer and studies have demonstrated decreased protein levels in cases of OPMD’s and oral malignancy [8,9]. In oral cancer, tobacco and areca nut related habit leading to tissue damage and resultant free radicals play a major role as an aetiologic factor. These habits are seen commonly in all the ages and both the sex.
The serum protein levels were decreased in OSMF, OL and NS but increased in OM. This difference was statistically significant (p<0.001). These findings matched with the findings of Patidar KA et al., and Rajendran R et al., in OSMF participants and Dawood RM et al., in OM participants [5,6,14]. But our results did not simulate with the results of Chandran V et al., in OM group in which the plasma protein levels were found to be decreased [8]. The increase in serum protein levels may be explained in terms of inflammatory reaction associated with oral malignancy.
The intergroup comparison of serum albumin was statistically not significant (p> 0.05) and this was not in accordance with the studies of Rajendran R et al., Chandran V et al., Nayyar AS et al., and Singh P et al., [6,8–10]. The intergroup comparison of serum globulin levels was statistically highly significant (p<0.001). The serum globulin levels were decreased in OSMF, OL and NS but increased in OM. This finding was similar to that of Dawood RM et al., [14]. The increase in serum globulin levels may be due to its action as an acute phase reactant.
Limitation
The Limitation of the study is that epithelial dysplasia and correlation is not included in the present study.
Conclusion
The present study demonstrated decrease in serum protein, albumin and globulin levels in OSMF, OL and NS but increase serum levels of proteins in OM. It may be concluded that serum protein may act as a reliable biomarker for OPMD’s and OM.
(OSMF – Oral Submucous Fibrosis, OL – Oral Leukoplakia, NS – Nicotina Stomatitis, OM – Oral Malignancy, HC – Healthy Control, Yrs. – Years)
(OSMF – Oral Submucous Fibrosis, OL – Oral Leukoplakia, NS – Nicotina Stomatitis, OM – Oral Malignancy, HC – Healthy Control, g/dl – gram/deciliter, p- probability)
(OSMF – Oral Submucous Fibrosis, OL – Oral Leukoplakia, NS – Nicotina Stomatitis, OM – Oral Malignancy, HC – Healthy Control, S – Significant, HS – Highly Significant, p - probability)
(OSMF – Oral Submucous Fibrosis, OL – Oral Leukoplakia, NS – Nicotina Stomatitis, OM – Oral Malignancy, HC – Healthy Control, p - probability)
(OSMF – Oral Submucous Fibrosis, OL – Oral Leukoplakia, NS – Nicotina Stomatitis, OM – Oral Malignancy, HC – Healthy Control, HS – Highly Significant, S – Significant, p - probability)
[1]. Reddy KS, Gupta PC. Tobacco control in India; Ministry of Health and Family Welfare, Government of India: New Delhi, India, 2004 [Google Scholar]
[2]. Thun MJ, DeLancey JO, Center MM, Jemal A, Ward EM, The global burden of cancer: Priorities for preventionCarcinogenesis 2010 31(1):100-10. [Google Scholar]
[3]. More CB, Das S, Patel H, Adalja C, Kamatchi V, Venkatesh R, Proposed clinical classification for oral submucous fibrosisOral Oncol 2012 48:200-02. [Google Scholar]
[4]. Kadam CY, Katkam RV, Suryakar AN, Kumbar KM, Kadam DP, Biochemical markers in oral cancerBiomedical research 2011 22(1):76-80. [Google Scholar]
[5]. Patidar KA, Parwani RN, Wanjari SP, Correlation of salivary and serum IgG, IgA levels with oral protein in oral submucous fibrosisJ Oral Sci 2011 53:97-102. [Google Scholar]
[6]. Rajendran R, Vasudevan DM, Vijavakumar T, Serum levels of iron and proteins in oral submucous fibrosisAnnals of dentistry 1990 :23-25. [Google Scholar]
[7]. Mark P, AntioxidantsClinical nutrition insights 1998 24:1-4. [Google Scholar]
[8]. Chandran V, Anitha M, Avinash SS, Rao GM, Shetty BV, Sudha K, Protein oxidation: A potential cause of hypoalbuminemia in oral cancerBiomedical research 2012 23(2):227-30. [Google Scholar]
[9]. Nayyar AS, Khan M, Vijayalaxmi KR, Suman B, Gayitri HC, Anitha M, Serum total protein, albumin and advanced oxidation protein products – Implications in oral squamous cell carcinomaMalaysian J Pathol 2012 34(1):47-52. [Google Scholar]
[10]. Singh P, Gharote H, Nair P, Hegde K, Saawarn N, Guruprasad R, Evaluation of cachexia in oral submucous fibrosisJ Indian Aca Oral Med Radiol 2012 24(2):130-32. [Google Scholar]
[11]. Rajendran R, Sivapathasundharam B, Shafer’s textbook of oral pathology 2006 5th editionDelhiElsevier [Google Scholar]
[12]. Greenberg MS, Glick M, Ship JA, Burket’s oral medicine 2008 11th editionIndiaBC Decker Inc [Google Scholar]
[13]. Poli G, Leonarduzzi G, Biasi F, Chiarpotto E, Oxidative stress and cell signalingCurr Med Chem 2004 11:1163-82. [Google Scholar]
[14]. Dawood RM, Hasan HR, Assessment of salivary and serum proteins in patients with oral tumoursBaghdad Science Journal 2013 10(3):934-43. [Google Scholar]