The incidence of Prostate Cancer (PCa) is higher amongst industrialized nations [1], due to adoption of Prostate Specific Antigen (PSA) screening [1]. Incidence in African nations is lower than industrialised nations but higher than Asian nations [1]. Asia has the lowest incidence of PCa with wide variation among different countries [2]. The incidence has been consistently increasing in Asian countries due to increased PSA use, rapid urbanization and western diet [3–5]. Despite this, PSA screening has not been adopted in India due to low incidence of the disease [6]. In contrast, the 5-year survival of patients with PCa remains much lower in India (58.1%) as compared to western nations (>90%) with higher incidence [7].
Trans-Rectal Ultrasonography (TRUS) guided biopsies have been traditionally used for detection of PCa since early 1990s [8]. The reported cancer detection rates of TRUS biopsies have been around 30 percent in western countries [9]. The cancer detection rates reported in India have been lower than the western world for serum PSA values less than 20 ng/ml [10–12]. This low TRUS biopsy yield in India cannot be explained by overall lower incidence of PCa, as no relationship has been found between the incidence of PCa and the cancer detection rate of TRUS biopsy [13]. The higher incidence of inflammatory pathology (prostatitis) in the absence of clinical suspicion of prostatitis has been postulated as a possible explanation for the above finding, which can lead to falsely elevated serum PSA levels [12]. No other explanation for the low TRUS biopsy yield apart from the above could be found in the available literature. This study was conducted to find out the TRUS biopsy yield in contemporary Indian population in the absence of prostatitis. It also studies the positive predictive values at different serum PSA/PSA density cut off levels and suspicious Digital Rectal Examination (DRE) findings.
Materials and Methods
This retrospective study was carried out in a single tertiary care institute by examining medical records of patients who attended Urology out-patient department for Lower Urinary Tract Symptoms (LUTS) due to prostatomegaly from January 2012 to December 2014. Prior Institutional Ethics Committee approval was taken for the same (IEC/91/16).
All symptomatic patients who underwent TRUS guided biopsy for indication of raised serum PSA level (>4 ng/ml) or suspicious DRE findings (nodule, irregularity, hard consistency, immobile rectal mucosa) were included in the study. Patients with history of acute urinary retention/per-urethral catheterization within one week or history of trans-urethral instrumentation/surgery within six weeks of serum PSA estimation were excluded from the study. Other patients excluded were those with symptomatic UTI or laboratory evidence of UTI (in patients without per-urethral catheter) within one week of serum PSA estimation, and patients taking 5-alpha reductase inhibitors. Patients with evidence of prostatitis (acute/chronic) in biopsy histopathology report were also excluded.
Serum PSA estimation was done using fully automated chemi-luminescent immune assay method. For serum PSA range (4-10) ng/ml, percent free/total (%F/T) PSA estimation was done in all patients and TRUS guided biopsy was done in patients with %F/T < 25. TRUS was done using GE® (General Electric) Logiq 100 Pro machine (UK). Prostate volume estimation was done in all cases using the formula:
Prostate volume = (π/6) x (AP diameter) x (transverse diameter) x (cranio-caudal length)
A 12-core biopsies were taken in all cases, except in patients with clinically hard prostate and serum PSA level > 100 ng/ml, where 4-core biopsy was taken (2 cores from each lobe). Biopsy was taken using Bard®Maxcore® (18 gauge) disposable core biopsy gun (Bard Peripheral Vascular, Inc., Tempe, AZ, USA) and end-firing transrectal ultrasonography probe (7.5 MHz). All patients were given tablet bisacodyl (10 mg) along with tablet ciprofloxacin (500 mg) and tablet metronidazole (400 mg) one night prior to biopsy. Post-biopsy, the two oral antibiotics were continued for three days.
Statistical analysis
Statistical analysis was done using Microsoft Excel 2013 with XLSTAT statistical analysis version 18.06 (Addinsoft, New York, USA). The age, prostate size, PSA and PSAD as well as %F/T distribution between benign and malignant disease patients were compared using Mann-Whitney U-test. The distribution of patients with suspicious and normal DRE findings between the above two group of patients was compared using Chi-square test. The cancer detection rates in patients with suspicious and normal DRE findings in different PSA groups were compared using Chi-square test. The Gleason’s grade amongst malignancy positive patients was compared with PSA levels using Spearman’s rank correlation analysis. The receiver-operating characteristic (ROC) curve for PSA and PSA density was plotted and the AUC was calculated. A p-value less than 0.05 was considered significant.
Results
A total of 235 patients were included in the study. Sixty patients were diagnosed with carcinoma prostate (adenocarcinoma) [Table/Fig-1].
Patient characteristics and distribution according to PSA/PSAD levels & DRE findings.
| Observation | All Patients | Malignant Disease | Benign Disease | p-value |
|---|
| Total patients | 235 | 60 | 175 | - |
| Age (years) | 67.3 (35-89) | 69.01 (35-85) | 66.71 (40-89) | <0.001 |
| Prostate Size (grams) | 60.08 (15-210) | 53.89 (24-180) | 63.06 (15-210) | <0.05 |
| Total PSA (ng/ml)(median) | 13.6(0.5-2365) | 72.155(1.06-2365) | 9.93(0.5-50) | <0.001 |
| PSA Distribution(ng/ml)• <= 4• 4 –10• 10 –20• 20 –30• 30 –50• 50 –100• > 100 | 10847622091024 | 01051007031024 | 097966150600 | - |
| % Free/Total PSA (For PSA 4 – 10) | 13.11(2.83-31.86) | 12.11(4.7-28) | 13.09(2.83-31.86) | 0.494 |
| PSA Density (ng/ml/cm3) | 1.401(0.007-61.032) | 4.808(0.025-61.032) | 0.227(0.017-1.138) | <0.001 |
| PSA Density distribution (ng/ml/cm3)• <= 0.05• 0.05-0.1• 0.1-0.15• 0.15-0.2• 0.2 –0.25• > 0.25 | 1226463017104 | 1123152 | 112544271652 | - |
| DRE Findings• Suspicious• Normal | 69166 | 4317 | 26149 | <0.001 |
| Final Management• Radical Prostatectomy• Bilateral Orchidectomy• Chemotherapy + Radiation therapy• Hormonal therapy• TURP• Alpha blocker therapy• Millin’s Prostatectomy• Lost to follow-up after full evaluation | 74351957815 | 74351---4 | ----957811 | - |
Patients with malignant disease were significantly older than patients with benign disease (69.01 vs 66.71; p<0.001). Patients with malignant disease also had significantly smaller prostate gland size than patients with benign disease (53.89 vs 63.06; p=0.0093). Amongst the patients with PSA between 4-10 ng/ml, there was no difference between the %F/T values between the benign and malignant disease groups (13.09 vs 12.11; p=0.494). Even though patients with malignant disease had higher mean PSAD (4.808 vs 0.227; p<0.001), benign disease patients had much higher mean PSAD value than the usual cut off value of 0.15 for suspected malignant disease. Out of a total of 69 patients with suspicious DRE findings, 43 patients had malignancy (positive predictive value = 62.31%). However, a total of 17 out of the above 69 patients had only a firm nodule on DRE, out of which 2 patients were detected with malignancy (positive predictive value for firm nodule = 11.76%).
The overall cancer detection rate of TRUS biopsy in our series was 25.53% [Table/Fig-2].
Cancer detection rate distribution.
| Observation | Cancer Detection Rate (Percent) |
|---|
| Overall (All patients) | 25.53 |
| PSA Ranges• 4 –10• 10 –20• 20 –30• 30 –50• 50 –100• > 100 | 5.9513.1631.8133.33100100 |
| DRE Findings• Overall• PSA <= 4• PSA 4 – 10• PSA 10 – 20• PSA 20 – 30• PSA 30 – 50• PSA 50 – 100• PSA > 100 | Suspicious62.321027.275062.560100100 | Normal10.24-2.818.8214.280100100 | p-value<0.001-<0.001<0.001<0.001<0.001-- |
| PSA Density Ranges• <= 0.05• 0.05 – 0.1• 0.1 – 0.15• 0.15 – 0.2• 0.2 – 0.25• > 0.25 | 8.333.844.34105.8850 |
However a majority of patients detected with malignancy has serum PSA greater than 50 ng/ml (56.67%). The cancer detection rate for PSA ranges of (4-10) and (10-20) was as low as 5.95% and 13.16% respectively. On the other hand, cancer detection rate was 100% for PSA greater than 50 ng/ml. The cancer detection rates for PSAD ranges upto 0.25 was only upto 10%. Suspicious DRE finding significantly increased the cancer detection rates at all PSA ranges as compared to non-suspicious DRE (p<0.001). A total of 14 patients had acute/chronic prostatitis on biopsy histopathology report, and were excluded from this study.
The sensitivity, specificity, positive and negative predictive values for suspicious DRE as well as for different PSA and PSAD cut offs is shown in [Table/Fig-3]. The positive predictive value for serum PSA cut offs of 4, 10 and 20 ng/ml was 26.22%, 38.3% and 67.69% respectively. The positive predictive value for the traditional PSAD cut off of 0.15 ng/ml/cm3 was 37.08%. The serum PSA and PSAD tests showed high sensitivity and low specificity for cut off values upto 10 ng/ml and 0.15 ng/ml/cm3 respectively.
Sensitivity, specificity, positive and negative predictive values at various PSA/PSAD cut offs as well as for suspicious DRE in different PSA ranges.
| Observation | Sensitivity (%) | Specificity (%) | Positive Predictive Value (%) | Negative Predictive Value (%) |
|---|
| Suspicious DRE• Overall• PSA 4 – 10• PSA 10 – 20• PSA 20 – 30• PSA 30 – 50• PSA 50 – 100• PSA > 100 | 62.32604071.431007083.33 | 89.7589.8793.948066.67-- | 71.6727.275062.560100100 | 85.1497.2691.1885.71100-- |
| PSA Cut offs• 4 ng/ml• 10 ng/ml• 20 ng/ml• 30 ng/ml• 50 ng/ml• 100 ng/ml | 98.339073.3361.6756.6740 | 5.1450.288896.57100100 | 26.2238.367.6986.04100100 | 9093.6290.5988.0287.0682.94 |
| PSA Density Cut offs• 0.05 ng/ml/cm3• 0.1 ng/ml/cm3• 0.15 ng/ml/cm3• 0.2 ng/ml/cm3• 0.25 ng/ml/cm3 | 98.3396.6793.3388.3386.67 | 6.2920.5745.7161.1470.29 | 26.4629.4437.0843.850 | 91.6794.7495.2493.8693.89 |
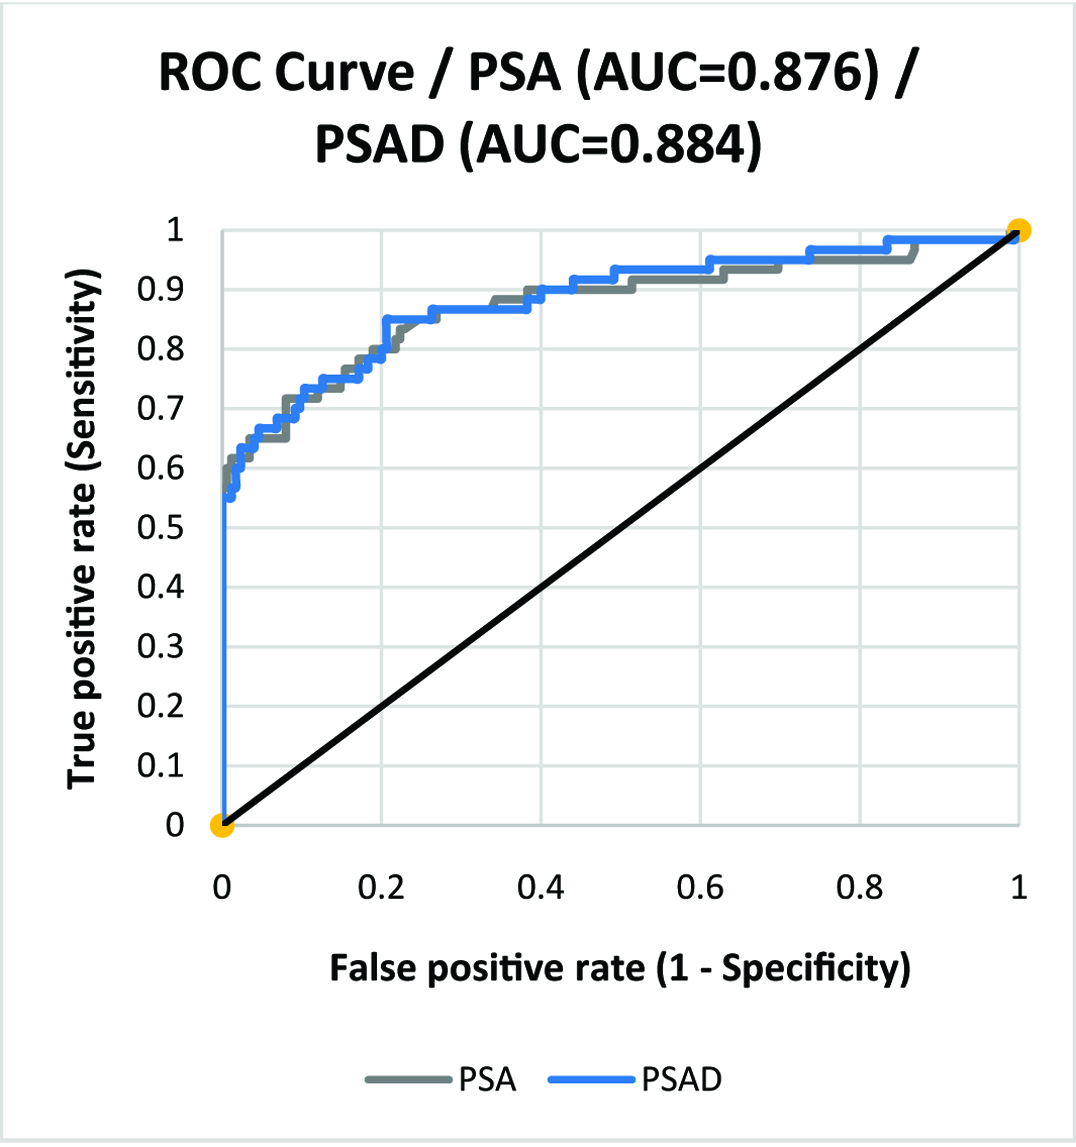
The receiver-operating characteristic (ROC) curves for PSA and PSAD values are shown in [Table/Fig-4]. The AUC for PSA and PSAD was 0.876 and 0.884 respectively.
ROC curve for serum PSA and PSA density.
There was a weak but significant correlation between the serum PSA value and Gleason’s grade amongst patients with malignancy (Spearman’s ρ=0.328; p=0.011). The number of patients with Gleason’s grade <=6, (4+3), (3+4), 8 and (9,10) was 9, 18, 3, 23 and 7 respectively. Majority of the patients (43 out of 60) with PCa were managed with bilateral orchidectomy (71.67%) as they had metastatic disease on presentation. Amongst the seven patients managed with radical prostatectomy, one patient had upstaging of Gleason’s grade for 6 to (4+3) in the final histopathology of the specimen. No patients who underwent Transurethral Resection of Prostate (TURP) for benign disease had PCa on final histopathology of prostatic chips in our series.
A total of three patients (1.27%) had complications post-TRUS biopsy in our series. Two patients had haematuria which was self-limiting, managed conservatively on out-patient basis. One patient (0.43%) had acute bacterial prostatitis requiring hospital admission and was managed successfully with intravenous antibiotics.
Discussion
The highest incidence of PCa is reported in Australia/New Zealand, Northern & Western Europe and North America (79.8-111.6 per 1,00,000 population) [1]. In Africa (10.6-61.7 per 1,00,000 population), the southern African nations have higher incidence of PCa than north African nations, with highest incidence reported in Nigeria [3]. Among Asian countries (4.5-10.5 per 1,00,000 population), the incidence varies with lowest rates being in Iran and highest rates in Philippines [4], with India falling in-between the two extremes. The incidence of PCa in India has been reported to be ranging between 2 and 11.1 per 1,00,000 population in various population based cancer registries all over India [5]. Patients with gleason’s grade greater than or equal to 7 are more likely in Indian population [14], and the result of our study confirms the above finding.
This study shows low positive predictive value for PCa for serum PSA range (4-20) ng/ml, despite excluding patients with prostatitis (acute/chronic) on final histopathology report. This finding can be useful in counselling patients before doing biopsy regarding the outcome of TRUS biopsy. Patients can be reassured regarding higher probability of benign outcome at serum PSA range (4-20) ng/ml, if DRE findings are normal. Although suspicious DRE findings increased the cancer detection rates, this was not true for a finding of only a firm nodule on DRE, which had a very low positive predictive value in our study.
The comparison of cancer detection rates of TRUS biopsies from other countries worldwide is shown in [Table/Fig-5] [8,11,12,15–33]. Majority of the studies had 10-12 core biopsy scheme performed for the patients except three studies which performed 6-core biopsies. Among the two other studies from India, Agnihotri et al., had higher cancer detection rate overall (57.5%) and also for serum PSA ranges of (4-10) and (10-20) ng/ml, which was 43.35% and 36.57% respectively, irrespective of DRE findings [11]. They had suggested raising the serum PSA cut off in symptomatic men with negative DRE for TRUS biopsy in India to 5.4 ng/ml to avoid 10% unnecessary biopsies. This suggestion reflected the low cancer detection rates of TRUS biopsy in India. Our study correlates better with the findings of Sinha et al., who had 24.37% overall cancer detection rate with the rates for serum PSA ranges (4-10) and (10-20) ng/ml being as low as 7.14% and 6.67% respectively [12].
Comparison with cancer detection rates of TRUS biopsy reported worldwide [8,11,12,15–33].
| Author | Country | Number of patients (n) | Cancer detection Rate (Percent) |
|---|
| Overall | PSA <4 | PSA 4-10 | PSA 10-20 | PSA 20-50 | PSA 50-100 | PSA >100 |
|---|
| Janbaziroudsari et al., [16] | Iran | 139 | 32.4 | 8.9 | 13.3 | 77.8 | | | |
| Ghafoori et al., [8] | Iran | 330 | 35 | - | - | - | - | - | - |
| Teoh et al., [22] | Hong Kong | 2606 | 27.6 | 8.6* | 13.4* | 21.8* | 41.7* | 85.2* | |
| 12.4† | 30.2† | 52.7† | 80.6† | 96.4† | |
| Lee et al., [20] | Singapore | 804 | 35.1 | 9.5 | 20.9 | 38.4 | 72.3 | | |
| Sarikaya et al., [29] | Turkey | 835 | 17.8 | - | 12.4 | - | - | - | - |
| Miyoshi et al., [23] | Japan | 195 | - | - | 33.8 | | - | - | - |
| Teo et al., [21] | Singapore | 120 | 22.5 | 14.9 | | 50 | | | |
| Vida et al., [25] | Romania | 1525 | 69.77 | - | - | - | - | - | - |
| Agnihotri et al., [11] | India | 875 | 57.5 | 20† | 15.2* | 24* | 62.6* | | |
| 59.57† | 68.3† | 95.2† | | |
| Ojewola et al., [30] | Nigeria | 168 | 44 | 17.4 | 28.9 | 37 | 55.8 | 85.7 | |
| Leibovici et al., [17] | Israel | 155 | 29 | - | - | - | - | - | - |
| Lodeta et al., [31] | Croatia | 897 | 38.9 | - | - | - | - | - | - |
| Na R et al., [19] | China | 1650 | 47 | - | 14.8 | 27.4 | 75.8 | | |
| (For PSA <10) |
| Narayanaswamy et al., [18] | Kuwait | 153 | 27.4 | - | 11.8 | 20.5 | 47.1 | | 83.3 |
| Sinha et al., [12] | India | 119 | 24.37 | - | 7.14 | 6.67 | 52.17 | | |
| Kahraman et al., [32] | Turkey | 76 | 16 | - | - | - | - | - | - |
| Rodriguez et al., [26] | Spain | 6000 | 39.1 | 30.4 | 29.6 | 44 | 62.03 | 92.9 | |
| Imazu et al., [24] | Japan | 978 | 54.3 | 32.1 | 45.7 | 79.5 | | | |
| Abril et al., [33] | Mexico | 2016 | 37 | - | - | - | - | - | - |
| Yu et al., [15] | Taiwan | 185 | 14.6 | - | - | - | - | - | - |
| Orozco et al., [28] | US | 62537 | 38.3 | 16.2* | 25.3* | 31.7* | 47.4* | | |
| 18.8† | 38.7† | 52.4† | 76.7† | | |
| Gonzalez et al., [27] | Spain | 115 | 24.3 | 4.76 | 5.12 | 48 | | | |
| Our Study | India | 235 | 25.53 | - | 5.95 | 13.16 | 32.26 | 100 | 100 |
* Normal DRE; † Abnormal DRE
Many studies from other countries all over Asia have reported wide variations in the TRUS biopsy yield. Yu et al., from Taiwan reported the lowest rate of 14.6% amongst all the studies, although they included only patients with serum PSA between (4.1-20) ng/ml [15]. This study did not exclude patients with prostatic inflammation on final histopathology from their study, which consisted of 23.2% of their study sample. This could be accounted for the low TRUS biopsy yield. Two studies from Iran by Ghafoori et al., and Janbaziroudsari et al., reported higher yield of 32.4% and 35% respectively despite not excluding patients with prostatic inflammation in both the studies [8,16]. A study from Israel by Leibovici et al., reported lower yield in patients with larger prostate size with 12-core biopsy protocol, and suggested taking additional cores for patients with prostate size greater than 72 ml, or using other modalities like PCA-3 test or endorectal MRI guided biopsies to improve the yield [17]. Narayanaswamy et al., from Kuwait reported lower yield for serum PSA ranges of (4-10) and (10-20) ng/ml [18]. However, a larger number of patients had 6-core biopsy as opposed to 12-core biopsy in this series (mean 6.83 cores) which could be a confounding factor in this study.
A large retrospective study from China by Na R et al., reported lower yield for patients with serum PSA less than 10 ng/ml and (10-20) ng/ml despite overall high yield [19]. Two studies from Singapore by Lee et al., and Teo et al., confirmed the lower yield for serum PSA below 10 ng/ml which was less than 21% [20,21]. In contrast to other Asian studies, the study by Lee et al., reported higher yield of 38.4% for serum PSA range of (10-20) ng/ml [20]. They also reported a high rate of post-biopsy admission for sepsis (1.5%). Another large study by Teoh et al., from Hong Kong reported lower yield for symptomatic men with normal DRE with serum PSA below 20 ng/ml (22%) [22]. Two studies from Japan by Miyoshi et al., and Imazu et al., were the only studies from Asia showing much higher TRUS biopsy yield in contrast to all other Asian studies [23,24].
The European studies showed much higher yield of TRUS biopsy as compared to Asian studies, barring one study. Vida et al., from Romania reported a yield as high as 69.77% for first biopsy [25]. Two studies from Spain by Rodriguez et al., (n=6000) and Gonzalez et al., (n=115) showed contrasting TRUS biopsy yields [26,27]. The former study showed a higher yield despite majority of the patients undergoing 6-core biopsies. The later study showed a much lower yield of 4.76% and 5.12% for serum PSA range of less than 4 ng/ml and (4-10) ng/ml respectively.
Two studies from North America showed high TRUS biopsy yield more than 35%. The largest study was reported by Orozco et al., from the Unites States, showing higher overall yield despite performing 6-core biopsies [28].
Hence, barring some exceptions, Asian population (including India) have a lower TRUS biopsy yield as compared to other continents, especially for serum PSA values less than 20 ng/ml. Our study has confirmed the above findings. Hence the traditional serum PSA cut off of 4 ng/ml followed in western countries gives lower TRUS biopsy yield for Indian population. The area under the curve (AUC) in the ROC curve [Table/Fig-4] for serum PSA level and PSAD level is 0.876 and 0.884 respectively, indicating high accuracy of the above two parameters for distinguishing benign and malignant disease patients. The current cut offs for PSA and PSAD have high sensitivity and low specificity. Hence adjusting or raising the serum PSA and PSAD cut offs for Indian population can increase the TRUS biopsy yield without increasing the false negative rate, thus avoiding unnecessary biopsies. Optimum trade-off between sensitivity and specificity at a higher cut off value is desired. Our study has a very low rate of post-biopsy complications requiring admission (0.43%) indicating that the procedure is safe if performed with accurate technique under antibiotic cover.
We could not find any Indian prospective data in the available literature regarding the sensitivity, specificity and positive predictive value of different serum PSA and PSAD cut offs. Hence the validation of the findings of this study as well as other Indian retrospective data is lacking.
Limitation
The limitation of our study is that it is a retrospective study. Also, all the patients with serum PSA below 4 ng/ml were not subjected to TRUS biopsy. Hence the sensitivity, specificity, positive and negative predictive values for PSA cut off of 4 ng/ml is not accurate in this study. Repeat biopsies were not done in patients with high serum PSA or suspicious DRE but negative initial biopsy.
Conclusion
The current serum PSA and PSAD cut offs of 4 ng/ml and 0.15 ng/ml/cm3 derived from western literature have a lower positive predictive value in this study as compared to western population, especially for serum PSA range of (4-10) and (10-20) ng/ml and serum PSAD ranges upto 0.25 ng/ml/cm3. This leads to a large number of patients undergoing unnecessary biopsies. As the accuracy of serum PSA and PSAD tests is high in our study, the cut off values of the above tests for performing TRUS biopsy can be raised to achieve optimum trade-off between sensitivity and specificity, while simultaneously avoiding unnecessary biopsies. There is a lack of prospective data in Indian literature to validate the findings of this study. TRUS biopsy is a safe procedure with a very low risk of severe complications.
* Normal DRE; † Abnormal DRE