The combination of qualities that delight the sight, other senses, or the mind is defined as beauty. In the recent times, adequate colour match for posterior restorations is also an important consideration in aesthetic dentistry [1].
Unacceptable staining/discolouration are commonly encountered in tooth-coloured restorations and is a frequent reason for their regular replacement [1]. So, one of the reasons for long term success of composite restorations is colour stability. Colour stability is one of the major criteria for selection of composite during its service [2–4].
There is extensive research that has reported the harmful effects of coffee, tea, grape juice, yerba mate and cola drinks on dental composite resins [9–12]. The effect of pH of different media on the surface texture of commonly used resin composites have also been investigated [12–16]. Recent literature reported the colour changes promoted by lemon juice, carrot juice, red wine, snow cone syrup and grape drink [17–19].
Materials and Methods
This in vitro study was conducted in Vishnu Dental College, Bhimavaram, Andhra Pradesh, India.
A total of sixty disk shaped specimens (based on pilot study) using two different composite materials were fabricated by condensing the composite resin of A1 shade in the stainless steel metal mold having a circular shaped hole (10x2 mm). The samples were divided into two groups of 30 specimens each according to the material used [Table/Fig-1] namely:
Materials (resin-based composites and staining solutions) tested in the study.
| Material | Product | Category | Composition | Manufacturer |
|---|
| Resin-based Composites | Z 100 | Universal Microhybrid Composite | BIS-GMA, UDMA, BIS EMA, zirconia / silica fillers (0.01- 3.5 mm) 66% by volume | (3M ESPE, St. Paul, MN, USA) |
| Z 250 XT | Nanohybrid Universal Restorative | BIS-GMA, UDMA, BIS-EMA, PEGDMA, TEGDMA, Surface - modified zirconia/silica (3 μ or less) Non-agglomerated /non- aggregated 20 nanometer surface - modified silica particles 68 % by volume | (3M ESPE, St. Paul, MN, USA) |
| Staining Solutions | Sakthi Turmeric | NA | Turmeric | Sakthi, Mallampatti, India |
| Carmoisine- Red-3 | NA | Carmoisine | National Foods Pvt. Ltd. (Karachi, Pakistan) |
Bis-GMA: 2, 2-bis {4-(3-methacryloxy-2-hydroxypropoxy) phenyl} propane; Bis-EMA: Ethoxylated bisphenol A glycol dimethacrylate; UDMA: Urethane dimethacrylate; TEGDMA: Triethyleneglycol dimethacrylate; PCDMA: Polycarbonate dimethacrylate
Group I (Control Group) - Z 100
Group II (Experimental Group) - Filtek Z 250 XT
The condensed composite resin was then covered with mylar strips (Samit products, New Delhi, India) and sandwiched between two glass slides. This was followed by curing on both the sides for 40 seconds using a Blue LEX LED light curing unit (Monitex GT 1200, Taiwan) with a wave length of 450-470 nm and a lamp intensity of 600 mW/cm2 in a normal mode. Specimens were then stored in distilled water at 37°C for 24 hours to ensure complete polymerization. Specimens were polished using polishing disks (Sof-lexTM, 3M ESPE).
The food colourant solutions were prepared in the following concentrations:
Turmeric solution (Sakthi, Mallampatti, India)
For preparation of turmeric solution 0.5 g of turmeric was added to 150 ml of distilled water.
Carmoisine solution (Carmoisine-Red-3) National Foods Pvt. Ltd. (Karachi, Pakistan).
For preparation of food colourant solution 3 gm of dye was added to 100 ml of distilled water.
The pH analysis of the staining solutions [Table/Fig-2] were done using digital pH meter (Elico, India).
The pH analysis using digital pH meter; a) Analyzing the pH of artificial saliva; b) Analyzing the pH of carmoisine solution; c) Analyzing the pH of turmeric solution.
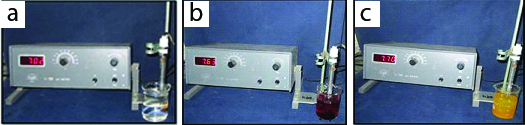
Probe and meter method to assess the pH: By using two buffers (pH 7 and 10) calibration of the probe and meter was done according to the manufacturer’s directions. Tip of the probe was submerged in individual glass containers containing staining solutions. The pH was read directly from the digital meter.
Artificial saliva: The artificial saliva was prepared in the laboratory by using 1.21 g potassium chloride (KCl), 0.4 g sodium chloride (NaCl), 0.005 g hydrated sodium sulfide (Na2S.9H2O), 1 g Urea {CO(NH2)2}, 0.78 g sodium dihydrogen phosphate dihydrate (NaH2PO4.2H2O), and 1000 ml of deionized water. A 10 N sodium hydroxide was added to this mixture until the pH value was adjusted to 7.02±0.15 by using pH meter. Later this mixture was sterilized in the autoclave.
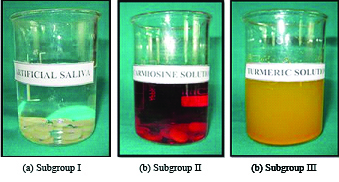
To evaluate the colour stability in different solutions, each group was again divided into three subgroups of 10 specimens each according to the staining solutions used.
Subgroup I - A mixture of artificial saliva (1000 ml);
Subgroup II - A mixture of carmoisine solution (330 ml) and artificial saliva (660 ml);
Subgroup III - A mixture of turmeric solution (330 ml) and artificial saliva (660 ml).
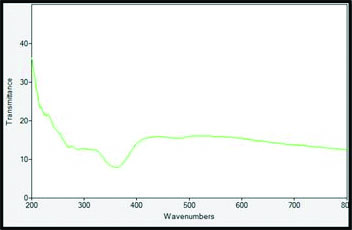
Specimens were immersed in their respective solutions [Table/Fig-3] three hours per day for 15 days at 37°C. The specimens were rinsed with distilled water for five minutes and blotted dry with tissue paper before colour measurement. Colour evaluation and differences (ΔE*) for each specimen were measured using a reflectance spectrophotometer [Table/Fig-4] (Gretag Macbeth™ SpectroScan, Switzerland) with a standard illuminant D65 (white background and it was standardized every time) and standard observer of 2° under daylight conditions. Colour measurements were made just before and after immersion in solutions. These disks were mounted at 90° relative to the light source. Readings were taken three times for each specimen and the mean ΔE* value of three measurements were then calculated automatically by the instrument and noted.
Specimen exposure to prepared solutions.
Colour analysis using reflectance spectrophotometer (one of the Z 100 sample).
Colour difference (ΔE*) was calculated from the mean ΔL*, Δa*, Δb* values for each specimen with the formula [9,12,20–22]:
ΔE* = (ΔL*2 + Δa*2 + Δb*2)1/2
Where, ΔL*, Δa*, Δb* are the differences in L*, a* and b* values before (T0) and after immersion for 15 days (T15).
L*- Component of lightness, a*-red green, b*-yellow blue.
The observed colour changes among different Rasin Base Composits (RBCs) were subjected to ANOVA using statistical software (SPSS for Windows, version 11.0.0, SPSS Inc., Chicago, IL, USA). The mean values were compared using Tukey Post-hoc test (p≤0.05).
Results
Digital pH meter was used to analyze the pH of the staining solutions.
pH of artificial saliva was 7.02,
pH of carmoisine solution was 7.63 and
pH of turmeric solution was 7.70.
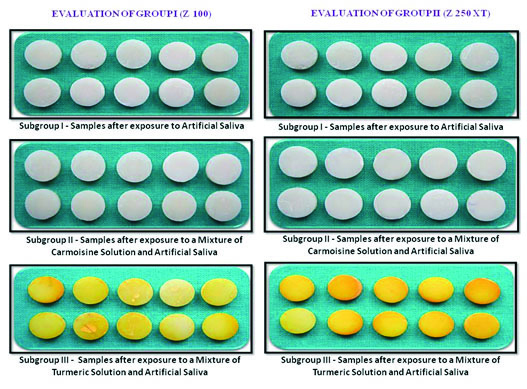
The pH of the staining solutions was found to be similar and alkaline in nature. The mean and standard deviation values for colour change after a period of 15 days for each group were tested and intra group comparison was done between subgroup I and II, I and III and II and III by means of Tukey HSD Post-hoc test [Table/Fig-5,6]. The mean values and standard deviations for colour change after a period of 15 days each combination of staining solutions and tested composite resins are given in [Table/Fig-7]. Turmeric showed the maximum staining capacity compared to carmoisine [Table/Fig-8]. Z 100 specimens showed least stainability by all the used staining solutions, which were statistically significant (p<0.001) to that of Z 250 XT specimens.
Comparison of the mean values of colour change (ΔE*) of Group-I i.e., Z 100 group after exposed to two staining solutions for three hours/day for 15 days.
| Composite resin Z 100 | Mean | SD | Mean±SD difference | p-value |
|---|
| Control group | 14.39 | 1.12 | 20.70±0.67 | <0.001 Significant |
| Turmeric group | 35.09 | 1.79 |
| Control group | 14.39 | 1.12 | 2.10±0.46 | 0.013 Significant |
| Carmoisine group | 16.49 | 1.58 |
| Turmeric group | 35.09 | 1.79 | 18.60±0.21 | <0.001 Significant |
| Carmoisine group | 16.49 | 1.58 |
Statistical analysis by Tukey HSD Post-hoc test. Statistically significant if p < 0.05
Comparison of the mean values of colour change (ΔE*) of Group-II i.e., Z 250 XT group after exposed to two staining solutions for three hours/day for 15 days.
| Composite resin Z 250 XT | Mean | SD | Mean±SD difference | p-value |
|---|
| Control group | 16.34 | 1.19 | 27.33±0.36 | <0.001 Significant |
| Turmeric group | 43.67 | 1.55 |
| Control group | 16.34 | 1.19 | 1.84±0.26 | 0.008 Significant |
| Carmoisine group | 18.18 | 0.93 |
| Turmeric group | 43.67 | 1.55 | 25.49±0.62 | <0.001 Significant |
| Carmoisine group | 18.18 | 0.93 |
Statistical analysis by Tukey HSD Post-hoc test. Statistically significant if p<0.05
Colour changes (ΔE) (mean values and standard deviations) for composites with staining solutions after three hours/day × 15 days.
| Composite resins | Artificial saliva (control group) mean (SD)° | Turmeric staining solution mean (SD)° | Carmoisine staining solution mean (SD)° | Level of significance p-value |
|---|
| Z 100 | 14.4 (1.1) | 35.1 (1.8) | 16.5 (1.6) | < 0.001 Significant |
| Z 250 XT | 16.4 (1.2) | 43.7 (1.6) | 18.2 (1.0) | < 0.001 Significant |
Statistical Analysis by ANOVA. Statistically significant if p < 0.05
Colour evaluation of groups.
Discussion
Tooth coloured restorative dental materials are continuously exposed to saliva, foods and other beverages in the oral cavity. So, it is important to determine their susceptibility to colour change [12]. Several laboratory tests have been used in order to simulate and accelerate the discolouration, simulating oral aging conditions [23]. In the present study specimens were immersed in concentrated staining solutions daily and continuously for a specified period of time i.e., three hours/day for 15 days, this could be considered equivalent to nine months duration in vivo [1].
Spectrophotometers are considered to be more accurate in measuring the colour change than colourimeters as they contain monochromators and photodiodes that measure the reflectance curve of a product’s colour every 10 nm or less [24]. The CIE L*a*b* system represents three-dimensional colour space having components of lightness (L*), red-green (a*), and yellow-blue (b*) [20,21]. An important aspect of the CIE L*a*b* system is that colour differences between specimens can be given as a single parameter-ΔE. Any colour change (ΔE*) in the range of 3.3 to 3.7 and above is considered to be clinically perceptible [22,24–26].
Staining susceptibility of composite resins could be attributed to their degree of water sorption and hydrophilicity of resin matrix [9,27–29]. If the resin matrix is capable of absorbing water, it is also capable of absorbing any other fluid, which ultimately leads to discolouration. Extreme water sorption causes the expansion and plasticizing of the resin, hydrolysis of silane, which in turn creates microcracks and leads to reduced longevity of the composite resin [30]. As a result, microcracks or interfacial gaps at the junction between the filler and matrix, allows stain penetration and discolouration [30–32].
The current study results reported that the pH of staining solutions were similar and alkaline in nature. This suggests that the colour changes after immersion in the various staining solutions can’t be attributed to pH related surface changes. Discolouration of materials is multifactorial in nature and they include titratable acidity, degree of resin polymerization as well as food colourant absorption/penetration [21,27].
Among all the staining solutions used, turmeric showed maximum staining capacity for all the tested composite resins. This is due to the known high colourant nature and natural staining capacity of turmeric [1]. Curcumin (3%) is the active substance in turmeric and is responsible for its yellow colour [3]. Differences in the sizes of particles and differential solubility of stains could also be the contributing factors [1]. When compared to turmeric, carmoisine showed least colour change values for all the tested RBCs. The basic colour of carmoisine is due to orange red dye. This orange red dye is having water soluble property which might be responsible for colour change in carmoisine group.
Among the tested RBCs, the least stainability was observed in Z 100 whereas, Z 250 XT showed a higher amount of stainability by all the tested solutions. The staining capacity of all the used staining solutions were statistically significant for all the tested RBCs (p<0.001).
The presence of UDMA makes the Z 100 composite to be more colour stable and hydrophobic. Even though Z 250 XT composite has UDMA, it shows more colour instability which might be due to additional constituents of resin matrix or the different percentage of UDMA in both composites which is not revealed by the manufacturer. In Z 250 XT nano hybrid composite, TEGDMA was added to decrease the viscosity of Bis-GMA resin. So the addition of TEGDMA, inspite of improving the handling properties, also shows water sorption property. The hydrophilic property of TEGDMA results in extreme water sorption which causes the expansion and plasticizing of the Bis-GMA resin, which leads to reduced longevity of the composite resin [28]. As a result, the microcracks or the interfacial gaps at the interface, between the filler and matrix, allow stain penetration and more discolouration.
Different studies [28] have determined the water sorption values of different resins. The water sorption value for the resin prepared from poly-Bis-EMA is 1.79 wt% [32] which is lower than the resin having Bis-GMA resin, i.e., 3.05 wt% [33–36]. The highest water sorption value (6.22 wt% [32]) was observed in resin having TEGDMA. These studies [28,33–36] have also shown that the presence of TEGDMA in materials cause a high amount of hydrophilic capacity and more sensation of Bis-GMA to tonality and water absorption in comparison to UDMA, which is more resistance to stain than Bis-GMA. It has been reported that water uptake in Bis-GMA-based composite resins has increased from 3 to 6% whereas, the proportion of TEGDMA increased from 0 to 1% [33–37]. UDMA seems to be more stain-resistant than Bis-GMA [25,28,33]. Under normal curing conditions, UDMA-based composite resins presented lower water sorption and higher colour stability [25] than other dimethacrylates in the resin matrix. Therefore, TEGDMA as a resin matrix in Z 250 XT might be responsible for more water sorption and ultimately results in least colour stability.
Similar results have been reported by Malhotra N et al., Yazici AR et al., and Villalta P et al., [1,11,38]. Villalta et al., investigated the effects of coffee and red wine staining solutions on Filtek Supreme (nanohybrid RBC) (ΔE*≈12.0) and Aesthet X (microhybrid RBC) (ΔE*≈3.9) [38]. Following staining, nanohybrid RBC changed colour more than the microhybrid RBC as a result of staining in coffee or red wine solutions. Yazici AR et al., observed the effects of two staining solutions (tea or coffee) on the colour stability of a hybrid RBC (Clearfil AP-X, ΔE*≈4.4) and a nanohybrid RBC (Filtek Supreme, ΔE*≈8.0) after different immersion periods [11]. Results showed hybrid RBC to be more colour stable than the nanohybrid RBC to coffee and tea stains and that stainability is resin-material dependent. Malhotra N et al., [1] observed the effects of three food stains (tea, tobacco, turmeric) on the colour stability of nano composite (Ceram-X-Mono, Dentsply) a microhybrid posterior (P60, 3M ESPE), and a universal microhybrid (Z 100, 3M ESPE) RBC. Results showed that the least amount of colour change was observed with the Z 100 (tea, ΔE =1.6; tobacco, ΔE =13.6; turmeric, ΔE=38.8) group. The higher filler content of Z 100 (66% by volume) could be responsible for its higher stain resistant property compared to P60 and Ceram-X-Mono (61% by volume), which have an approximately equal amount of fillers and thus similar staining.
Some authors hypothesized that pre-heating composite resin would increase composite flow, which, in turn, improves the adaptation of uncured resin to all the cavity margins and potentially reduce microleakage [39,40]. So, preheating of nanohybrid composite formulation with elimination of TEGDMA can be evaluated for colour stability in near future.
Limitation
As colour stability of composite depends upon factors like type of cavity design, etching and bonding procedures, degree of conversion, polishability, surface roughness, wear resistance to cyclic loading and thermal stresses, these should be considered as limitations of present study. This study will help in educating the patients regarding the staining properties of different food colourants on aesthetic restorative materials.
Conclusion
The current study showed that among the staining solutions used, turmeric showed maximum staining for all the tested resin based composites. Least stainability was observed in Z100, whereas, Z 250 XT showed higher amount of stainability by all the tested solutions used.
Conflict of Interest: The authors do not have any financial interest in the companies whose materials are included in this article.
Bis-GMA: 2, 2-bis {4-(3-methacryloxy-2-hydroxypropoxy) phenyl} propane; Bis-EMA: Ethoxylated bisphenol A glycol dimethacrylate; UDMA: Urethane dimethacrylate; TEGDMA: Triethyleneglycol dimethacrylate; PCDMA: Polycarbonate dimethacrylate
Statistical analysis by Tukey HSD Post-hoc test. Statistically significant if p < 0.05
Statistical analysis by Tukey HSD Post-hoc test. Statistically significant if p<0.05