From the sagittal view, if an imaginary line is drawn through the buccal cusp tips of the posterior teeth, following the plane of occlusion, a curved line that is convex for the maxillary arch and concave for the mandibular arch is established. This curve was first described by Spee in 1890 and was referred to as the curve of Spee [1]. The curve of Spee represents the arrangement of the planner mean of the curvature of occlusal surfaces of the mandibular teeth according to their individual positions in the arch. According to the Glossary of Prosthodontic terms (2005), the curve of Spee is defined as the anatomic curve established by the occlusal alignment of the teeth, beginning with the cusp tip of the mandibular canine and following the buccal cusp tips of the premolar and molar teeth, continuing through the anterior border of the mandibular ramus and ending at the anterior-most portion of the mandibular condyle [2]. Similar definitions have been proposed and employed by many researchers [3].
The slope of the articular eminence, incisal vertical overlap, molar cusp height, and the amount of posterior contact determine the morphologic arrangement of the teeth in the sagittal plane [4]. Synchronized relations between these characteristics and the curve of Spee ensure balanced occlusal function [5]. In young individuals several clinical situations such as removable and fixed partial dentures, multiple implants, cleft palate and prosthetic rehabilitation for maxillofacial injuries need re-establishment of occlusal plane. Hence, familiarity with the standard value of occlusal curvature aids in examination, diagnosis and treatment of occlusal disharmony.
As there are few reported studies, the purpose of this cross-sectional analytical study was to assess and compare the radius and depth of curve of Spee in maxillary and mandibular arches in men and women, in a group of young Indian population. The null hypothesis was that there would be no significant differences in the the radius and depth of curve of Spee in maxillary and mandibular arches in men and women.
Materials and Methods
The present analytical cross-sectional study was carried out at the Department of Prosthodontics and Crown and Bridge, Maratha Mandal’s NGH Institute of Dental Sciences and Research Centre, Belgaum, Karnataka, India, after approval by the Institutional Ethics Committee. The study cohort consisted of 25 men and 25 women, between the ages of 19 to 24 (mean age 21 years). Participants meeting the inclusion criteria were enrolled from a group of 200 healthy dental students of the institute. Only subjects willing to participate in the study were recruited, after informed written consent. All subjects had to meet the following inclusion and exclusion criteria [6,7].
Inclusion Criteria: 1) Complete permanent dentition, including the second molars (at least 28 teeth) with bilateral Angle Class I first permanent molar and canine relations. 2) Overjet and overbite of 2 to 4 mm.
Exclusion Criteria: 1) Severe caries or periodontal disease; 2) Dental restorations which cover cusps; 3) Severe attrition; 4) Severe malocclusion; 5) History of previous or current orthodontic treatment; 6) History of disorders of temporomandibular joint.
Impression of maxillary and mandibular arches were made with alginate impression material (Tropicalgin, Zhermack, Germany). The impressions were washed under running water, disinfected and poured using Type III dental stone (Pearl stone, Asian chemicals, Gujarat, India) to obtain a cast.
Set casts were oriented into the base former in such a way that the buccal surface of posterior teeth on the right side are parallel to the outer border of base former on the right side. The dental casts were trimmed in such a way that the occlusal plane was parallel to the base of the dental cast. The incisal edges of the central incisors and cusp tips of the most posteriorly positioned teeth present (second molars or third molars) were used to define the occlusal plane.
The right hand side of each cast was photographed by means of digital camera (Nikon Coolpix S4000, Nikon, Tokyo, Japan). It was ensured that the angle of incidence between the camera and the buccal surface of posterior teeth was always 90° [8]. The height of the camera was also set in a fixed position that correlated with the height of the dental casts. The camera to cast distance was kept at 50 cm and photographs were shot with maximum (4X) optical zoom. The camera and dental casts were placed on a sheet of cardboard and the positions clearly marked. As a result, photographs could be taken repeatedly without the risk of changing the setup, thereby, standardizing the degree of enlargement of all the photographs. Also, a millimeter graph paper was pasted on the right hand side of the cast to facilitate calibration of the image while recording the measurements on the computer screen. Each digital image of the dental casts was transferred to the computer for analysis. The radius and the depth of the curve of Spee were measured on the dental casts by means of trial version of computer software (Corel DRAW graphics suits X5, Corel corporation, New York, USA). All the images were enlarged to 800% (one of the standard settings in Corel DRAW X5). The steps followed during the electronic measurement of the curve of Spee were as follows:
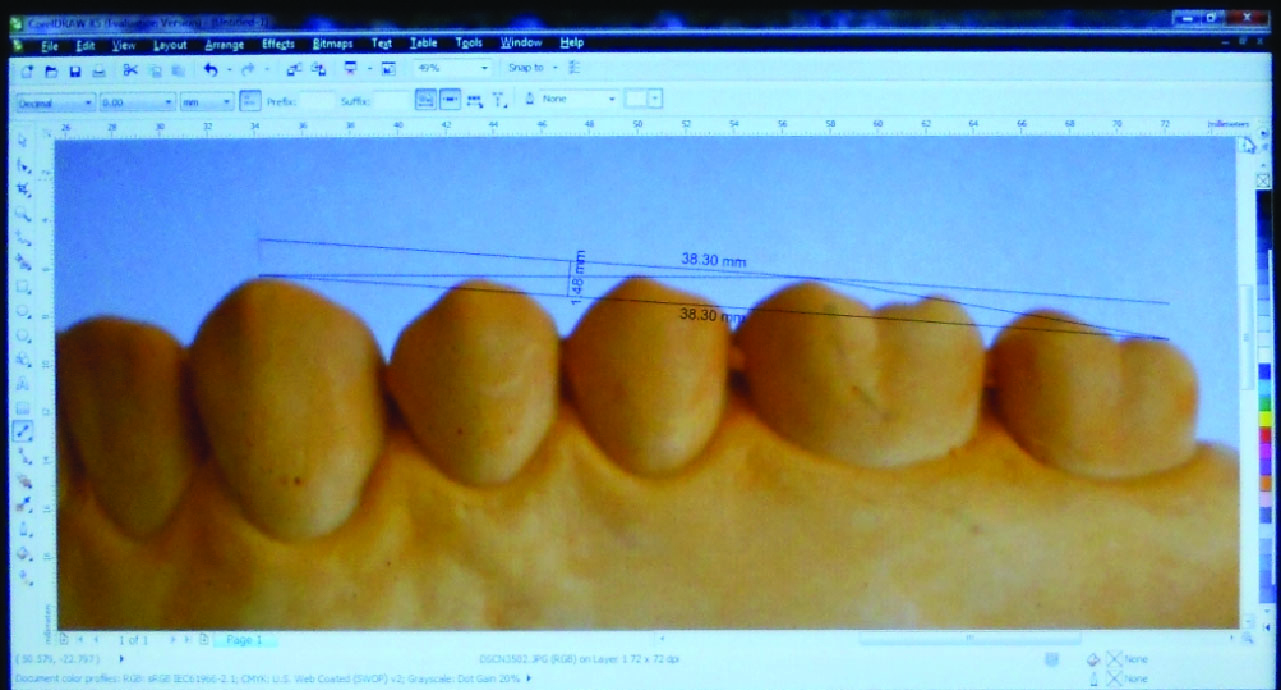
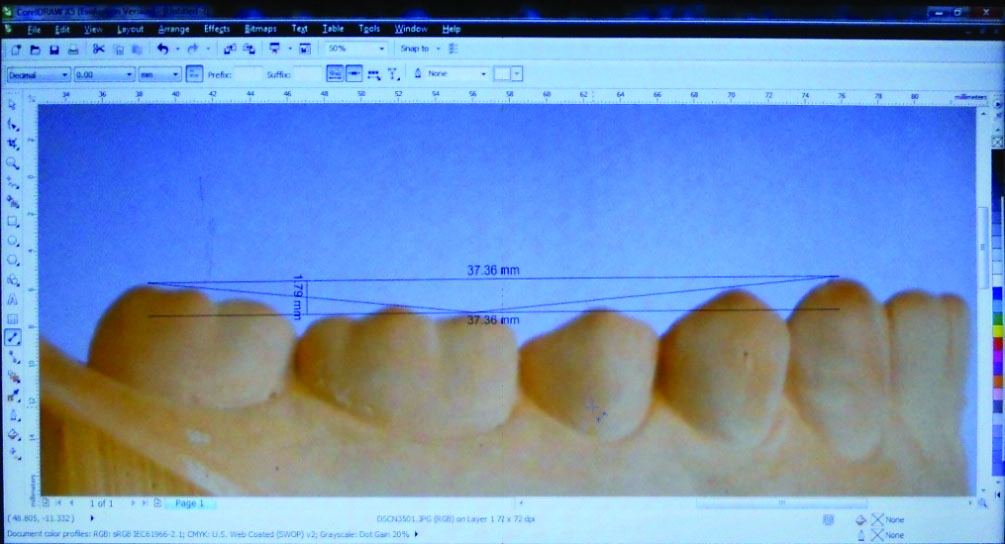
Measurement of Radius of Curve of Spee: The cusp tips of canine, the mesio-buccal cusp tip of the first molar, and distal cusp of second molar were identified and connected to form an arc. The width (W) of the arc was measured from the tip of canine to the tip of distal cusp of second molar, using the ruler that was adjusted to the horizontal magnification of millimeter graph paper. For measuring the height (H) of the arc, a perpendicular, to line joining tip of canine and disto-buccal cusp of second molar was drawn to the maximum curvature of the arc. Length of this line was measured using ruler that was adjusted to the vertical magnification of millimeter graph paper [Table/Fig-1,2]. Using the values for width and height radius of the circle was calculated using online calculator [9], which makes use of the formula Radius (r)=H/2+W2/8H, where:
Measurement of radius of curve of Spee in maxillary arch.
Measurement of radius of curve of Spee in the mandibular arch.
W is the length of the chord defining the base of the arc, H is the height measured at the midpoint of the arc’s base.
The individual values were transferred to a spread sheet (Microsoft® Excel 2000) and the total and average values for the radius of curve of Spee for each subject were calculated.
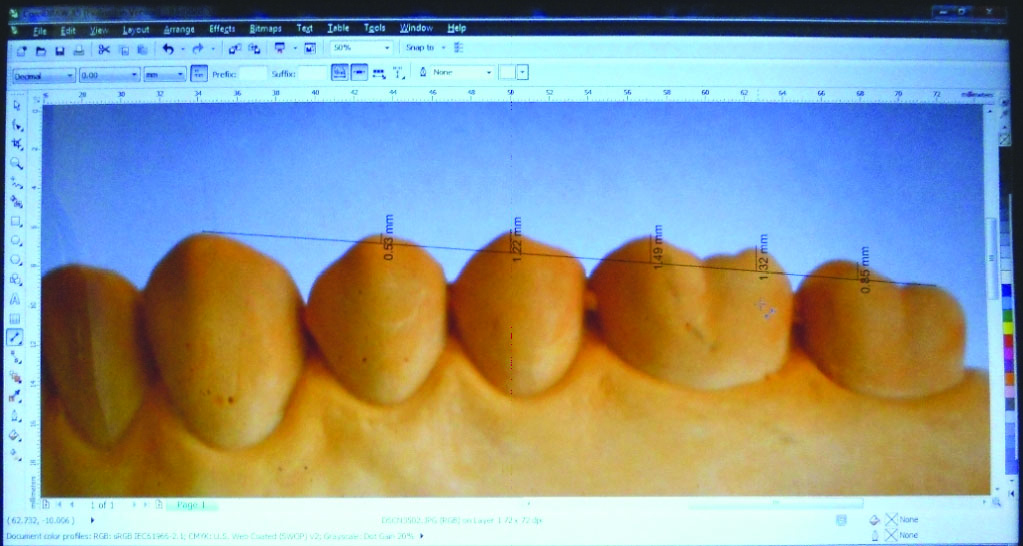
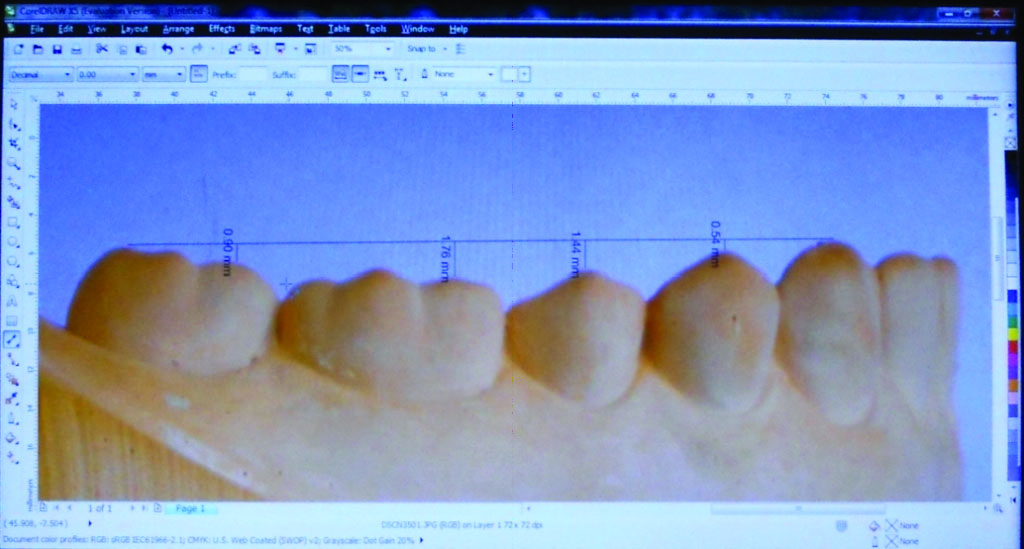
Measurement of Depth of Curve of Spee: A reference plane was drawn from the buccal cusp of the canine to the disto-buccal cusp tip of the second molar. (A “dimension tool” allows accurate measurement of the length of the perpendicular lines from the reference line to the cusp tip. The ruler was edited and adjusted to the magnification of millimeter graph paper pasted on the casts). Perpendicular lines were drawn from this line to the cusp tips of the premolars, the first molar, and the mesio-buccal cusp of the second molar. The deepest length defined the depth of the curve of Spee and was considered in this study [Table/Fig-3,4]. The individual values of the lengths of the perpendicular lines were transferred to a spreadsheet (Microsoft® Excel 2000) and the total and average values for the curve of Spee for each subject were calculated.
Measurement of depth of curve of Spee in the maxillary arch.
Measurement of depth of curve of Spee in mandibular arch.
Statistical Analysis
Descriptive data was presented as mean and standard deviation. Mann-Whitney U test was used to analyze the difference in the curve of Spee between men and women and the difference between maxillary and mandibular arches. Statistical analysis was done with SPSS version 18.0. The level of statistical significance was defined as α = 0.05.
Results
The mean and standard deviations of radius and depth of the curve of Spee in the maxillary arch and in the mandibular arch of the entire sample are shown in [Table/Fig-5]. In the maxillary arch, there was no statistically significant difference in the radii (p=0.2483) and depths (p=0.4263) of curve of Spee between men and women. In the mandibular arch, the difference in the radii (p=0.0467) was statistically significant, although the difference in the depths (p=0.5032) was not statistically significant [Table/Fig-5].
Comparison of men and women with respect to radius (mm) and depth of curve of Spee in maxillary and mandibular arches by Mann-Whitney U test.
| Variable | Gender | Radius (mm) | Depth (mm) |
|---|
| Mean±SD | p-value | mean±SD | p*-value |
|---|
| Maxillary arch | Men | 140.22±65.98 | 0.2483 | 1.65±0.67 | 0.4263 |
| Women | 120.58±63.91 | 1.45±0.54 | |
| Mandibular arch | Men | 109.67±46.80 | 0.0467* | 1.49±0.74 | 0.5032 |
| Women | 98.31±63.59 | 1.40±0.61 | |
*p<0.05
In men, the difference in radius (p=0.0971) and depth (p=0.7052) of curve of Spee between maxillary and mandibular arches were not statistically significant. In women, the difference in radius (p=0.0467) between maxillary and mandibular arches was statistically significant, although the difference in the depths (p=0.7785) of curve of Spee were not statistically significant [Table/Fig-6].
Comparison of maxillary and mandibular arches with respect to radius (mm) of curve of Spee and depth (mm) of curve of Spee in men and women by Mann-Whitney U test.
| Variable | Arch | Men | Women |
|---|
| Mean±SD | p-value | Mean±SD | p-value |
|---|
| Radius | Maxillary arch | 140.22±65.98 | 0.0971 | 120.58±63.91 | 0.0467* |
| Mandibular arch | 109.67±46.80 | 98.31±63.59 |
| Depth | Maxillary arch | 1.65±0.67 | 0.7052 | 1.45±0.54 | 0.7785 |
| Mandibular arch | 1.49±0.74 | 1.40±0.61 |
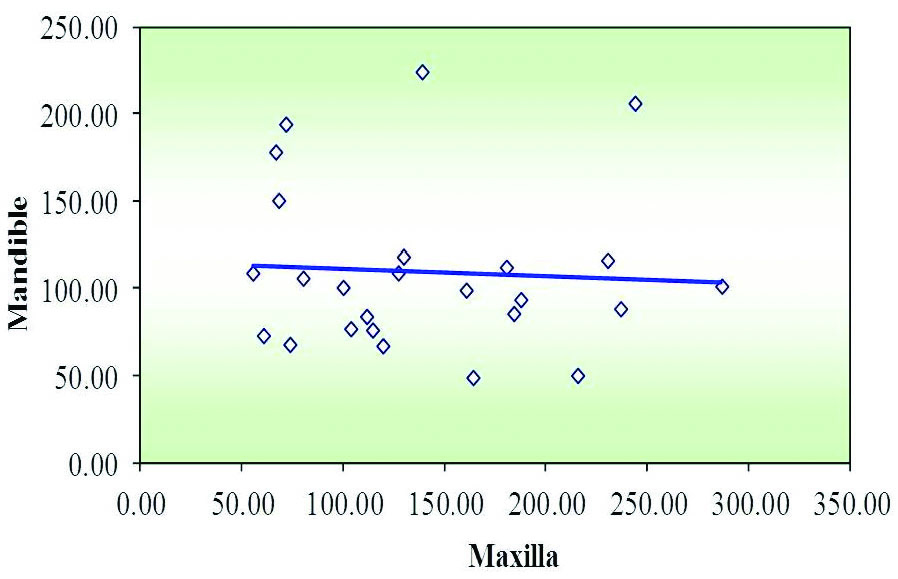
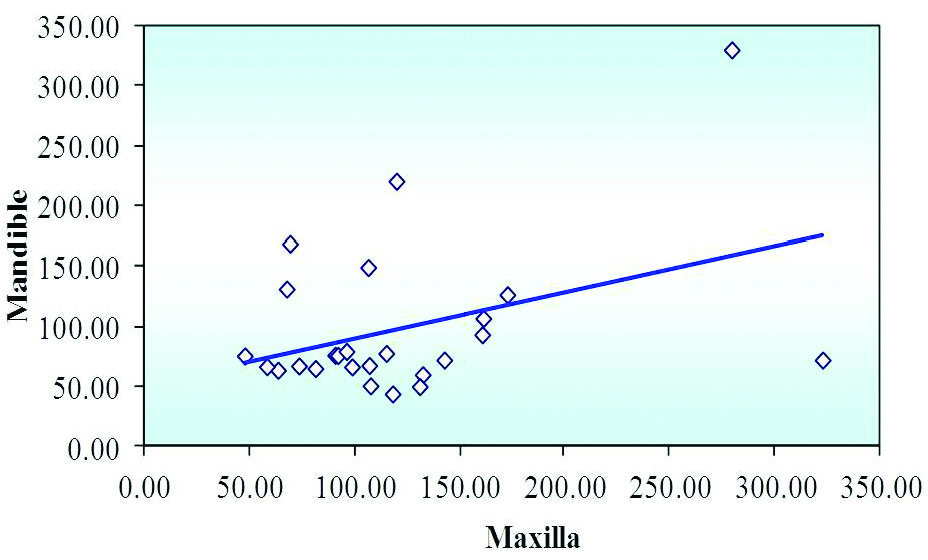
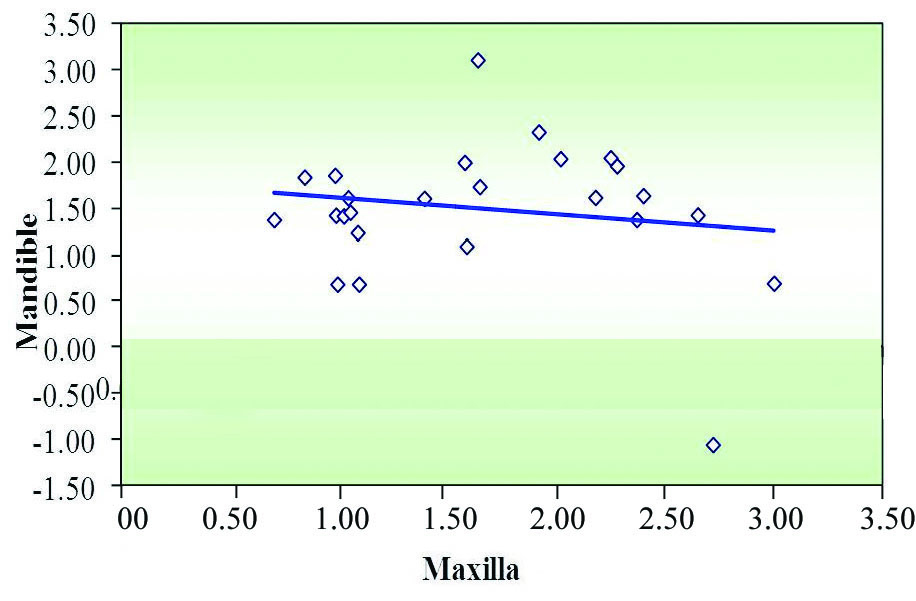
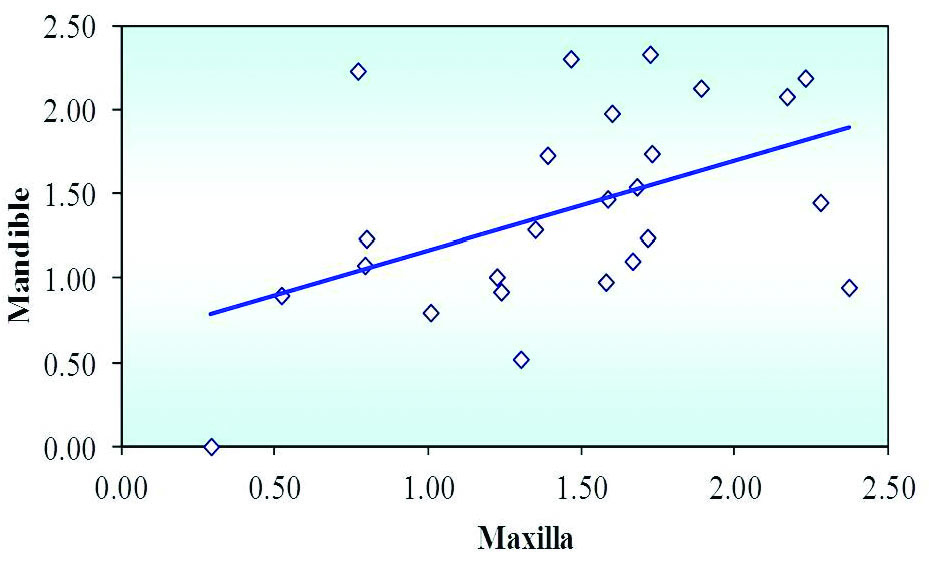
The regression equations derived for relationship maxillary and mandibular arches with respect to radius and depth of curve of Spee in men and women are shown in [Table/Fig-7,8,9,10 and 11].
The regression equations derived for relationship maxillary and mandibular arches with respect to radius and depth of curve of Spee in men and women.
| Variable | Regression equation i.e., y=a+bx |
|---|
| Men | Women |
|---|
| Radius | y=115.7554-0.0433x | y=52.0563+0.3836x |
| Depth | y=1.79550-0.1835x | y=0.6296+0.5352x |
Where y is the curve of Spee in the mandibular arch, and x the curve of Spee in the maxillary arch
Scatter diagram indicating correlation between radius (mm) of curve of Spee in maxilla and mandible in men (y=115.76-0.0434x).
Scatter diagram indicating correlation between radius (mm) of curve of Spee in maxilla and mandible in women (y=52.0563+0.3836x).
Scatter diagram indicating correlation between depth (mm) of curve of Spee in maxilla and mandible in men (y=1.7955-0.1835x).
Scatter diagram indicating correlation between depth (mm) of curve of Spee in maxilla and mandible in women (y=0.6296+0.5352x).
Discussion
One of the key clinical steps in the rehabilitation of multiple long span posterior restorations is the re-establishment of occlusual plane. The restoration of compensating curves forms the basis for ideal teeth arrangement [10]. The purpose of this analytical cross-sectional study was to assess the radius and depth of curve of Spee in maxillary and mandibular arches and effect of gender on the curve of Spee in a group of young Indian population. The radius and depth of curve of Spee was larger in the maxillary arch than mandibular arch in both men and women. Although outcome of several studies indicate that the occlusal curvature of the mandibular arch is not significantly influenced by sex [11], in our study the difference in the radii was statistically significant between men and women [Table/Fig-5]. Also, in women, the difference in radii between maxillary and mandibular arches was statistically significant [Table/Fig-6]. The assessment of influence of age was beyond the scope of the present study, however, studies have reported that there is a natural tendency for the depth and radius of the curve of Spee to decrease with age [12].
It is necessary to give an appropriate occlusal curvature proportionate to the natural dentition under the conditions associated with posterior disocclusion, anterior guidance, condylar guidance, inclination of the plane of orientation, height of the cusp, and other occlusal elements [8]. The curve of Spee allows protrusive disocclusion of the posterior teeth by the synchronization of anterior guidance and condylar guidance [13]. The curve of Spee enhances the crush-shear ratio between the posterior teeth and thus, improves masticatory efficiency of the posterior teeth [14]. Tooth size can differ in different populations and ethnic groups. These differences in some cases are considerable. For example, reported studies show that black Americans have larger teeth than white Americans and men have larger teeth than women [15,16]. Hence, it is important to know the values of depth of curve of Spee for the specific age group and in a given population. Surprisingly, the curve of Spee has been interpreted differently by researchers and this is reflected in their approach to quantification. The methods used by researchers vary from photographic, study models, radiographic to 3D dimensional scans as detailed in [Table/Fig-12].
Various methods followed by researchers for the measurement of curve of Spee.
| Authors | Method and Measurements |
|---|
| Marshall SD et al., [17] Ahmed I et al., [18] | Digital caliper vertically mounted on a dental surveyor used to measure the maximum depth on leveled study models. The sum of the right and left greatest perpendicular distances divided by 2 where the reference line is from the central incisors to the distal cusp tip of the most posterior tooth. |
| Cheon CH et al., [19] | Used computer software, 3D models and lateral cephalograms. The measurements of the curve of Spee were taken from the occlusal plane to the deepest perpendicular point to the buccal cusp tip and these distances were averaged between the right and left sides. The occlusal plane was defined as the midpoint of the centers of the right and left incisor edges as well as the distobuccal cusp tips of the right and left molars. |
| Dager MM et al., [20] | Measured the curve of Spee from dental casts using digital calipers. A flat plane was constructed over the incisal edges of the mandibular incisors to the mandibular first molar cusps and perpendicular distances were then measured from this plane to the most inferior aspect. This was repeated on both sides and an average taken. |
| Bernstein RL et al., [21] | Used lateral cephalometric radiographs to create a perpendicular for curve depth analysis, similar to methods utilizing study models. |
| Lie F et al., [22] | Standardized photographs of mandibular study models were used. Photographs were taken in a plane perpendicular to the occlusal plane tangent to the buccal surface of the first molar and canine and centered on the first premolar, from the left and right sides. Magnification was determined by a ruler incorporated in all the photographs. Measurements of fixed landmarks on the photographs, to determine the curve of Spee were carried out on both left and right sides. |
| Xu H et al., [3] | Standardized digital images of the right side of the maxillary and mandibular dental casts were made and transferred to a computer. The cusp tips of canines, premolars and molars of the maxillary and mandibular arches were recognized. The radius and the depth of the curve of Spee were calculated on the images of dental casts with the help of a computer software Occlcircle. |
| De Praeter J et al., [23] | Utilized photographs of study models and the creation of reference lines from the incisal edge of the central to the distal cusp tip of the first molar. This reference line served as a reference point from which perpendicular reference planes could be constructed to the lateral incisor, canine, first and second premolar and the mesio-buccal cusp of the first molar. These lines served as a means of measuring the depth of the curve. |
| Farella M et al., [24] | Dental casts and lateral cephalograms were used for the study. Second-order quadratic interpolation of buccal cusp tips obtained from lateral digital photographs of the teeth were used to determine the extent of concavity of the curve of Spee. |
| Ferrario VF et al., [6,7] | Analyzed digitized dental casts (3D method), excluding the third molars with three coordinates of cusp tips, recorded with a three-dimensional digitizer and used to derive a spherical model of the curvature of the occlusal surfaces. The radii of the left and right curves of Spee and the molar curve of Wilson were computed from the best interpolating sphere. |
| Braun S et al., [25] | Used study models. Measured the depth of the curve of Spee from a flat plane, which was formed by the tips of the mandibular incisors anteriorly and the distal cusp tips of the second molars. The greatest depths of both the right and left sides were measured using a Brown and sharp precision coordinate measuring machine, where the touch trigger probe has a precision of 0.006 mm. |
| Bishara SE et al., [26] | Used study models. The mean of perpendicular distances from the cusp tips of the canine, premolars and mesio-buccal cusp of the first molar to a reference line drawn from the incisal edge of the central incisor to the distal cusp tip of the second molar were considered for the measurement of curve of Spee. |
| Sondhi A et al., [27] | Used integrated data from lateral cephalometric radiographs and study models. The sum of the perpendicular lengths from cusp tips of canine, premolars and mesio-buccal cusp tip of the first molar to the occlusal plane (line joining disto-buccal cusp of the first molar and incisor) from the right side was considered. |
In this study, a combination of trial version of computer software and online calculator was used for the measurement of radius and depth of the curve of Spee. The method used in this study permitted accurate measurement of depth and radius of curve of Spee, as the image could be enlarged several times (800%) of the actual size and also measurements were taken to the extent of fraction of millimetre. Also, the method can be considered as an inexpensive alternative to other methods.
The curve of Spee is often called “the compensating curve”, since it compensates the movement of the jaw during mastication, such compensation, should precisely be applied when prosthodontic reconstruction is to be undertaken. Posterior tooth interferences can lead to hyperactivity in the temporalis and masseter muscle [28]. Restorations with appropriate anterior guidance help in preventing wear, fracture of restorations and tempormandibular joint dysfunction.
Limitation
The study outcome is based on non probability sampling method.
Conclusion
The radii and depths of curve of Spee were larger in maxillary than mandibular arches in both men and women. In the mandibular arch, the difference in the radii was statistically significant between men and women. In women, the difference in radii between maxillary and mandibular arches was statistically significant.
*p<0.05
Where y is the curve of Spee in the mandibular arch, and x the curve of Spee in the maxillary arch