Oral health is a condition in which people can speak, eat and socialize without active (oral) disease, discomfort or embarrassment [1]. While having good levels of oral health is important in itself, it has also been linked to general health. However, levels of oral health are not equally distributed throughout the population, as there are inequalities in terms of socio-economic position [2]. Socio Economic Status (SES) is the most powerful predictor of future experience of poor oral health and behaviour factors may well function as a mediator between social disparities and health outcomes [3].
Cognitive ability is the capacity to perform higher mental processes reasoning, remembering, understanding and problem solving [4]. Cognitive function change throughout one’s life, the change can be physiological/pathological and can occur in one/more multiple cognitive domains.
Cognitive dysfunction may lead to poorer self care, societal processes and socio-economic characteristics are considered the underlying determinants of oral health thereby, impairing oral health status and influence proximal risk factors of oral health. Low cognitive ability in early life may lead to socieconomic inequalities in oral health [5].
Previous studies by Gottfredson LS and Deary IJ, DearyIJ and Singh–Manoux et al., [6–8] have reported that poorer cognitive ability is one of the factor which impair socio-economic achievements and there by leading to poorer general and oral health. An inflammatory pathway linking periodontal disease and cognition or the commonality of the social determinants is a possible causeway for the relationship between oral health and cognitive ability [9].
Definitive research investigating impact of oral health on one’s cognitive ability is limited. Due to many confounding factors, the association between cognitive ability and oral health is very difficult to prove. Previously oral health has not been associated with cognitive ability as there is no general separation of medicine and dentistry [10].
Worse dentition has been found to be associated with cognitive impairment in older age groups, but it has not been established whether these associations are present solely in later life (with neuro degenerative processes implicated) or whether they are present in younger age group as well [11].
The possible influence of social determinants in general and oral health has mainly been investigated in adults and older people. There are limited nationally representative data profiling the oral health of adolescents in India. Few studies from India have evaluated the association of socio-economic variations in oral health among adolescents [12]. Furthermore, none of the studies from India and globally have reported the role of cognitive ability as a determinant of socio-economic and oral health status among adolescents.
Hence, the aim of present study was to establish the role of cognitive ability as a determinant of socio-economic status and oral health in 17-19 years aged students studying in colleges of Bengaluru city. The objectives of the study were to examine whether changes in the indicators of SES are associated with oral health after adjustment for indicators of cognitive ability and to examine whether indicators of cognitive ability are associated with oral health after adjustment for indicators of SES.
Materials and Methods
This was a cross-sectional study of 1000 participants of 17-19 year age adolescent from different socio-economic groups according to location of college namely urban slums, middle class and upper middle class areas in city of Bengaluru, Karnataka, India [13]. Six government and six private degree colleges were selected by multi-stage random sampling, where Bengaluru city was divided into North and South zones (Colleges in urban area of Bengaluru are divided into North and South Zones) [13]. Next cluster random sampling was done where in the colleges (three government and three private colleges) were selected from both the zones. Colleges were selected in such a way that there was homogeneous representation from all the courses. In the last stage, the subjects were selected using systematic random sampling method.
Study protocol was reviewed and approved by Ethical Review Board, The Oxford Dental College and Hospital, Bengaluru, Karnataka, India. Written informed consent from the participants and permission was obtained from the Principals of all the private and government colleges selected for the study.
Cognitive ability was assessed by Digit Symbol Substitution Test (DSST) and Digit Span Test (DST) [14].
The DSST is a test of visuomotor coordination, motor persistence, sustained attention and response speed. Rapid information is required in order to substitute the symbols accurately and quickly. The test consists of a sheet in which numbers 1-9 are randomly arranged in 4 rows of 25 squares each. The subject substitutes each number with a symbol using a number – symbol key given on the top of the page. The first ten squares are for practice. The investigator demonstrates first three squares to subject and the following for squares are practiced by the patient under the guidance of the investigator. This test is not administered to illiterate subjects. This test also examines information processing speed, concentration and motor control.
Digit symbol substitution test.
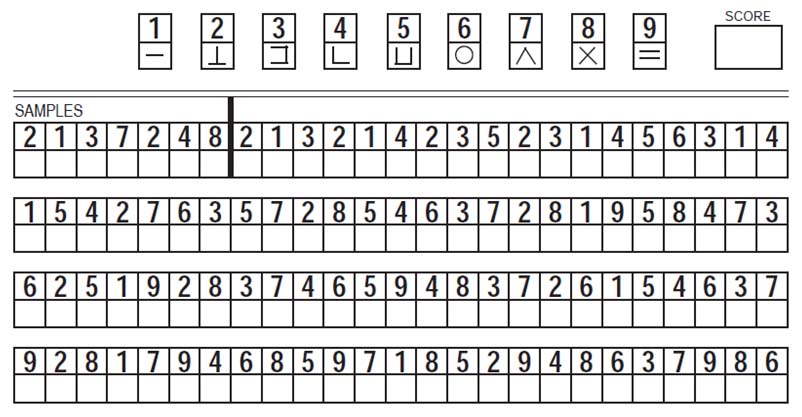
Interpretation of Scores: Only the squares with correctly matched symbols and the digits were considered. Mean value and standard deviation were calculated for the group based on age, gender and educational status. Percentiles were calculated and the individuals were categorized based on their scores which are as follow: < 50, 51-60, 61-71, 71, 81-90.
Digit Span Test: It has two parts, digits forward and digits backwards. Examinee was required to repeat 2-9 digits forward and 2-9 digits backwards. Test measures short-term memory, attention, and concentration. Short-term memory represents the actual quantity of information, the subject takes in through his or her eyes and ears.
Interpretation of the Score: 12–15 (80–100 percentile), 11 (60–80 percentile), 10 (40–60 percentile), 9 (20–40 percentile), 1–8 (0–20 percentile).
SES was assessed by educational qualification and occupation of the head of the family and total monthly income using modified Kuppuswamy scale [15].
| Education | Score |
| Professional or Honors | 7 |
| Graduate or Postgraduate | 6 |
| Intermediate/Post-High-School Diploma | 5 |
| High School Certificate | 4 |
| Middle School Certificate | 3 |
| Primary School or Literate | 2 |
| Illiterate | 1 |
| Occupation | Score |
| Profession | 10 |
| Semi-Profession | 6 |
| Clerical/Shop-owner/Farmer | 5 |
| Skilled worker | 4 |
| Semi-skilled worker | 3 |
| Unskilled worker | 2 |
| Unemployed | 1 |
| Family Income per Month (in Rs)* | Score |
| ≥Above 28485 | 12 |
| 14245- 28484 | 10 |
| 10655-14244 | 6 |
| 7122-10654 | 4 |
| 4273-7121 | 3 |
| 1426-4272 | 2 |
| ≤1425 | 1 |
| Total Score | Socio-Economic Class |
| 26- 29 | Upper (I) |
| 16- 25 | Middle Upper Middle (II) |
| 11-15 | Lower Middle (III) |
| 5-10 | Lower Upper Lower (IV) |
| < 5 | Lower |
Consumer Price Index (CPI) was used to calculate the income in modified Kuppuswamy’s scale for April 2011 in the following manner:
Price index by old base for 1998 was 405
Price index by old base for 2001=458
Price index by new base for 2011=100
Price index by new base for 1998=100/458 * 405 = 88.42
All India average consumer price index numbers for industrial workers (base 2001=100) shows general index as 187 on April 2011: http:// labourbureau.nic.in/indexes, htm – Labour Bureau Government of India. Now the prices from 1998 levels have increased and that increase can be obtained by multiplying prices of that time by the factor obtained as follows: 187/88.428 = 2.11. So, the income for the present year was calculated by multiplying the income of year 1997 by a factor 2.11.
Oral health status was assessed by extent of gingival bleeding, presence or absence of calculus, loss of attachment using Community Periodontal Index (WHO) [16]. Decayed, missing and filled teeth status was assessed using the DMFT [17].
Total number of government (government and government aided) and private colleges in Bengaluru city are 62 and 108 respectively. In the South zone, the number of government (government and government aided) and private colleges are 32 and 60 respectively and in North zone, the number of government (government and government aided) and private colleges are 30 and 45 respectively. Based on the assumption of conservative estimate prevalence of cognitive ability of 50% (as there was no previous literature on cognitive ability), 10% margin of error, 5% precision and design effect of 2 (for cluster random sampling) for 95% confidence interval, sample size was estimated to be 768. Assuming the non-response rate of 20%, the sample size thus, obtained is 960 which were rounded off to 1000.
The examiner was trained by qualified Neuropsychiatrist from the Department of Neuropsychiatry, National Institute for Mental Health and Neurosciences, Bengaluru, for assessment of cognitive ability by digit symbol substitution test and digit span test.
Calibration was done by assigning 20 subjects in the age group of 17-19 years on whom the examiner examined independently. For determination of intra examiner variability, the 10 subjects were recalled on different days and the examinations were repeated by the examiner. The Kappa co-efficient value (K) for intra examiner reliability for the examiner was 0.89 for Community Periodontal Index and 0.88 for DMFT and DMFS. Intra examiner reliability for the examiner was 0.82 for DSST and 0.78 for DST.
An interviewer administered questionnaire and non-invasive clinical examination were carried to gather the relevant data. Questionnaire was pretested on 100 participants. The content validity was assessed by a panel of six experts. Aiken’s ‘v’ was used to quantify the concordance between experts for each item. The Aiken’s ‘v’ value thus, obtained was 0.94. To assess the reliability of questions, split half technique was used and Cronbach’s alpha was calculated. Correlations ranged between 0.77-0.86.
Subjects with sensory motor deficit, mental retardation, substance abuse, history of psychiatric and neurological illness and those undergoing orthodontic treatment were excluded.
Statistical Analysis
The statistical software namely Statistical Package for the Social Sciences (SPSS) 15.0 was used for the analysis of the data. Significance was assessed at 5% level of significance. The following assumptions on data were made, Dependent variables should be normally distributed, samples drawn from the population should be random, and cases of the samples should be independent.
Pearson’s correlation test was used to find correlation between the oral health indicators and cognitive ability. Spearman’s correlation test was used to find correlation between SES and cognitive ability; t-test was used to compare means of cognitive ability tests based on gender. Chi-square test was used to check the association of cognitive ability with oral health indicators and SES. Multiple linear regression analysis was done to check the effect of cognitive ability on oral health indicators after adjusting for SES and multiple logistic regression analysis was done to check the effect of SES on oral health indicators after adjusting for indicators of cognitive ability.
Results
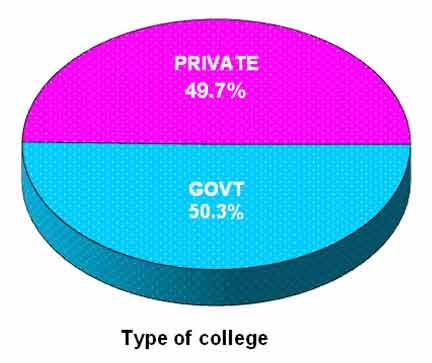
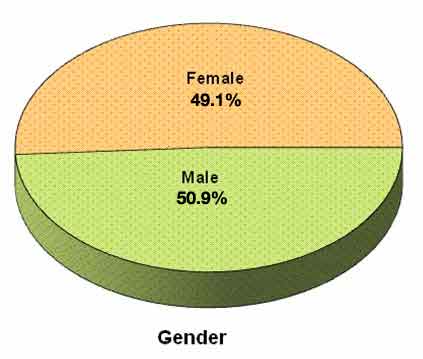
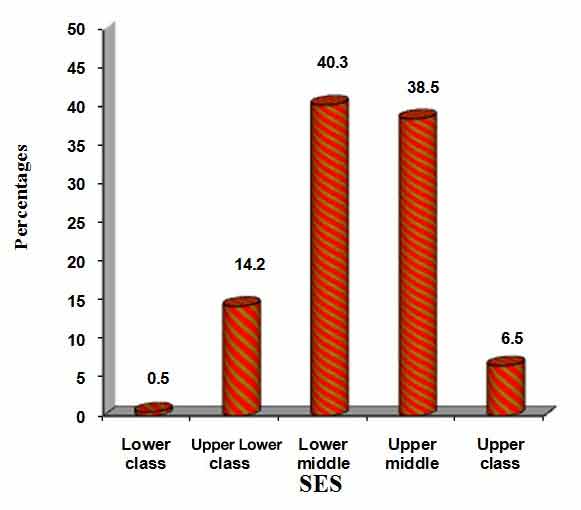
A total of 1000 adolescents participated in the study, of which 503 (50.3%) were from government colleges and 497 (49.7%) were from private colleges [Table/Fig-2]. A total of 491(49.1 %) female students and 509 (50.9%) male students participated in the study [Table/Fig-3]. A total of 65 (6.5%) students were from upper class, 385 (38.5%) students were from upper middle class, 403 (40.3%) students were from lower middle class, 142 (14.2%) students were from upper lower class, 5(0.5%) students were from lower class [Table/Fig-4].
Distribution of first grade college students based on type of college.
Distribution of first grade college students based on gender.
Distribution of first grade college students based on socio economic status.
Female students showed a significantly higher DSST mean score (65.12±11.70) and DST mean score (9.87±2.11) as compared to males [Table/Fig-5]. Private college students showed significantly higher DSST mean score (66.53±10.06) and DST mean score (10.08±2.03) as compared to government college students. Government college students showed a significantly higher mean CPI score (4.13±3.09) as compared to private college students [Table/Fig-6].
Distribution of first grade college students based on mean score of oral health indicators and cognitive ability according to gender.
| Variables | Male | Female | p-value |
|---|
| DSST | 61.92±12.95 | 65.12±11.70 | <0.001** |
| DST | 9.24±2.33 | 9.87±2.11 | <0.001** |
t-test was used to compare means of cognitive ability tests based on gender
p<0.01 statistically strongly significant
Distribution of first grade college students based on mean score of oral health indicators and cognitive ability according to type of college.
| Variables | Government | Private | p-value |
|---|
| DSST | 60.64±13.77 | 66.53±10.06 | <0.001** |
| DST | 9.05±2.32 | 10.08±2.03 | <0.001** |
| CPI | 4.13±3.09 | 3.69±3.21 | 0.028* |
t-test was used to compare means of cognitive ability tests based on gender
p<0.01 statistically strongly significant; p< 0.05 moderately significant.
The mean DSST and DST scores in the present study were 63.55±12.43 and 9.56±2.25 respectively. The mean scores of CPI, DMFT and DMFS were 3.91±3.16, 1.51±2.87, 2.42±5.39 respectively [Table/Fig-7].
Distribution of first grade college students based on mean score of oral health indicators and cognitive ability.
| Variables | Mean | SD |
|---|
| DSST score | 63.55 | 12.43 |
| DST score | 9.56 | 2.25 |
| CPI score | 3.91 | 3.16 |
| DMFT | 1.51 | 2.87 |
| DMFS | 2.42 | 5.39 |
SES had a small positive correlation with both the DSST and DST scores i.e., correlation coefficient (r) values of 0.304 and 0.297 respectively, indicating that better socio-economic status the better was the cognitive ability among the first grade college students. Similarly CPI, DMFT, DMFS had a small negative correlation with the DSST and DST scores, the correlation coefficient (r) value being -0.293, -0.175, -0.246 and -0.296, -0.169, -0.242 respectively. This correlation indicates that poor oral health was significantly associated with poor cognitive ability. Correlation between the SES, CPI, DMFT, DMFS scores with the DSST and DST scores was statistically significant (p<0.001) [Table/Fig-8,9].
Correlation of socio economic status with cognitive ability among first grade college students.
| Clinical Variables | Clinical Variables | SD |
|---|
| r-value | p-value | r-value | p-value |
|---|
| SES | 0.304 | <0.001** | 0.297 | <0.001** |
Spearman’s correlation coefficient test was used find correlation between socio economic status and cognitive ability. r value 0.3-0.5 indicates moderate correlation. p<0.01 statistically strongly significant, p< 0.05 moderately significant
Correlation of oral health indicators with the cognitive ability among first grade college students.
| Clinical Variables | DSST | DST |
|---|
| r-value | p-value | r-value | p-value |
|---|
| CPI | -0.293 | <0.001** | -0.296 | <0.001** |
| DMFT | -0.175 | <0.001** | -0.169 | <0.001** |
| DMFS | -0.246 | <0.001** | -0.242 | <0.001** |
Pearson’s correlation coefficient test was used find correlation between oral health indicators and cognitive ability, r-value 0.1-0.3 indicates small correlation, 0.3-0.5 indicates moderate correlation, p<0.01 statistically strongly significant, p< 0.05 moderately significant
When multivariate analysis was done to assess the correlation between the SES with the DSST and DST scores, a positive correlation was seen with the coefficient correlation (r) value being 0.581 and 0.102 respectively. Similarly CPI, DMFS had a significantly strong negative correlation with the DSST scores, the correlation coefficient (r) value being -0.750, -0.887. Correlation coefficient values of -0.141 and -0.162 were obtained indicating a significantly small negative correlation between CPI, DMFS and DST scores. A strong positive correlation was seen with the coefficient correlation (r) value being 0.746 and 0.148 when correlated for DMFT scores with DSST and DST scores. The coefficient of determination (R2) was 17.2% obtained in the multivariate model indicating that DSST scores attributed for 17.2% of variance in the SES, CPI, DMFT, DMFS scores. Similarly DST scores attributed for 16.9% of variance in the SES, CPI, DMFT, DMFS scores. Hence, cognitive ability predicts for nearly 17% of variance in the oral health status of the first grade college students [Table/Fig-10].
Multivariate analysis of oral health indicators, socio economic status with cognitive ability among first grade college students.
| Clinical Variables | DSST | DST |
|---|
| r-value | p-value | r-value | p-value |
|---|
| SES | 0.581 | <0.001** | 0.102 | <0.001** |
| CPI | -0.750 | <0.001** | -0.141 | <0.001** |
| DMFT | 0.746 | 0.032* | 0.148 | 0.019* |
| DMFS | -0.887 | <0.001** | -0.162 | <0.001** |
| R2 % | 17.2% | 16.9% |
| p-value | <0.001** | <0.001** |
Multivariate analysis was performed, R2 is the coefficient of determination which indicates the proportion of the variance dueoral health indicators and SES on cognitive ability, p<0.01 statistically strongly significant, p< 0.05 moderately significant . * moderately significant
** strongly significant
The association between oral health indicators, SES remained significant after adjustment for cognitive tests [Table/Fig-11].
Effect of adjustment for cognitive tests on socio economic inequalities in oral health among first grade college students.
| r-value | R2 | p-value |
|---|
| Effect of SES on CPI adjusting DSST and DST | 0.291 | 20.7% | <0.001** |
| Effect of SES on DMFT adjusting DSST and DST | 0.38 | 33.2% | <0.001** |
| Effect of SES on DMFS after adjusting for DSST and DST | 0.40 | 26.1% | <0.001** |
Multiple logistic regression was performed, R2 is the coefficient of determination which indicates the proportion of the variance due to SES on oral health indicators after adjusting for cognitive ability. p<0.01 statistically strongly significant, p<0.05 moderately significant
The association between oral health indicators, cognitive tests remained significant after adjustment for socio economic status [Table/Fig-12].
Effect of adjustment for socio economic inequalities on cognitive ability in oral health among first grade college students.
| r-value | R2 | p-value |
|---|
| Effect of DSST on CPI adjusting SES | -0.164 | 20.8% | <0.001** |
| Effect of DST on CPI adjusting SES | -0.461 | 20.9% | <0.001** |
| Effect of DSST on DMFT adjusting SES | -0.226 | 33.1% | <0.001** |
| Effect of DST on DMFT adjusting SES | -0.437 | 33.9% | <0.001** |
| Effect of DSST on DMFS adjusting SES | -0.166 | 27.2% | <0.001** |
| Effect of DST on DMFS adjusting SES | -0.398 | 26.0% | <0.001** |
Multiple linear regression was performed, R2 is the coefficient of determination which indicates the proportion of the variance due to cognitive ability on oral health indicators after adjusting for SES, p<0.01 statistically strongly significant, p< 0.05 moderately significant
Discussion
Social determinants of health refer to both specific features of and pathways by which societal (including cultural) conditions affect health and well-being. Generally social determinants interact with genetic components and personal determinants which develop an individual’s biology, risk behaviours, environmental exposures, and access to resources that ultimately promote health. A graded relationship between social position and health status affects all persons in the social hierarchy [18]. Social determinants for oral health are same as the social determinants of health and have an impact on the oral status of the individuals belonging to different social strata [19].
Over the last few decades, there have been improvements in oral health in India. However, inequalities in oral health exist throughout the region. Studies point to one thing that social class or SES affect oral health in particular risk for caries and periodontal disease in Indian population [20]. This can be explained on the basis of factors such as low income. Lower the economic status has direct relation with educational status, affordability, health vocation, standard of living and life style which thereby increases the susceptibility for dental caries [21].
In the present study, we have measured oral health status of the students by assessing gingival bleeding, presence of calculus on probing, loss of attachment, decayed, missing and filled teeth and surfaces. All these indictors of oral health had a strong association with the cognitive tests. The reason for this is that cognition of an individual allows them to reason, critically think and act in a particular situation; this in turn influences the oral health behaviour and practices of the individuals; thus, affecting the oral health status.
A strong association was seen between the SES and the oral health status of the students. Studies conducted among adolescents [22,23] and adults have shown similar results [24]. Various researchers have shown that social class and deprivation gradients exist in dental caries, periodontal diseases, tooth loss, and edentulousness in adults and children [25–27].
Poorer cognitive ability was associated with poorer dental status namely missing and decayed tooth surfaces and inversely associated with better dental status namely filled tooth surfaces, similar findings were reported by Stewart R et al., for periodontal health and loss of teeth [11]. Other dental studies have shown a direct relationship between poor cognitive ability and poor oral health, but most of them were conducted among elderly with poor cognitive ability [28] and focused on periodontal health [29,30].
SES consists of education, occupation and income [15]. So the knowledge, affordability and awareness have an impact on the general and oral health of the individual.
In the present study, moderately significant positive correlation was seen between SES and cognitive ability and moderately negative correlation was seen between oral health indicators and cognitive ability supporting the above mentioned associations.
In multivariate analysis, it was seen that cognitive ability attributed to nearly 17% variance in the indicators for SES and oral health.
In regression model, the association between all indicators of oral health with cognitive ability further attenuated after adjustment for the SES. Cognitive ability attributed for nearly 30% of variance in the indicators for oral health after adjusting for SES.
The association between oral health indicators, cognitive tests remained significant and in the same direction before and after adjustment for SES.
Similarly, in the regression model the association between all indicators of oral health with SES attenuated after further adjustment for cognitive tests. SES attributed for nearly 25% of variance in the indicators for oral health after adjusting for cognitive tests. This suggests that socio economic inequalities still existed in study population after taking cognitive ability tests into consideration.
Overall in the present study, it was seen that cognitive ability, oral health and SES are strongly associated in our study population and cognitive ability attributed for nearly 30% changes in indicators for oral health and SES attributed for nearly 25% variance in indicators for oral health.
Limitation
Because of the cross-sectional nature of the data used in the current study, the aforementioned theories about the underlying pathways explaining the effect of cognitive ability on socio-economic inequalities in oral health cannot be adequately tested.
The alternative possibility of reverse causality should be considered. This study also raises important public health issue in that cognitive function may provide a mediating pathway for accounting for social inequalities in oral health. Further research is required to establish whether these associations can be demonstrated prospectively and to investigate potential underlying pathways. There is also a need for longitudinal studies to test the theories about the underlying pathways explaining the effect of cognitive ability on socio-economic inequalities in oral health. Further studies in heterogeneous population, in different communities and younger age group are needed to support the present study findings. Based on the cognitive ability and oral health status of the students a module for health education can be prepared to modify the oral health related behaviour, as the changes made in the behavior during this age can last for life time.
Conclusion
The results of the present study showed that there was a significant association and positive correlation between the SES and three indicators for oral health. Significant association and negative correlation between cognitive ability and three indicators for oral health and cognitive ability attributed for nearly 30% changes in indicators for oral health after adjusting for SES and SES attributed for nearly 25% variance in indicators for oral health after adjusting for cognitive ability. The results of the present study demonstrate potential role for cognitive ability in the socio-economic inequalities in oral health in the students aged 17-19 years.
t-test was used to compare means of cognitive ability tests based on gender
p<0.01 statistically strongly significant
t-test was used to compare means of cognitive ability tests based on gender
p<0.01 statistically strongly significant; p< 0.05 moderately significant.
Spearman’s correlation coefficient test was used find correlation between socio economic status and cognitive ability. r value 0.3-0.5 indicates moderate correlation. p<0.01 statistically strongly significant, p< 0.05 moderately significant
Pearson’s correlation coefficient test was used find correlation between oral health indicators and cognitive ability, r-value 0.1-0.3 indicates small correlation, 0.3-0.5 indicates moderate correlation, p<0.01 statistically strongly significant, p< 0.05 moderately significant
Multivariate analysis was performed, R2 is the coefficient of determination which indicates the proportion of the variance dueoral health indicators and SES on cognitive ability, p<0.01 statistically strongly significant, p< 0.05 moderately significant . * moderately significant
** strongly significant
Multiple logistic regression was performed, R2 is the coefficient of determination which indicates the proportion of the variance due to SES on oral health indicators after adjusting for cognitive ability. p<0.01 statistically strongly significant, p<0.05 moderately significant
Multiple linear regression was performed, R2 is the coefficient of determination which indicates the proportion of the variance due to cognitive ability on oral health indicators after adjusting for SES, p<0.01 statistically strongly significant, p< 0.05 moderately significant