Spectrum of Changes in RBC Indices and Histograms in Blood from Subjects with Cold Antibodies
Chidambharam Choccalingam1, Aarthi Kannan2
1 Assistant Professor, Department of Pathology, Chettinad Medical College, Kelambakkam, Chennai, Tamil Nadu, India.
2 Assistant Professor, Department of Pathology, Chettinad Medical College, Kelambakkam, Chennai, Tamil Nadu, India.
NAME, ADDRESS, E-MAIL ID OF THE CORRESPONDING AUTHOR: Dr. Chidambharam Choccalingam, 25, 6th Main Road, Raja Annamalipuram, Chennai-600028, Tamil Nadu, India.
E-mail: chidambharam@gmail.com
Cold antibodies are mostly immunoglobulin M, which interact with red cell antigens at lower temperatures (<37°C). The analysis of samples from subjects with cold antibodies in automated haematology analysers may show abnormal Red Blood Corpuscles (RBC) indices and changes in histogram. High Mean Corpuscular Haemoglobin (MCH) and Mean Haemoglobin Concentration (MCHC) along with plateau effect beyond 110fl at Upper Discriminator (RU) end of RBC histogram are good indicators of presence of cold antibodies in plasma. Cold antibodies in plasma must be considered while reporting the peripheral smear in presence of plateau effect beyond 110fl at RU end of RBC histogram.
High MCH, High MCHC, Plateau effect
Case Report
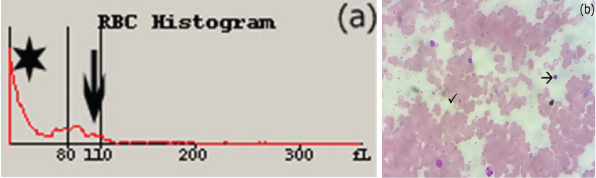
Case 1: A 35-year-old chronic alcoholic male patient, presented with fever and dyspnoea. Complete Blood Count (CBC) analysis showed anaemia with High Mean Corpuscular Volume (MCV), Mean Corpuscular Haemoglobin (MCH), Mean Corpuscular Haemoglobin concentration (MCHC), Red Cell Distribution width (RDW) along with nucleated RBCs [Table/Fig-1]. Peripheral Blood Smear (PBS) showed RBC agglutinates, nucleated RBCs and polychromatophils [Table/Fig-2]. Direct coomb’s test was positive with C3d antibody. RBC histogram showed a Lower Discriminator (RL) not starting at baseline, small peak at 110fl, along with broad Upper Discriminator (RU) tail or plateau [Table/Fig-2].
Haematological investigations of the four cases: Mean Corpuscular Volume (MVC), Mean Corpuscular Haemoglobin (MCH), Mean Corpuscular Haemoglobin concentration (MCHC), Red Cell Distribution width (RDW-CV).
| Parameter | Case1 | Case 2 | Case 3 | Case 4 |
|---|
| Haemoglobin (g %) | 4.2 | 7.2 | 3.2 | 12.7 |
| RBC(x 106/ìl) | 0.15 | 2.84 | 0.39 | 3.01 |
| Haematocrit (%) | 1.7 | 21.9 | 6.2 | 29.1 |
| MCV (fl) | 111.1 | 77.1 | - | 96.4 |
| MCH (pg) | ++++ | 25.3 | 80.3 | 42.0 |
| MCHC (g/dl) | ++++ | 32.8 | 51.3 | 43.5 |
| RDW-CV (%) | 44.5 | 34.2 | - | 14.2 |
| nRBC (%) | 4.6 | 0 | 0 | - |
| WBC count (x 103/ìl) | 36.5 | 6.0 | 7.5 | 5.5 |
| Platelet count (x 103/ìl) | 338 | 387 | 112 | 179 |
| Direct coomb’s test(IgG and C3d) | ++++ | +++ | ++++ | +++ |
| Direct coomb’s test (IgG) | - | - | - | - |
| Direct coomb’s test (C3d) | +++ | +++ | +++ | +++ |
a) RBC histogram with RL not starting from baseline (indicated by star), small peak at 100fl and RU plateau (indicated by arrow); b) Peripheral smear with RBC agglutinates (indicated by tick), polychromatophils and nucleated RBCs (indicated by arrow; Leishman stain; 4X).
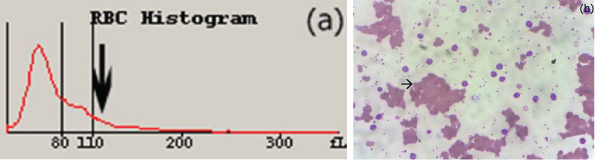
Case 2: A 40-year-old female presented with dyspnoea, following 10 days of cough and cold. CBC showed anaemia with low normal MCV and MCH along with raised RDW. Peripheral smear showed RBC agglutinates, few spherocytes and occasional nucleated RBCs [Table/Fig-3]. The patient had lung infiltrates suggestive of atypical pneumonia possibly by mycoplasma organism. In view of presence of spherocytes, occasional nucleated RBCs in peripheral smear and clinical suspicion of Mycoplasma pneumonia, Coomb’s test was requested to rule out Autoimmune Haemolytic Anaemia (AIHA). Coomb’s test was performed and was positive with C3d antibody. RBC histogram showed RL not starting from baseline and RU plateau around 100fl [Table/Fig-3].
a) RBC histogram with RU plateau around 110fl (indicated by arrow); b) Peripheral smear with RBC agglutinates (indicated by arrow) and nucleated RBCs Leishman stain; 4X.
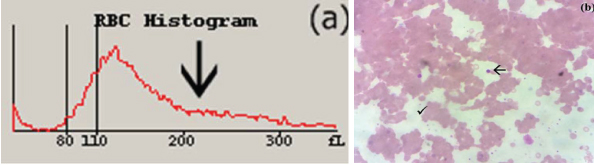
Case 3: A 50-old-year female hypothyroidism patient presented with complaints of acute breathlessness and pedal oedema. CBC showed anaemia with raised MCH and MCHC and no display for MCV and RDW. RBC histogram showed a peak beyond 110fl with broad RU tail or plateau. Peripheral smear showed RBC agglutinates, occasional nRBCs and positive coomb’s test [Table/Fig-4].
a) RBC histogram with peak beyond 110fl and broad RU tail (indicated by arrow); b) Blood smear with RBC agglutinates (indicated by tick) and nucleated RBCs(indicated by arrow; Leishman stain; 4X).
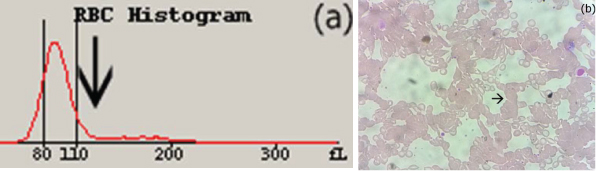
Case 4: A 42-year-old male presented with fever. CBC showed normal haemoglobin with raised MCH, MCHC and RDW values. Peripheral blood showed RBC agglutinates and Coomb’s test was positive. RBC histogram showed a peak beyond 110fl [Table/Fig-5].
a) RBC histogram with small RU plateau beyond 110fl (indicated by arrow); b) Peripheral blood smear with RBC agglutinates (indicated by arrow Leishman stain; 4X).
All samples were analysed on Beckman Coulter LH780 (Coulter, India) and immune-haematological tests were performed using gel cards for polymer having IgG and C3d (Bio-Rad, Switzerland) and manual tube method for mono-specific IgG and C3d.
Discussion
Immune-mediated haemolytic anaemia is the result of allo or auto-antibodies to a subject’s red cell antigens. AIHA, characterized by auto-antibodies against subject’s own red cell antigens may be “idiopathic” or secondary to lymphoproliferative disorders, post-viral infections or systemic autoimmune diseases [1]. The diagnosis of AIHA requires anaemia, haemolysis and positive Direct Anti-Globulin Test (DAT). The antibodies can be characterized by the temperature at which antibodies interact with the red cell antigen. Warm antibodies are mostly immunoglobulin G (IgG) and interact with red cell antigens readily at 37°C whereas Cold antibodies are mostly immunoglobulin M (IgM) and interact with red cell antigens at lower temperatures (30-32°C, stronger interaction at 2-4°C) [1,2]. Cold antibodies in plasma, without evidence of haemolysis are called as benign cold antibodies [2]. The analysis of samples from subjects with cold antibodies in automated haematology analysers, may show abnormal RBC indices and changes in histogram [3]. Among the four cases discussed above, three cases had haemoglobin (Hb) and haematocrit (Hct) mismatch and elevated MCHC and MCH and all the four cases had RBC histogram peak between 100-110fl with broad RU tail/ plateau.
In subjects with presence of both benign and pathologic cold antibodies in plasma, the automated analyser demonstrated a deviation in the normal haemoglobin and haemotcrit calculation and more importantly elevated MCHC and MCH [4,5]. Also the RBC histogram revealed a RU peak around or above 110fl and a plateau effect at RU.
The Coulter method of electrical impedance, counts and size the cells by detecting and measuring changes in electrical resistance when a hydro-dynamically focussed cell in a conductive liquid passes through a small aperture. The RBC count is measured directly by Coulter principle and the MCV is derived from the RBC histogram. The Hct is calculated by multiplying RBC count and MCV whereas the MCHC is derived by dividing Hb by Hct [3].
Cold agglutinins in the plasma, tend to clump RBCs together as large clumps or doublets/triplets at temperatures below 37°C and when the samples are analysed by automated analysers, the agglutinated RBCs are counted as single RBC giving rise to a spuriously low RBC count [3]. The agglutinated RBCs are also sized large by Coulter method, giving rise to very high MCV. The MCH and MCHC are elevated due to the spurious decrease in RBC count and the fact that RBC count is in the denominator for calculation of MCH and MCHC [6]. The agglutinated RBC in the RBC histogram occupies the RU end of the histogram giving a plateau effect beyond 110fl.
Though case-1 had the ideal expected findings of high MCH, MCHC and very high MCV along with plateau effect at 110fl, and no baseline start at RL end of RBC histogram, the above findings were not consistent in other cases. Though MCH, MCHC was high along with plateau effect beyond 110fl in case-3 and 4, the MCV was not calculated in case-3 and MCV was within normal range in case-4. The RBC in large clumps rather than doublets/triplets would have resulted in the automated analyser excluding the agglutinated RBC from counting and sizing by Coulter method as RBCs, hence giving rise to a normal MCV. However the largely agglutinated RBCs are reflected in the histogram as peak or plateau beyond 110fl. Case-4 being of benign cold antibodies (no anaemia or haemolysis), possibly would have had low titre of cold antibodies and hence less RBC agglutinates to increase the MCV, however the elevated MCH, MCHC and plateau effect beyond 110fl were present. Case-2 having evidence of haemolysis and RBC agglutinates in peripheral smear, presented with no specific findings in RBC indices expected due to cold antibodies. This possibly may be because RBC agglutinates might have disaggregated during analysis by Coulter principle either due to higher temperature (than the stable temperature at which the cold antibodies interact with RBC antigen) at analysis or the hydrodynamic focussing might have disaggregated the RBCs. However, there was small plateau effect beyond 110fl in the RBC histogram and no baseline start at RL end of RBC histogram.
Conclusion
High MCH, MCHC along with plateau effect beyond 110fl at RU end of RBC histogram are good indicators of presence of cold antibodies in plasma. The above findings along with anaemia and nucleated RBC are clues for presence of pathologic cold antibodies whereas absence of anaemia with the above findings suggests the presence of benign cold antibodies in plasma. In all cases with plateau effect beyond 110fl at RU end of RBC histogram, cold antibodies in plasma must be also be considered in addition to other causes while reporting the peripheral smear.
[1]. Lewis SM, Bain BJ, Bates I, Dacie and Lewis: PRACTICAL HAEMATOLOGY 2006 10 edPhiladelphiaBain BJ, Win N, editors [Google Scholar]
[2]. Cines DB, Bussel JB, McMillan RB, Zehnder JL, Congenital and acquired thrombocytopeniaASH Education Program Book 2004 2004(1):390-406. [Google Scholar]
[3]. Lokwani D, The ABC of CBC:Interpretation of complete blood count and histograms 2013 First edNew DelhiJaypee Brothers Medical Publishers Ltd [Google Scholar]
[4]. Sharma S, Pujani M, Pahuja S, Chandra J, Rath B, Labhchand Critical evaluation of peripheral smear in cases of anaemia with corpuscular hemoglobin concentration in children: A series of four casesIndian J. Pathol. Microbio 2010 53(4):820-23. [Google Scholar]
[5]. Ercan S, Caliskan M, Koptur E, 70-year old female patient with mismatch between hematocrit and hemoglobin values: the effects of cold agglutinin on complete blood countBiochemia Medica 2014 24(3):391-95. [Google Scholar]
[6]. Nikousefat Z, Javdani M, Hashemnia M, Haratyan A, Jalili A, Cold Agglutinin Disease; A Laboratory ChallengeIran Red Crescent Med J 2015 17(10) [Google Scholar]