Introduction
Sensitivity and specificity analysis is commonly used for the evaluation of screening or diagnostic studies. The most important aim of a screening or diagnostic study is, usually to determine how sensitive a screening or diagnostic test is in predicting an outcome when both the test and variable for clinical diagnosis are presented as dichotomous data. An important consideration to be made before conducting any screening or diagnostic studies is to plan and justify a sufficient sample size. This is to ensure that the results obtained from the subsequent analysis will provide the screening or diagnostic test with a desired minimum value for both its sensitivity and specificity, together with a sufficient level of power and a sufficiently-low level of type I error (i.e., its corresponding p-value).
There were studies conducted on sample size estimation for sensitivity and specificity analysis. A study by David et al., (1991) emphasized on the estimation of a minimum sample size required for a positive likelihood ratio with its respective confidence interval [1]. Meanwhile, another study by Nancy et al., (1996) emphasized on how to incorporate the value of the prevalence of a disease into the sample size calculation [2]. Besides that, a study by Claes et al., (2000) introduced an approach for estimating the minimum sample size required when the true state of disease is unknown [3]. Despite the provision of all these current guidelines developed by the scholars, it is still desirable for us to further improve the prospective estimation of a minimum sample size required for determining both the sensitivity and specificity especially for a screening and diagnostic tests.
Since the majority of researchers are not statisticians, it is likely that most researchers will require a guide to determine the minimum sample size for evaluating both the sensitivity and specificity of a screening or diagnostic test. In most instances, the minimum sample size required will depend on the objectives of the research study. For example, if an objective of the research study is to determine whether (or not) a specific tool or instrument can be used as a screening tool; then researchers will have to ensure that it has a sufficiently-high degree of sensitivity, but a lower degree of specificity can be tolerated [4,5]. On the other hand, if the researcher plans to develop a specific tool or instrument to be used as a diagnostic tool, then the researcher will usually have to target for a high degree of both sensitivity and specificity [6,7]. Due to the above, some research studies emphasize more on specificity than sensitivity [8]. Thus, different guides for estimation of a minimum sample size may be applicable for different objectives.
This review paper discusses on how to estimate sample size for sensitivity and specificity test. First of all, we presented the minimum sample sizes required for obtaining the desired sensitivity, specificity, power and type I error (i.e. p-value) for a range of low to high prevalence of the disease. Then, we provide convenient guide for researchers to follow when determining the minimum sample size required especially for two different types of studies, i.e., screening and diagnostic studies.
Sample Size Calculation Using Pass Software
The minimum sample size required for sensitivity and specificity test was calculated by using PASS software (PASS 11 citation: Hintze J (2011). PASS 11. NCSS, LLC. Kaysville, Utah, USA). PASS software is one of the commercial software that provides sample size tools for various statistical test and confidence interval scenarios [9]. We estimate the minimum sample size required, based on the different values of the prevalence of a disease and both sensitivity and specificity of a screening or diagnostic test (while in the meantime, the power is set to be at least 80% and the p-value, is set to be less than 0.05).
The values of the prevalence of a disease were set to be from 5%, and then subsequently increased to 10% and finally increased to 90% (i.e., with a stepwise increment of 10%). The values of both sensitivity and specificity to be adopted within the null hypothesis were set to range from 50% to 90% (i.e., with a stepwise increment of 10%) while those to be adopted within the alternative hypothesis were set to range from 60% to 95% {i.e., with a stepwise increment of 10%, except for the last category which consists of a stepwise increment of 5% (i.e., from 90% to 95%)}. The two different guides to be derived from this research study are namely:
(i) A guide to estimate the minimum sample size required for a screening study and,
(ii) A guide to estimate the minimum sample size required for a diagnostic study.
The overall rationale of determining the minimum sample size required for a screening study is to detect as many as true-positives as possible, hence it shall necessitate a sufficiently-high degree of sensitivity but it may not require a similarly high degree of specificity. On the other hand, since the overall rationale of determining the minimum sample size required for a diagnostic study is to detect as many true-positives and also true-negatives at the same time, hence, it shall necessitate a sufficiently-high degree of both sensitivity and specificity.
Review of the Results
It is already well-understood that the minimum sample size required will be affected by the pre-specified values of the power of a screening or diagnostic test, its corresponding type I error and the effect size. The value of the effect size to be adopted within this research study is determined by the values of the prevalence of a disease and also the values of both sensitivity or specificity of the screening or diagnostic test {for both null (Ho) and alternative (Ha) hypotheses}.
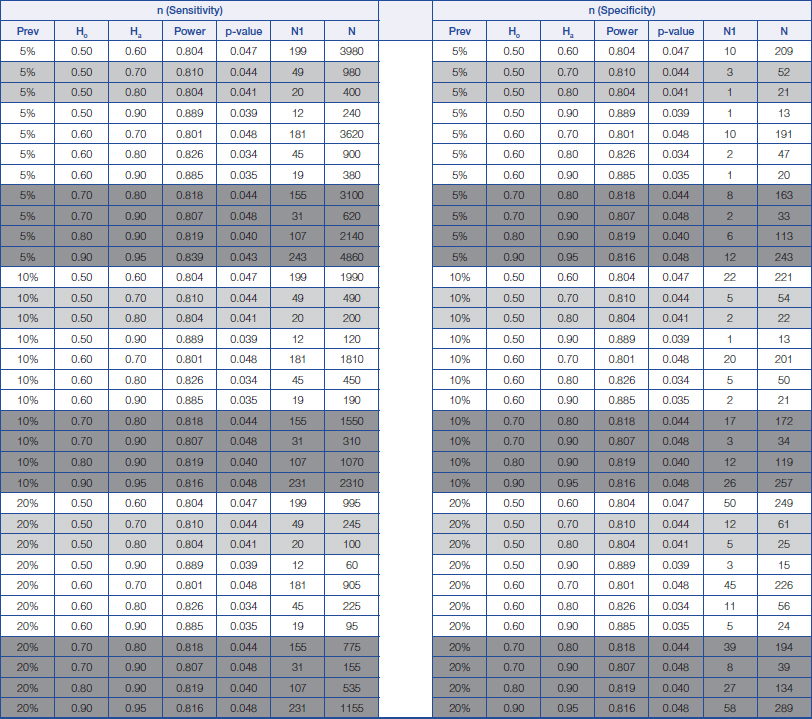
By fixing the values of the power of a screening or diagnostic study and also the type I error, the minimum sample size required for determining both the sensitivity and specificity of a screening or diagnostic test will increase when there is a smaller clinically-important difference (in both sensitivity and specificity of a diagnostic test) between those proposed in null hypothesis and those proposed in alternative hypothesis, as illustrated by [Table/Fig-1,2 and 3]. A larger sample is also required for obtaining a higher sensitivity with a lower prevalence and vice versa (higher specificity with a higher prevalence).
Sample size calculation for sensitivity and specificity analysis for prevalence of disease from 5% to 20%. Prev = prevalence of disease Ho = Hypothesis null Ha = Hypothesis alternative
N1 = The minimum number of sample size for positive disease N = The minimum number of sample size requirement for total
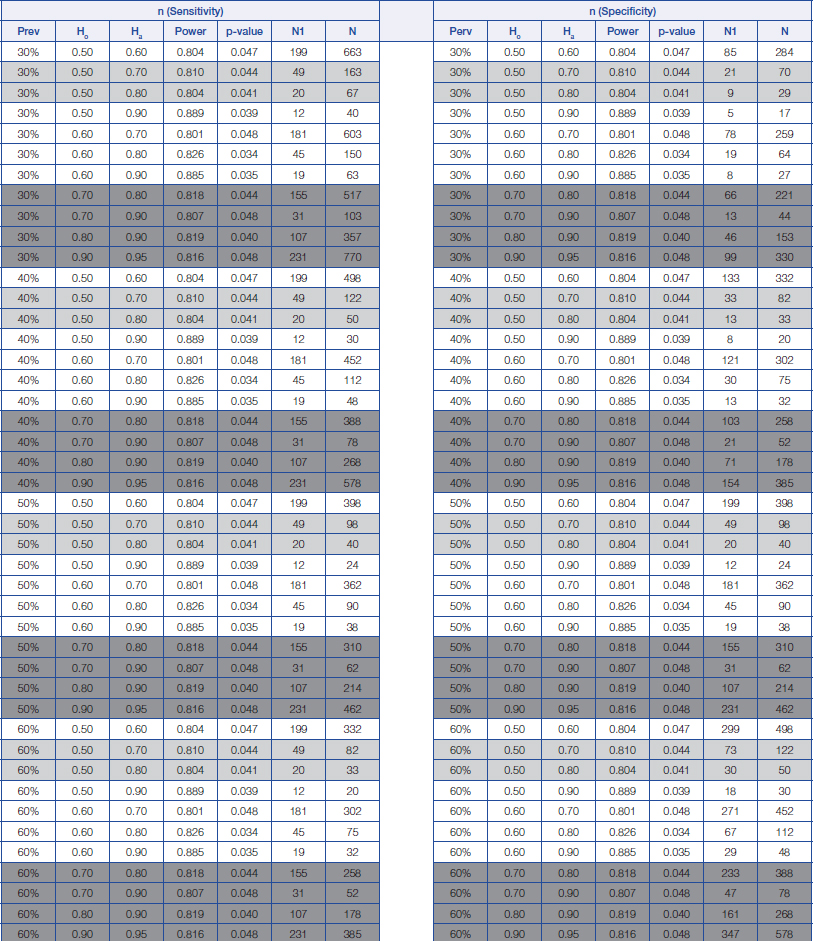
Sample size calculation for sensitivity and specificity analysis for prevalence of disease from 30% to 60%.
Prev = prevalence of disease Ho = Hypothesis null Ha = Hypothesis alternative
N1 = The minimum number of sample size for positive disease N = The minimum number of sample size requirement for total
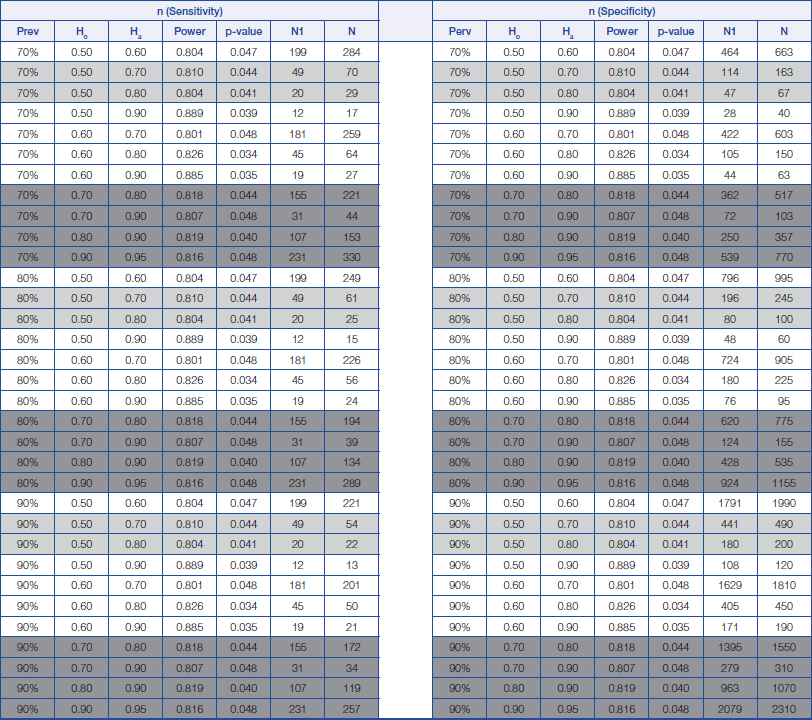
Sample size calculation for sensitivity and specificity analysis for prevalence of disease from 70% to 90%.
Prev = prevalence of disease Ho = Hypothesis null Ha = Hypothesis alternative N1 = The minimum number of sample size for positive disease N = The minimum number of sample size requirement for total
The proposed estimation of the minimum sample size required for a screening study will range from 22 (Prevalence=90%, Ho=0.5 and Ha=0.8) to 980 (Prevalence=5%, Ho=0.5 and Ha=0.7), while the proposed estimation of the minimum sample size for a diagnostic study will range from 34 (Prevalence=90%, Ho=0.7 and Ha=0.9) to 4860 (Prevalence=5%, Ho=0.9 and Ha=0.95); depending on the prevalence of a disease and also on the change in the percentage values of both the sensitivity and specificity of a diagnostic test between those stated within the null hypothesis and those stated within the alternative hypothesis.
From the above, a rough guide has been prepared for estimating the minimum sample size required for both screening and diagnostic studies, which are provided in [Table/Fig-1,2 and 3]. The light grey areas are meant for proposing a minimum sample size required for a screening study, while those dark grey areas are meant for proposing a minimum sample size required for a diagnostic study (Refer to [Table/Fig-1,2 and 3]).
Discussion
The concept of null hypothesis is to estimate the values of sensitivity and specificity before the study is conducted. The estimate can be referred from either literatures, pilot study and sometimes by rough guidelines or target. Using some rough guidelines or target is necessary especially when there are no benchmark studies to be referred with and when pilot study could not be done for some reasons. For instance, the values of sensitivity in the null hypothesis for screening studies could be set at 50% as for rough guideline with the aim that the values should increase to indicate that the screening tool is sensitive in predicting the disease. Therefore, the role of alternative hypothesis is to estimate the values of sensitivity and specificity after the study is conducted. Basically, it is a targeted value that researchers are expecting from the performance of the screening or diagnostic tools.
The results showed that either a lower value of both sensitivity and specificity of a screening or diagnostic test to be adopted within the null hypothesis, or a smaller difference (in the values of both sensitivity or specificity of a screening or diagnostic test) between those adopted within the null hypothesis and those adopted within the alternative hypothesis, will increase the minimum sample size required. It is a similar concept in sample size calculation where larger sample is required to detect a lower effect size [10].
From the above, it is clear that the minimum sample size required will depend on the pre-specified values of the power of the screening or diagnostic test, its corresponding level of type I error (i.e., its p-value) and the effect size. In this research study, we postulate that the values to be pre-specified for estimating a minimum sample size will depend on the research objectives of the study. Both screening and diagnostic studies are commonly evaluated by their sensitivity and specificity. We proposed that the basis for estimation of a screening study is that its sensitivity must be pre-determined to be at least 50.0% within the null hypothesis to indicate that the probability or chance for an instrument to detect a true-positive is in balance with at least 50.0%.
On the other hand, the minimum value of sensitivity to be adopted within the alternative hypothesis will be expected to be higher, of at least 70.0%, to indicate that the screening or diagnostic tool is fairly sensitive [11–13]. Meanwhile, the basis for estimation of a diagnostic study is that both its sensitivity and specificity will have to be pre-determined to be at least 70.0% within the null hypothesis to indicate that the probability or chance for an instrument to detect a true-positive or a true-negative is at least 70%. On the other hand, the values of both sensitivity and specificity to be adopted within the alternative hypothesis is expected to be at least 80.0% [14–16], in order to indicate that the instrument is fairly good as a diagnostic tool. However, these estimates could be arbitrary. These pre-determined values of both sensitivity and specificity of a screening or diagnostic test were adopted to ensure a valid estimation of the minimum sample size required.
It is always possible for the researchers to select different target estimates for the evaluation of both sensitivity and specificity of a screening or diagnostic study, such as aiming for higher or lower values of both their sensitivity and specificity. So, we now have illustrated two scenarios for the estimation of a minimum sample size required, along with their guiding statements for these estimations, which are based on the tabulated results.
Determination of a Minimum Sample Size Required for a Screening Study
Consider a study which aims to determine how sensitive a newly-developed instrument is in screening for Obstructive Sleep Apnea (OSA) in those patients who attended a respiratory clinic. The prevalence of OSA patients from a respiratory clinic is estimated to be approximately 80% [5]. Currently, these OSA patients will require their diagnosis to be confirmed by using Polysomnography (PSG) and such a diagnosis is costly and time-consuming. The researcher will expect that the newly-developed instrument to be as sensitive as a screening tool in screening OSA patients, even though it may not be as accurate as a diagnostic tool. The sample size statement is as follow; “This study aims to determine to what extent a specific newly-developed instrument is as sensitive as a screening tool to screen patients for OSA.”
By making reference to [Table/Fig-3], we can see that when prevalence of the disease is estimated to be 80% [5], a minimum sample size of 61 subjects (including 49 subjects having the disease) will be required to achieve a minimum power of 80% (actual power=81.0%) for detecting a change in the percentage value of sensitivity of a screening test from 0.50 to 0.70, based on a target significance level of 0.05 (actual p=0.044).”
It is important to bear in mind that the minimum sample size required for screening studies will depend on whether sensitivity or specificity of a screening test is being measured. A bigger minimum sample size will be required for measuring sensitivity of a screening test when the prevalence of a disease is lower, while a bigger minimum sample size will be required for measuring specificity of a screening test when the prevalence are higher. This is because sensitivity of a screening test aims to detect as many true-positives as possible, while specificity of a screening test aims to detect as many true-negatives as possible.
Determination of a Minimum Sample Size Required for a Diagnostic Study
Determination of a minimum sample size required for a diagnostic study will usually aim for a high value of both its sensitivity and specificity. Consider a study which aims to determine how sensitive a newly-developed instrument is in diagnosing those pre-mature babies with Retinopathy Of Prematurity (ROP). In this case, both the sensitivity and specificity of a diagnostic test are expected to be high. The prevalence of ROP among pre-mature babies is estimated to be approximately 20% [7].
So, the researcher will expect that the instrument to be both a sensitive and a specific tool to diagnose pre-mature babies with ROP. The sample size statement will be as follows; “This study aims to determine how sensitive this newly-developed instrument is in diagnosing pre-mature babies with ROP.” By making reference to [Table/Fig-1], we can see that when the prevalence of the disease is estimated to be 20% [7], a minimum sample size of 535 subjects (including 107 subjects having the disease) will be required to achieved a minimum power of 80% (actual power=81.9%) in order to detect a change in the percentage value of sensitivity from 0.80 to 0.90, based on a target significance level of 0.05 (actual p=0.040). This minimum sample size is also sufficient to detect a change in the value of specificity from 80.0% to 90.0% which will only require a minimum sample of 134 subjects (including 27 subjects having the disease).
Other Considerations
Tables of minimum sample sizes required which are produced by this research study will only include discrete values of pre-specified parameters; such as a value of 5% or 20% for the prevalence of a disease and a value of 50% or 70% for the sensitivity of a test. However, estimates obtained from literature may report a more precise value of pre-specified parameters; such as given the prevalence until one or two decimal point. Thus, researchers are advised to adopt the discrete values which are nearest to these estimates obtained from literature, as illustrated and described within the two scenarios previously. This can usually be acceptable because sample size planning will only provide an estimate because it is sometime difficult to know the exact prevalence of a disease in the population and also the true performance of a specific screening or diagnostic tool until the research study has been completed.
Hence, if the researcher intends to know the minimum sample size required for obtaining an estimate of both sensitivity and specificity of a diagnostic or screening test, based on pre-specified values that beyond the estimates that we provided, then researcher may have to calculate it manually or by using a statistical software. The tables developed by this research study will therefore serve only as a rough guide in order to assist researchers in planning their sample size calculation for a screening or diagnostic study that requires the evaluation of both its sensitivity and specificity.
The prevalence of a disease is one of the pre-specified parameters which will affect the determination of a minimum sample size required for a screening or diagnostic study. As showed in the results, a larger sample will be required to detect a higher degree of sensitivity for a disease with a lower prevalence and vice versa (while a larger sample is also required to detect a higher degree of specificity for a disease with a higher prevalence). The prevalence of a disease varies from one population to another. For example, prevalence of OSA can be very low in a general patient population but it will be higher in a population with a higher risk of OSA, such as those patients attending a respiratory clinic. However, both screening and diagnostic studies will usually be conducted within the population with a higher risk of disease, because these tools (for either screening or diagnosing) are usually meant to be used in a specific patient population having the disease rather in a general patient population [4–7].
All results for the determination of minimum sample size required which were presented in this study have adopted a minimum value of 5% prevalence of a disease, which is sufficient for conducting both screening or diagnostic studies in a specific patient population having the disease. The estimated minimum sample size required will range from between 22 until 4860 depending on the pre-specified values of the power of both screening and diagnostic test, their corresponding type I error (i.e., their p-value), and the effect size. Researchers are advised not to obtain a very small sample size, such as 22 subjects (Prevalence=90%, Ho=0.5 and Ha=0.8) although its sample size calculation is still valid. At the same time, researchers may often be quite reluctant to recruit a large sample of patients because this will be costly and time-consuming.
Determination of a minimum sample size will provide only an estimate to ensure that the statistically-significant results can be obtained based on the desired effect size and a sufficient power of the screening or diagnostic test. Usually it is difficult to know the true values of these pre-specified parameters until the entire research has been completed and all analyses have been completed. Occasionally, it is possible that the true estimates for these pre-specified parameters; such as the effect size, the prevalence of a disease, the values of sensitivity and specificity of both the screening and diagnostic tests, are not yet known.
The rule-of-thumb is to obtain a large sample, which is reasonable since it will always increase the accuracy of the estimation process. Some studies had suggested that by obtaining a sample of more than 300 subjects, the estimated statistics that are derived from the sample will be likely to be the same as the true values within the intended population [17,18]. These findings were derived from an audit from several populations and tested with various statistical analyses (univariate and multivariate) and eight sub-samples were obtained for each statistical analysis. Therefore, it is possible to derive a rule-of-thumb in obtaining a sample of minimum 300 subjects, if researchers have difficulty in estimating a reliable estimate for the effect size. Based on the results that we have presented, a sample of minimum 300 subjects is often sufficiently large to evaluate both sensitivity and specificity of most screening or diagnostic tests.
Conclusion
Determination of a minimum sample size required for the evaluation of both sensitivity and specificity of a screening or diagnostic test will have to be based on various pre-specified parameters. Hence, a table which tabulates the estimated minimum sample sizes required for determining both sensitivity and specificity of a screening or diagnostic test (based on a set of pre-specified parameters such as prevalence of disease, etc.,) will be very helpful in providing researchers a rough guide for obtaining a minimum sample size required for their studies to be conducted on both screening and diagnostic tests.
[1]. David L Simel, Gregory P Samsa, David B Matchar, Likelihood ratios with confidence: sample size estimation for diagnostic test studiesJ Clin Epidmiol 1991 44(8):763-70. [Google Scholar]
[2]. Buderer NM, Statistical Methodology: I. Incorporating the prevalence of disease into the sample size calculation for sensitivity and specificityAcad Emerg Med 1996 3(9):895-900. [Google Scholar]
[3]. Enøe C, Georgiadis MP, Johnson WO, Estimation of sensitivity and specificity of diagnostic tests and disease prevalence when the true disease state is unknownPrev Vet Med 2000 45(1-2):61-81. [Google Scholar]
[4]. Netzer NC, Stoohs SA, Netzer CM, Clark K, Strohl KP, Using the Berlin questionnaire to identify patients at risk for the sleep apnea syndromeAnn Intern Med 1999 131:485-91. [Google Scholar]
[5]. Yunus A, Seet W, Mohamad Adam B, Haniff J, Validation of the Malay version of Berlin questionaire to identify Malaysian patients for obstructive sleep apneaMalaysian Family Physician 2013 8(1):03-09. [Google Scholar]
[6]. Burgess LJ, Maritz FJ, Le Roux I, Taljaard JJ, Use of adenosine deaminase as a diagnostic tool for tuberculous pleurisyThorax 1995 50(6):672-674. [Google Scholar]
[7]. Premsenthil M, Salowi MA, Bujang MA, Kueh A, Siew CM, Sumugam K, Risk factors and prediction models for retinopathy of prematurityMalays J Med Sci 2015 22(5):57-63. [Google Scholar]
[8]. Baeres M, Herkel J, Czaja AJ, Wies I, Kanzler S, Cancado ELR, Liver disease: Establishment of standardised SLA/LP immunoassays: specificity for autoimmune hepatitis, worldwide occurrence, and clinical characteristicsGut 2002 51(2):259-64. [Google Scholar]
[9]. http://www.ncss.com/software/pass/procedures/ [Last accessed on 03 June 2016] [Google Scholar]
[10]. Mohamad AB, Nurakmal B, Sample size guideline for correlation analysisWorld Journal of Social Science Research 2016 3(1):37-46. [Google Scholar]
[11]. Law M, Yang S, Wang H, Babb JS, Johnson G, Cha S, Glioma Grading: Sensitivity, Specificity, and Predictive Values of Perfusion MR Imaging and Proton MR Spectroscopic Imaging Compared with Conventional MR ImagingAJNR Am J Neuroradiol 2003 24(10):1989-98. [Google Scholar]
[12]. Choplin NT, Lundy DC, The sensitivity and specificity of scanning laser polarimetry in the detection of glaucoma in a clinical settingOphthalmology 2001 108(5):899-904. [Google Scholar]
[13]. Arroll B, Khin N, Kerse N, Screening for depression in primary care with two verbally asked questions: cross sectional studyBMJ: British Medical Journal 2003 327(7424):1144-46. [Google Scholar]
[14]. Shea JA, Berlin JA, Escarce JJ, Clarke JR, Kinosian BP, Cabana MD, Revised estimates of diagnostic test sensitivity and specificity in suspected biliary tract diseaseArch Intern Med 1994 154(22):2573-81. [Google Scholar]
[15]. Erbel R, Daniel W, Visser C, Engberding R, Roelandt J, Rennollet H, Echocardiography in diagnosis of aortic dissectionThe Lancet 1989 333(8636):457-61. [Google Scholar]
[16]. Nori S, Rius-Díaz F, Cuevas J, Goldgeier M, Jaen P, Torres A, Sensitivity and specificity of reflectance-mode confocal microscopy for in vivo diagnosis of basal cell carcinoma: A multicenter studyJournal of the American Academy of Dermatology 2004 51(6):923-30. [Google Scholar]
[17]. Bujang MA, Ghani PA, Zolkepali NA, Selvarajah S, Haniff J, A comparison between convenience sampling versus systematic sampling in getting the true parameter in a population: explore from a clinical database: The Audit Diabetes Control Management (ADCM) registry in 2009Proceedings of the International Conference Statistics Sciences Business Engineering 2009 2012:15 [Google Scholar]
[18]. Bujang MA, Sa’at N, Joys AR, Mohamad Ali M, An audit of the statistics and the comparison with the parameter in the populationAIP Conference Proceedings 2015 1682:050019 [Google Scholar]