It’s no more an unknown fact that the risk of gallstone disease is associated with obesity as the increased HMG-CoA reductase activity causes increased biliary secretion of cholesterol [1,2]. Across the world, studies are in abundance which have shown high incidence of cholelithiasis in obese patients. But only few attempts have ever been made to see how the increase in BMI is related to the cholelithiasis [3]. Moreover, during our clinical practice, we found that incidence of cholelithiasis is very high in Sikkim, as cholecystectomies constitute almost three fourth of all surgical procedures performed in the surgery department of the only teaching institute of this state of North East India. We decided to perform a retrospective analysis of the patient data to find out if it is only the overweight or obese Sikkimese who have the cholelithiasis or even the people with normal BMI too have a high incidence.
Materials and Methods
The study was carried out in Sikkim Manipal Institute of Medical Sciences, the only teaching hospital in Gangtok, in North-East India. A prospective observational pilot study was conducted to find out the BMI of the patients undergoing cholecystectomy. We found that most of the patients undergoing cholecystectomy had their BMI in normal range. This prompted us to plan a study where we reviewed the records of all the in-patients who were admitted with complaints of upper abdomen pain over last 10 years from January 2006 to December 2015. All the patients with complaints of upper abdominal pain were included in the study. Major exclusion was because of inadequate data entry in the patient records. Patients with asymptomatic or incidental cholelithiasis and those with any other chronic co-morbidity were also excluded. The patients were then segregated into two groups, one with a diagnosis of gallstone disease (cholelithiasis group) and the other with alternate diagnosis designated as control (non-cholelithiasis group). The data was tabulated and analysed using IBM©SPSS© 20. Categorical data was compared using Pearson’s χ2 test. Continuous data was compared using analysis of variances (for comparison of mean) and Mann Whitney test (for comparison of median), however the latter is mentioned only where there was a difference in the p-values by using these two methods. Regression analysis was done to estimate the relationship between variables and the outcome (cholelithiasis).
Fraction score (fC and Fnc) and difference of fraction scores (Δf) was calculated as below:
If the number of cholelithiasis patients in BMI groups G1, G2…and Gnare C1, C2… and Cn and those without cholelithiasis are NC1, NC2…. and NCn. Then, the total number of patients in cholelithiasis group will be TC= C1+C2…. +Cn and in non-cholelithiasis group will be TNC= NC1+NC2…. +NCn.
The Fraction score for cholelithiasis group was calculated as fC=C/TC (fC1, fC2…. and fCn for BMI groups G1, G2…. and Gn) and for non-cholelithiasis group as fNC=NC/TNC (fNC1, fNC2…. and fNCn for BMI groups G1, G2…. and Gn).
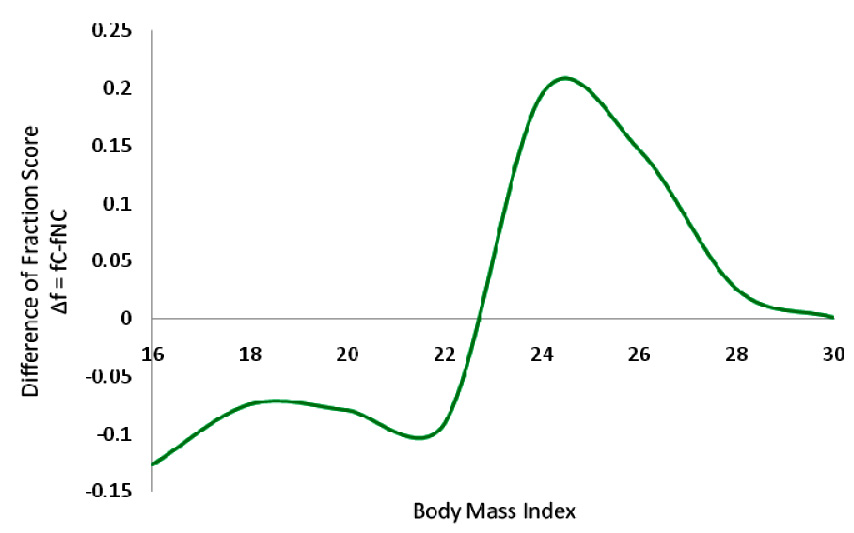
And the difference of the two fractions was calculated as Δf=fC-fNC (Δf1, Δf2…. and Δfn for BMI groups G1, G2 …. and Gn).
The two values viz. fraction score (fC and fNC) and difference of fraction scores (Δf) were then plotted against BMI. These plots were created using Microsoft© Excel© 2013.
Results
Records of over 11,000 patients over last 10 years were reviewed who presented and admitted with complaints of pain abdomen. Out of these 7,182 patients were found to be eligible for inclusion into the study. Patients with a diagnosis of cholelithiasis on abdominal ultrasound scan were segregated as cases (2,872 patients) and remaining (4,310) were regarded as controls [Table/Fig-1].
Distribution of patients according to their ethnicity and gender across study groups.
| EthnicGroup | All Patients | Cholelithiasis Group | Non-cholelithiasis Group |
|---|
| N | Male | Female | N | Male | Female | N | Male | Female |
|---|
| Nepali | 2472 | 1048 | 1424 | 1252 | 446 | 806 | 1220 | 602 | 618 |
| Lepcha | 2278 | 1069 | 1209 | 1082 | 383 | 699 | 1196 | 686 | 510 |
| Bhutia | 2077 | 1045 | 1032 | 462 | 166 | 296 | 1615 | 879 | 736 |
| Others | 355 | 149 | 206 | 76 | 19 | 57 | 279 | 130 | 149 |
| Total | 7182 | 3311 | 3871 | 2872 | 1014 | 1858 | 4310 | 2297 | 2013 |
Female patients outnumbered male patients in cholelithiasis group (male to female ratio 1/1.8), while the opposite was the case in non-cholelithiasis group (male to female ratio 1.14/1). However, overall male to female ratio was in favour of female patients (male to female ratio 1/1.16). The mean age of total population was 35.89years with a maximum number of patients in 31-40years of age group. Patients in non-cholelithiasis group (mean age 35.1years) were almost 2 years younger than the patients in cholelithiasis group (mean age 37.09years). In the cholelithiasis group, female patients had gallstone disease at a little younger age (36.6years) compared to male patients (37.97years). Nepali patients were around 18 to 24-month-older (37.03years) than the rest of their counterparts (between 35 and 35.5years).
The mean BMI of all the patients reviewed in the study was 23.55 kg/m2. Age specific comparison revealed consistently higher mean BMI in case of cholelithiasis patients compared to mean BMI of total population as well as non-cholelithiasis patients [Table/Fig-2,3]. But even more important observation was that the mean BMI of the cholelithiasis patients across all age group was almost within the normal limit.
Body mass index of the patients across all age groups.
| AgeGroup | All Patients | Cholelithiasis Group | Non-cholelithiasis Group |
|---|
| N | M | SD | N | M | SD | N | M | SD |
|---|
| ≤10 | 429 | 18.17 | 2.12 | 3 | 26.94 | 0.57 | 426 | 18.11 | 2.00 |
| 11-20 | 503 | 21.04 | 3.96 | 131 | 25.04 | 2.43 | 372 | 19.64 | 3.40 |
| 21-30 | 1736 | 24.20 | 1.76 | 818 | 24.81 | 1.27 | 918 | 23.66 | 1.95 |
| 31-40 | 2014 | 24.40 | 1.70 | 896 | 25.03 | 1.55 | 1118 | 23.90 | 1.65 |
| 41-50 | 1429 | 23.52 | 2.18 | 602 | 24.78 | 1.68 | 827 | 22.60 | 2.04 |
| 51-60 | 784 | 24.27 | 1.63 | 347 | 24.99 | 1.47 | 437 | 23.69 | 1.51 |
| 61-70 | 183 | 24.56 | 1.67 | 61 | 25.66 | 1.32 | 122 | 24.00 | 1.55 |
| 71-80 | 56 | 23.56 | 2.07 | 6 | 25.84 | 1.15 | 50 | 23.29 | 1.99 |
| 81-90 | 33 | 23.25 | 1.74 | 7 | 24.33 | 1.80 | 26 | 22.96 | 1.64 |
| ≥91 | 15 | 22.91 | 2.65 | 1 | 27.43 | -- | 14 | 22.59 | 2.43 |
| Total | 7182 | 23.55 | 2.62 | 2872 | 24.93 | 1.55 | 4310 | 22.62 | 2.77 |
Box plot summarizing the central tendency and dispersion of BMI data in study population.
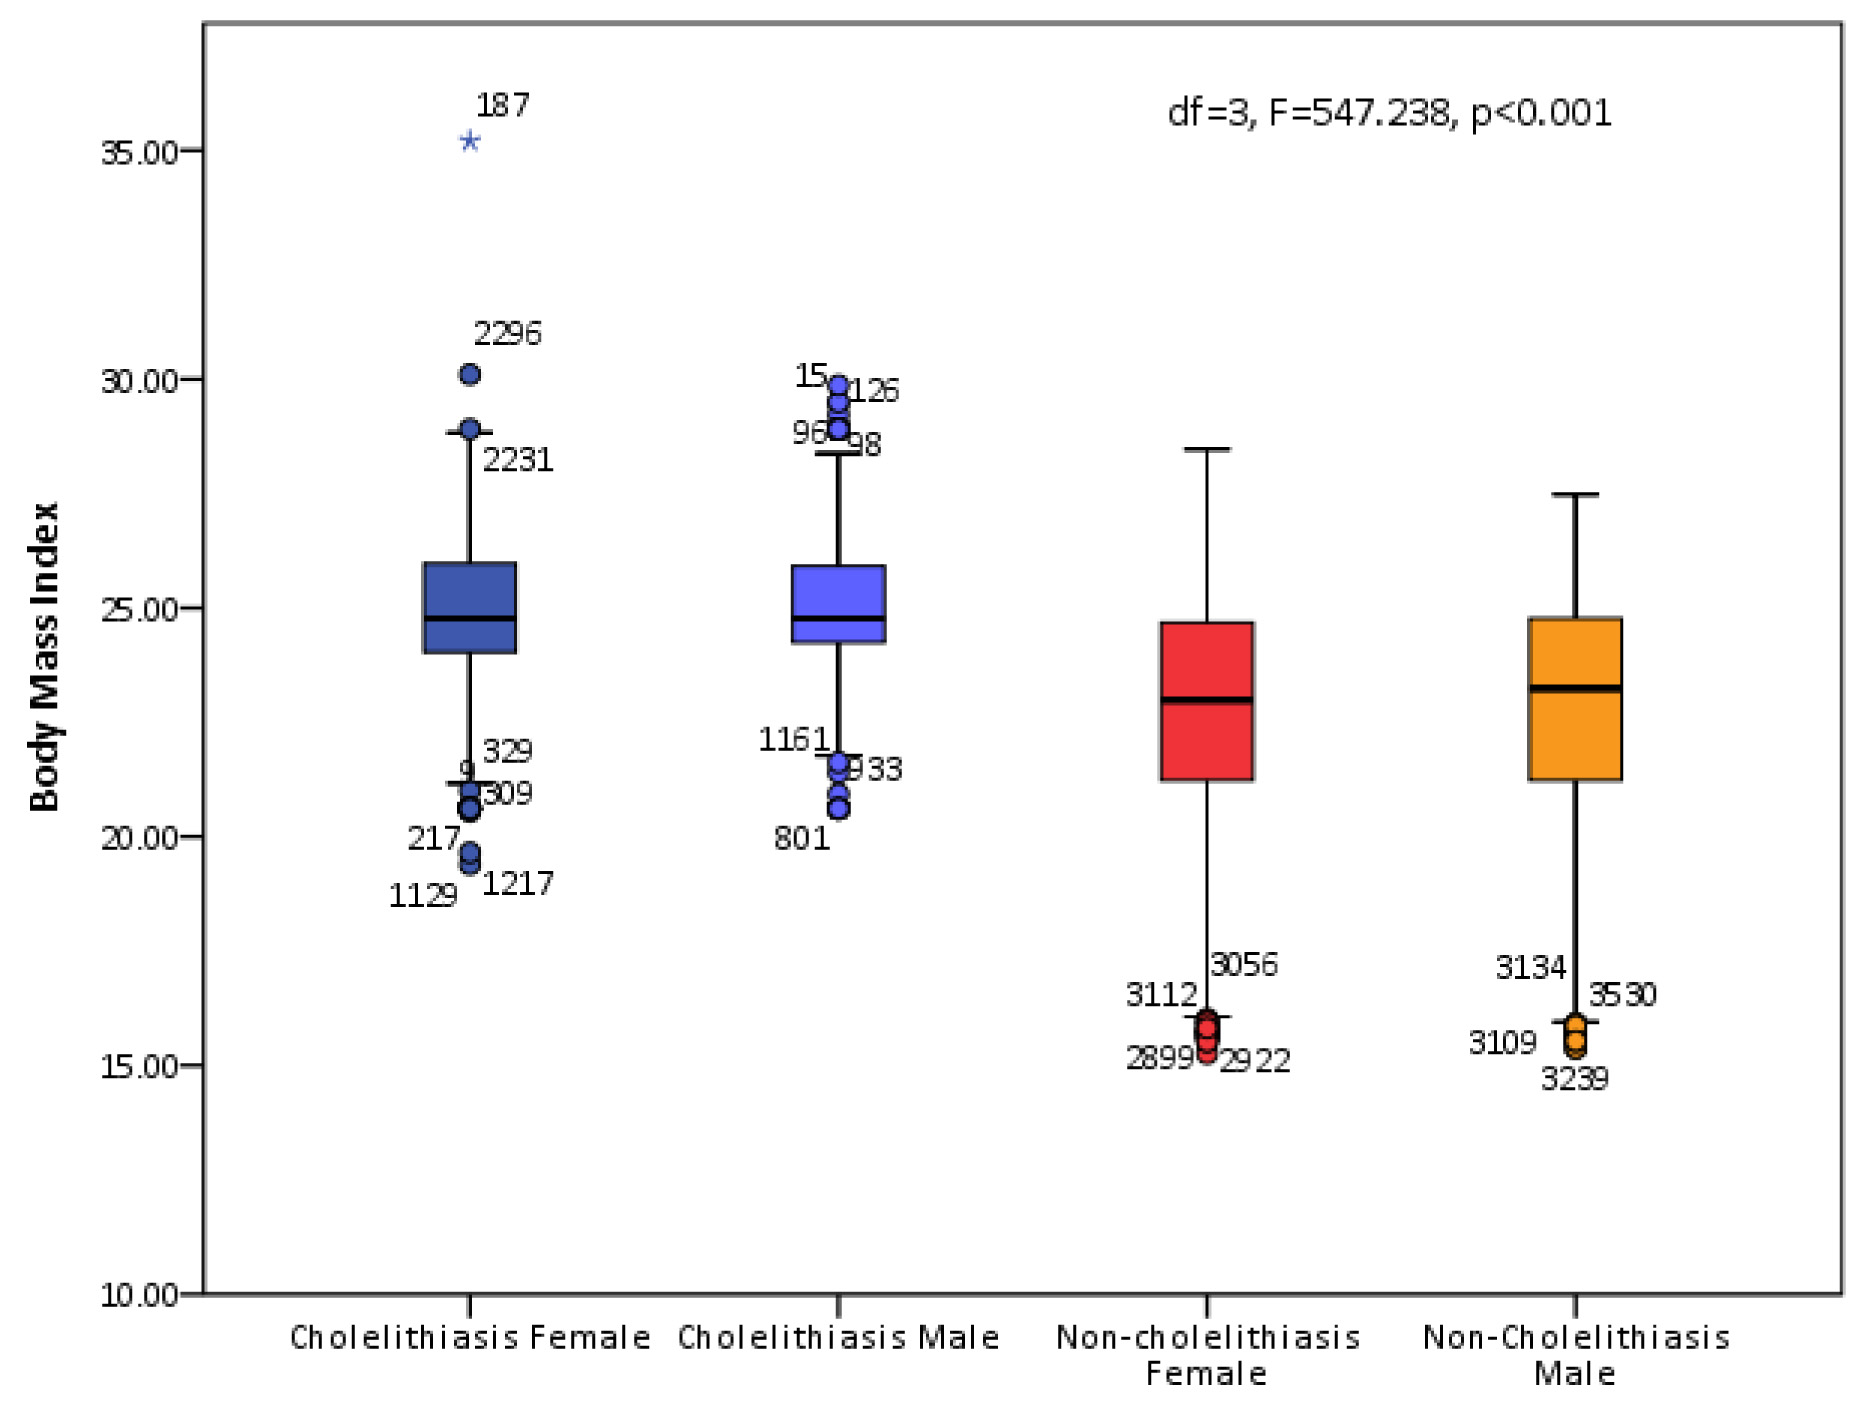
Patients in the cholelithiasis group had a higher BMI (24.93) than the patients in the non-cholelithiasis group 22.62 (df=1, F=1635.395, p<0.001). Gender specific comparison showed significant difference among the BMI of the patients as has been shown in five point summary (box) plot in [Table/Fig-3] (df=3, F=547.238, p<0.001). Within the cholelithiasis group, we found 4th decade as the most vulnerable for having symptomatic cholelithiasis, followed by 3rd and 5th decade. Male cholelithiasis patients had slightly higher BMI (25.06) than that of female patients (24.86) but the difference was significant (df=1, F=11.143, p=0.001). A staggering 77.4% of cholelithiasis patients had their BMI below 26 and BMI of more than 55% patients was in the range of 24-26 kg/m2 [Table/Fig-4].
Distribution and comparison of patients according to their BMI.
| BMIGroup | All Patients | Cholelithiasis group | Non-cholelithiasis Group |
|---|
| N | M | SD | N | M | SD | N | M | SD |
|---|
| ≤18 | 393 | 16.65 | 0.67 | -- | -- | -- | 393 | 16.65 | 0.67 |
| >18-20 | 426 | 19.15 | 0.70 | 2 | 19.52 | 0.17 | 424 | 19.15 | 0.71 |
| >20-22 | 637 | 21.05 | 0.61 | 106 | 21.48 | 0.59 | 531 | 20.96 | 0.58 |
| >22-24 | 1681 | 23.00 | 0.48 | 513 | 23.17 | 0.34 | 1168 | 22.93 | 0.52 |
| >24-26 | 3161 | 24.86 | 0.61 | 1601 | 24.87 | 0.59 | 1560 | 24.85 | 0.63 |
| >26-28 | 808 | 26.68 | 0.56 | 575 | 26.82 | 0.56 | 233 | 26.35 | 0.41 |
| >28-30 | 74 | 28.67 | 0.32 | 73 | 28.68 | 0.32 | 1 | 28.47 | -- |
| >30 | 2 | 32.65 | 3.60 | 2 | 32.65 | 3.60 | 0 | -- | -- |
| Total | 7182 | 23.55 | 2.62 | 2872 | 24.93 | 1.55 | 4310 | 22.62 | 2.77 |
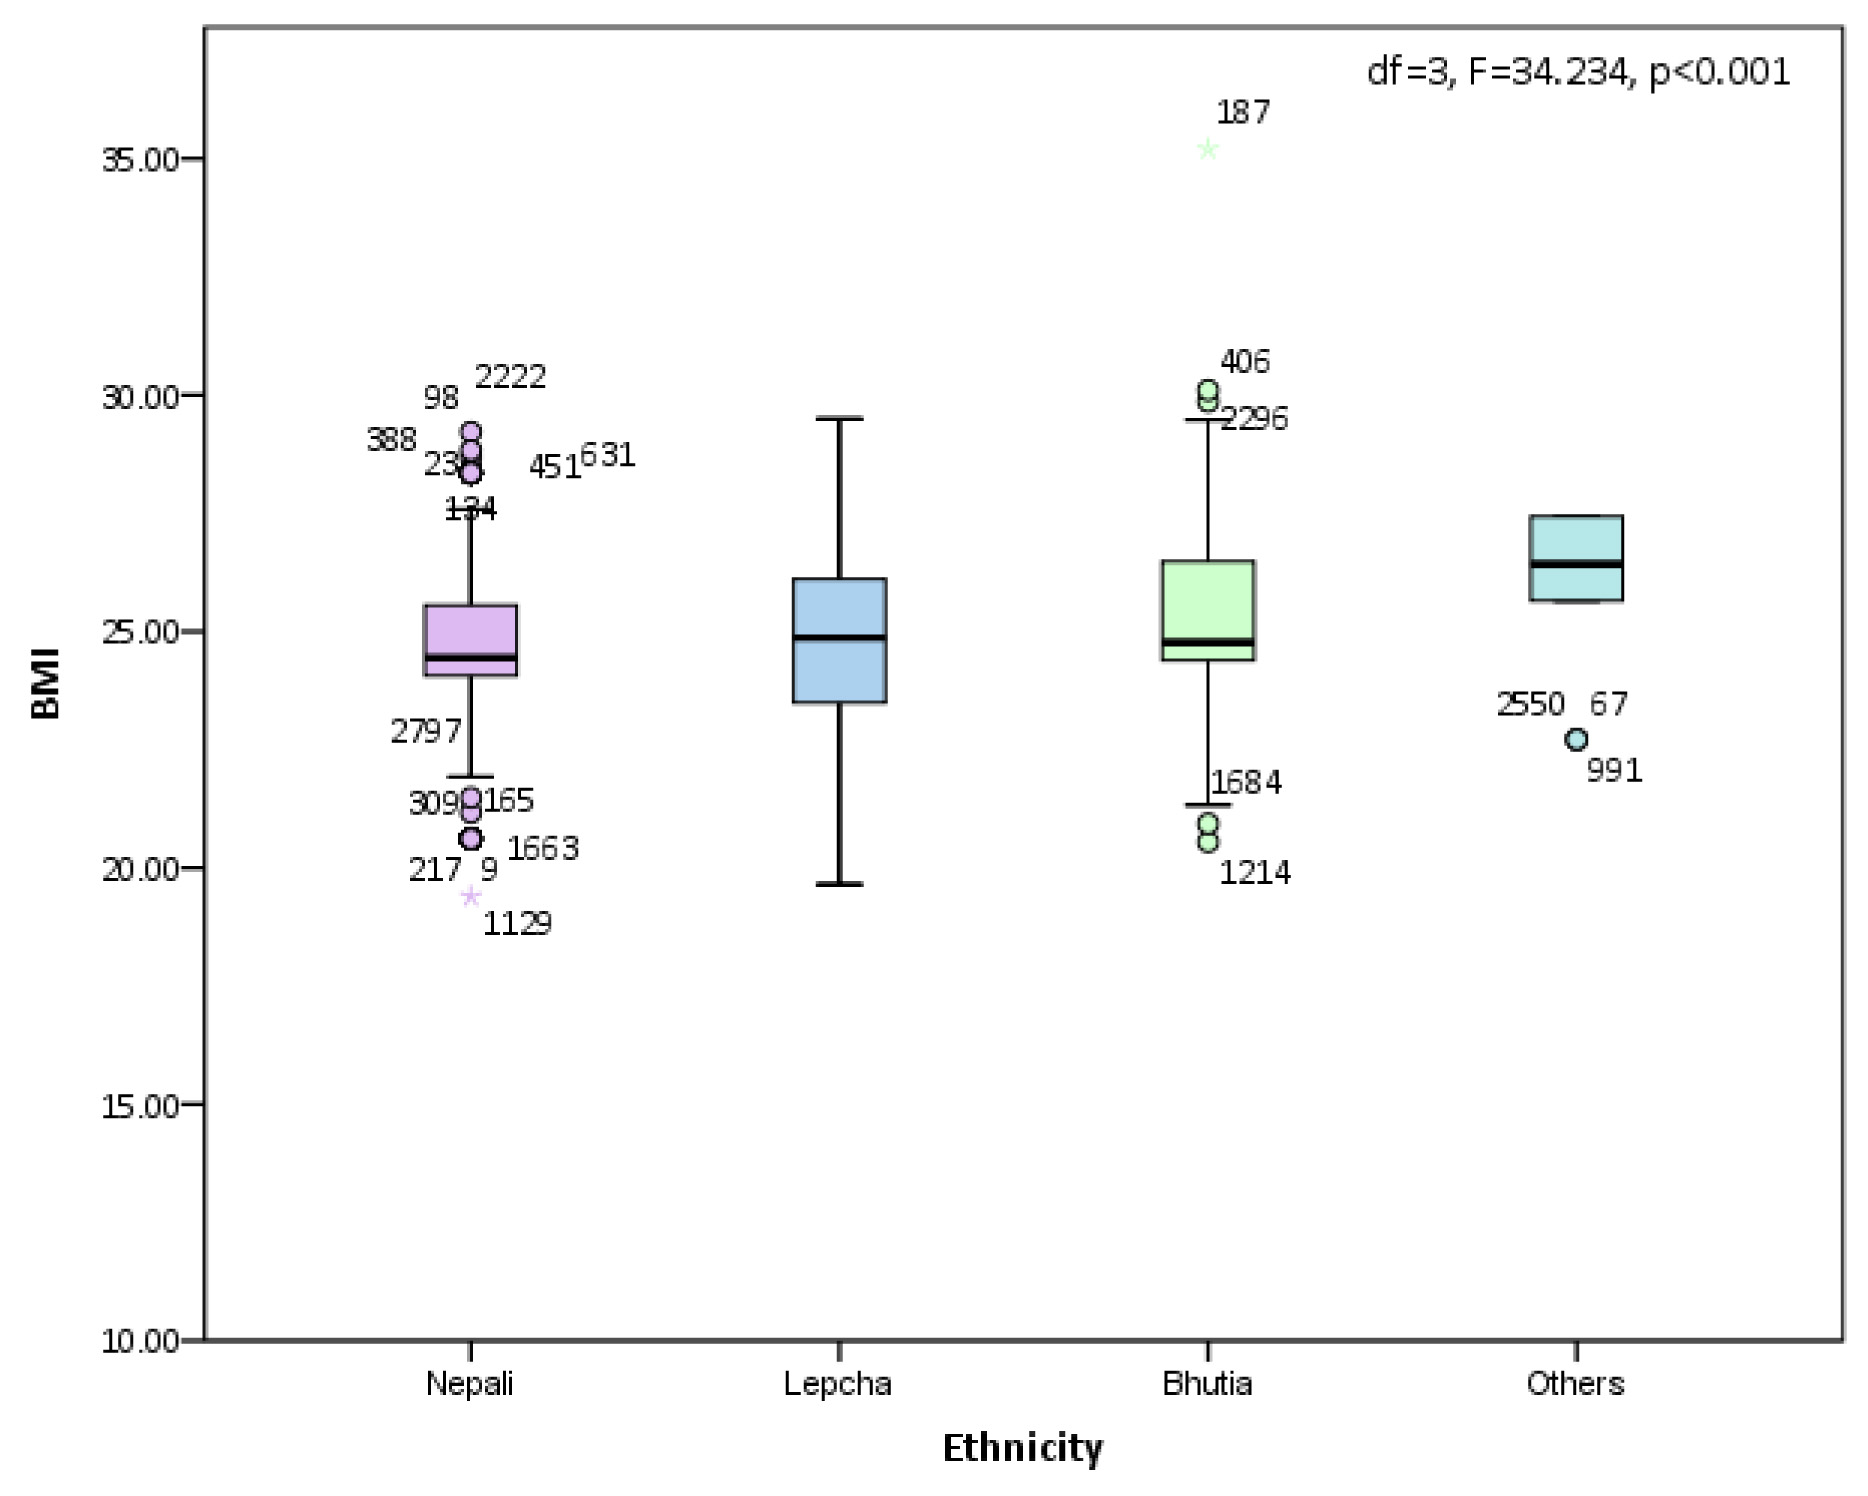
The difference in number of patients across the three ethnic groups was not much with Nepalis constituting 34.4%, Lepchas 31.7% and Bhutias 28.9% of total patients. But the difference rose significantly in favour of Nepali patients as they formed 43.6% of the cholelithiasis patients. They were followed by Lepchas (37.7%) and the Bhutias were distant third (16.1%) (df=3, χ2=494.153, p<0.001). Comparison of mean BMI of the three ethnic groups across the two study groups showed statistically significant difference (df=3, F=34.234, p<0.001) [Table/Fig-1,5,6].
Body Mass Index of the patient.s across all ethnic groups in Sikkim
| EthnicGroup | All Patients | Cholelithiasis Group | Non-cholelithiasis Group |
|---|
| N | M | SD | N | M | SD | N | M | SD |
|---|
| Nepali | 2472 | 23.54 | 2.51 | 1252 | 24.74 | 1.46 | 1220 | 22.31 | 2.76 |
| Lepcha | 2278 | 23.53 | 2.83 | 1082 | 24.93 | 1.69 | 1196 | 22.27 | 3.06 |
| Bhutia | 2077 | 23.50 | 2.45 | 462 | 25.21 | 1.36 | 1615 | 22.00 | 2.47 |
| Others | 355 | 23.96 | 2.82 | 76 | 26.38 | 1.07 | 279 | 23.30 | 2.79 |
| Total | 7182 | 23.55 | 2.62 | 2872 | 24.93 | 1.55 | 4310 | 22.62 | 2.77 |
Body mass index of the patients of various ethnic groups within the cholelithiasis group.
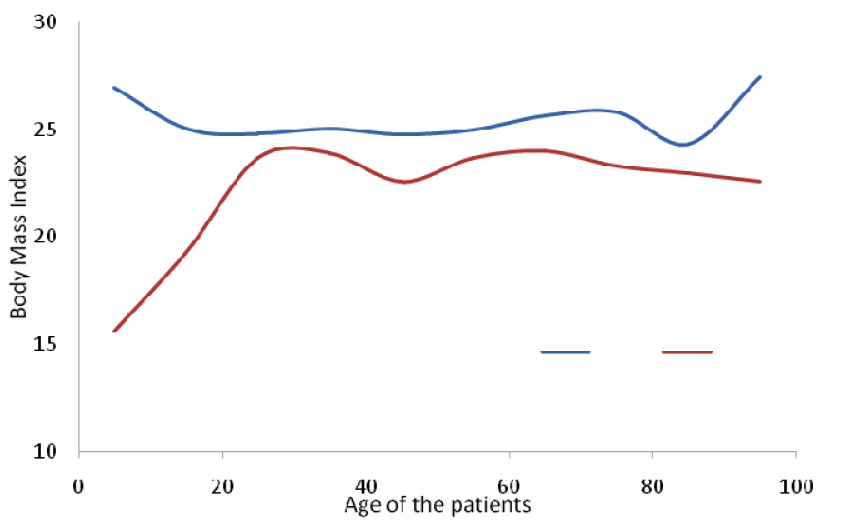
Plotting mean BMI against number of patients in various age groups shows a clear difference between the two curves representing cholelithiasis and non-cholelithiasis group. Graph shows that during most of the life time the risk of symptomatic cholelithiasis remains higher even if the BMI is within the normal range, however for symptomatic cholelithiasis to occur at extremes of age groups, BMI needs to be higher, as indicated by the upward stroke of the ends of the curve of cholelithiasis group [Table/Fig-7].
Comparing BMI in both the groups across all age groups, showing the risk of cholelithiasis with a higher BMI even if it falls in normal limits.
(Blue represents BMI of patients with cholelithiasis and red non-cholelithiasis group)
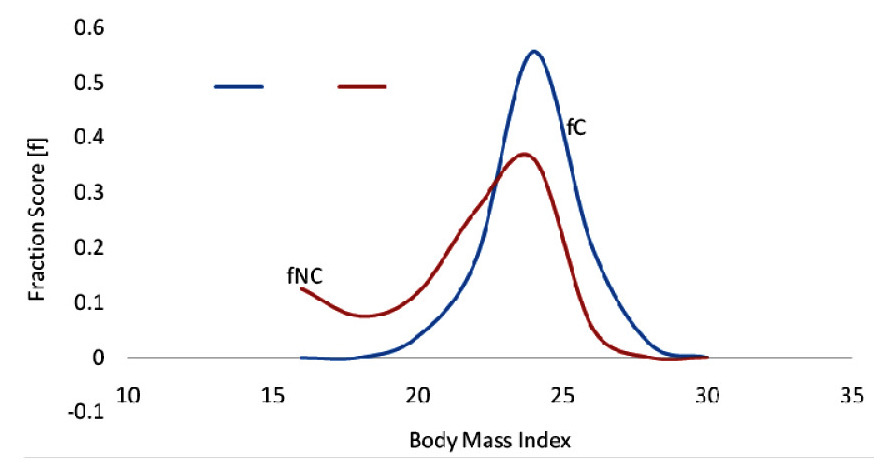
The fraction score for cholelithiasis and non-cholelithiasis patients (fC and Fnc) was calculated and plotted against BMI. The plot emphasises that more number of patients develop symptomatic cholelithiasis for a given BMI and the chances of having gallstone disease start increasing within the normal range of BMI and this tendency persists in overweight range of BMI [Table/Fig-8].
As the BMI increases, cholelithiasis patients outnumber the controls. Peak reaches within the normal range of BMI.
(Blue represents BMI of patients with cholelithiasis and red non-cholelithiasis group).
Difference of fraction scores (Δf = fC – fNC) was also plotted against BMI. The plot highlights that the difference between the symptomatic cholelithiasis and non-cholelithiasis patients shows a steep rise in the 22-24 range of BMI. The rise persists in the next level of BMI group also. Thereafter the gap narrows but remains on the positive side [Table/Fig-9].
Difference of patients per unit of BMI reverses in favour of cholelithiasis as the BMI increases.
Logistic regression analysis revealed BMI, age, gender of the patient and their ethnicity to be independently associated with cholelithiasis [Table/Fig-10].
Logistic Regression Analysis (Cholelithiasis as outcome or dependent variable).
| B | SE | χ2 | df | p | Exp (B) | 95% CI |
|---|
| Lower | Upper |
|---|
| BMI | --0.594 | 0.018 | 1098.065 | 1 | <0.001 | 0.552 | 0.533 | 0.572 |
| Age | 0.012 | 0.002 | 30.070 | 1 | <0.001 | 1.012 | 1.008 | 1.017 |
| Gender | --0.833 | 0.059 | 197.889 | 1 | <0.001 | 0.435 | 0.387 | 0.488 |
| Ethnicity | -- | -- | 576.953 | 3 | <0.001 | -- | -- | -- |
| Ethnicity(1) | --2.127 | 0.154 | 190.395 | 1 | <0.001 | 0.119 | 0.088 | 0.161 |
| Ethnicity(2) | --1.944 | 0.155 | 12.739 | 1 | <0.001 | 0.574 | 0.423 | 0.778 |
| Ethnicity(3) | --0.556 | 0.156 | 12.739 | 1 | <0.001 | 0.574 | 0.423 | 0.778 |
| Constant | 16.221 | 0.483 | 1125.792 | 1 | <0.001 | 11089144.51 | -- | -- |
B = Coefficient of the constant; SE = Standard error around Coefficient of constant;
Exp (B) = Exponential of B Coefficient (Odds ratio); CI = Confidence Interval
Discussion
Our study compared, only that fraction of cholelithiasis patients who developed symptoms, got admitted and underwent cholecystectomy in the hospital over last 10years. The data of 2,872 symptomatic cholelithiasis patients were compared against 4,310 patients with similar presentation covering patients of all age groups. The study showed that the risk of gallstone disease of being symptomatic increases with every unit increase in BMI. A study was conducted in Denmark using Mendelian randomization, where 77,679 individuals participated. Over a follow-up duration of 34years, 4,106 participants developed gallstones. The study concluded that the risk of gallstone disease increased 7% for every increase in BMI [3]. Kodama et al., examined the data of 7637 men aged between 48-59 years over a duration of 8 years. There were 174 men with gallstones and 104 men who had undergone cholecystectomy. Mean BMI of normal men was 23.78 while of those with gallstones and who underwent cholecystectomy was 24.17 (p=0.03) and 24.67 (p=0.0012), respectively. They concluded BMI is positively associated with prevalence of gallstones and cholecystectomy. A significant observation was that the patients with gallstones and those who underwent cholecystectomy (should be considered as symptomatic cholelithiasis) had a normal BMI [4]. Dittrick compared two groups, one who underwent bariatric surgery and had a BMI of 52+10 and the other who underwent organ donation surgery and had a BMI of 27+7. He concluded that the relative risk of benign gallbladder disease is positively correlated with the level of increase in the BMI. He also inferred that the risk of symptomatic cholelithiasis increases more rapidly compared to asymptomatic cholelithiasis (50% versus 25%) [5]. Völzke analysed the data of the population based study of health of 4,202 patients and showed female sex, age and being overweight were major independent risk factors for gallstone disease [6]. A combination of cross-sectional study was conducted on Swedish obese individuals and a longitudinal study on those patients who underwent surgery for biliary diseases. The mean BMI of patients who underwent surgery was 41.2 and 42.8 for male and female patients, respectively compared to controls (38.8 and 40.6 for male and female obese individuals). The study didn’t address the cholelithiasis in Swedish individuals with normal BMI [7]. In a study by Stampfer et al., where 90,302 women between 34 and 59 years were followed up for 8years (1980 to 1988), 2122 women develop gallstones during 607,104 person-years of follow up. A striking monotonic increase in gallstone disease was observed, the risk was seven times in excess among women with a BMI>45 compared to those with BMI<24. Women with a BMI>30 had a yearly gallstone incidence of approximately 1% and those with BMI>45 had a yearly incidence of 2%. They didn’t mention how cholelithiasis incidence is related to patients with normal BMI [8]. In another study published in 2003, researchers found a prevalence of >20% in patients who underwent bariatric surgery which rose to more than double after the surgery. This study confirmed the high correlation between the morbid obesity, rapid weight loss and gallbladder disease but they didn’t document how the gallstones are associated to normal BMI [9]. Volker et al., found the prevalence of gallbladder stone disease in children and adolescents is because of diet treatment for obesity, otherwise gallstone disease is rare in pre-pubertal period. Contrary to that we had 134 symptomatic cholelithiasis patients below 20 years of age over duration of 10 years with a BMI of 25.04. These patients neither had any other co-morbidity nor were on treatment for any other illness for a longer time. Compared to total cholecystectomies over the same duration, the incidence of cholecystectomies in the same age group was 4.66% [10]. In a meta-analysis done to know the co-morbidities related to obesity, researchers found that the pooled incidence rate ratios (IRR) and ratio of proportions (RR-P) for overweight and obesity related gallbladder disease for men were 1.61 (1.40-1.85) and 2.38 (2.06-2.75), respectively. For women, pooled IRRs and RR-P were 1.44 (1.05-1.98)] and 2.32 (1.17-4.57), respectively [11]. In a study from South India, Jayanthi et al., revealed the incidence of cholelithiasis was higher in individuals with a BMI of 22 or more (OR=1.49; 95% CI=1.09, 2.04; p=0.01) [12]. In a Danish study published recently, Shabanzadeh et al., followed up 2848 individuals without gallstones for a mean duration of 11.6 years doing serial ultrasound scans of abdomen. The overall cumulative incidence of gallstones was 0.6% per year and BMI was positively associated with male cholelithiasis patients [13].
In contrast in a community based study done in Chandigarh, India, Singh et al., screened 2649 individuals through house to house survey but did not find BMI as a factor influencing the prevalence of gallstone disease [14]. In another study done to know the prevalence of gallbladder disease and associated risk factors among American-Indians, Everhart didn’t find BMI to be independently associated with it in either sex [15]. This is in contrast to our study where we concluded that the incidence of symptomatic cholelithiasis increases with every increase in BMI.
Limitation
The major limitation of the study was that we could not take patients with incidental cholelithiasis in to account as they neither got admitted nor they underwent cholecystectomy unless required for some other indication. It’s not actually possible to know the actual prevalence of asymptomatic cholelithiasis by doing only a hospital based study. Comparing total patients of cholelithiasis (symptomatic as well as incidental) against the remaining population in a community based study will be more reasonable analysis than comparing symptomatic cholelithiasis against patients with similar presentation but without cholelithiasis in a hospital based study.
Conclusion
The study shows that even the patients with normal BMI are not immune to developing symptomatic cholelithiasis. As the age advances, the risk of cholelithiasis increases with every increase in BMI, however, in very young and old age, symptomatic cholelithiasis develops at a higher BMI. Women develop symptomatic cholelithiasis at a lower BMI compared to men. Age, BMI, gender and ethnicity are independent risk factors of symptomatic cholelithiasis.
B = Coefficient of the constant; SE = Standard error around Coefficient of constant;
Exp (B) = Exponential of B Coefficient (Odds ratio); CI = Confidence Interval