A spectrum of liver diseases is known to occur in type II Diabetes Mellitus (DM). This includes abnormal liver enzymes, Non-Alcoholic Fatty Liver Disease (NAFLD), cirrhosis, hepatocellular carcinoma and acute liver failure. The prevalence of NAFLD in type II DM is 34–74% [1,2] and in diabetes with obesity, virtually 100% [3]. Diabetic nephropathy is one of the known chronic complications of diabetes, due to the involvement of microvasculature. It begins with glomerular hyperperfusion and renal hypertrophy in the initial years of onset of diabetes resulting in elevation in Glomerular Filtration Rate (GFR). On progression of the disease, GFR reaches normal level and then slowly declines indicating advancement in renal disease. A few studies have reported, an association between NAFLD and diabetic nephropathy [4,5]. They reported that, incidence of occurrence of kidney dysfunction is higher in diabetic patients with NAFLD. On the contrary, a study by Zhan et al., reported no significant association between liver disease and diabetic nephropathy [6]. Thus, temporal association between liver disorder and diabetic nephropathy is controversial and inconclusive. A retrospective study was conducted to explore this area.
To compare the renal and liver profiles of type 2 diabetic patients compared to healthy controls and also to find the association between the two profiles in diabetics.
Materials and Methods
A case-control study was conducted in the Department of Biochemistry, Karwar Institute of Medical Sciences, Karwar, during the period from June 2015 to December 2015. Institutional Ethics Committee approval has been sought before starting the study. The participants formed the following groups -
Group I: Type II diabetic patients (irrespective of their treatment status and complications).
Group II: Patient attendants who are non- diabetic are taken as healthy controls.
We collected the data from 68 patients (40 males and 28 females) in group I and 58 controls (29 males and 29 females) in group II, from the pool of patients and their attendants who visited our clinical biochemistry laboratory respectively. Patients and controls were age matched, with mean age of 52.3±1.7 years and 47.8±2.1 years respectively. DM was diagnosed as per American Diabetic Association guidelines 2016 [7].
Inclusion criteria: Type II diabetic patients in the age group of 18-65 years.
Exclusion criteria: Type 1 diabetics, alcoholics, smokers, hypertensives, patients on hepatotoxic and nephrotoxic drugs and those with any other systemic illnesses.
Sample collection and analysis
A 5ml of venous blood sample was collected in plain tubes by puncturing ante cubital vein with aseptic precautions, centrifuged at 3000 rpm for 15 minutes. Plasma was analysed for liver profile, total bilirubin, direct bilirubin, Aspartate Amino Transferase (AST), Alanine Amino Transferase (ALT), Alkaline Phosphatase Test, renal parameters like creatinine, urea, uric acid with commercially available kits in fully automated chemistry analyser, Transasia’s XL-640. Estimated GFR (eGFR) was calculated by using MDRD formula [8];
eGFR= 186 x (serum creatinine)-1.154 x (Age) -0.203 x 0.742
(Multiplied by 0.742 only in females).
DM patients were studied under following categories based on eGFR; those with renal disease but no liver disease, with both renal and liver disease, those without renal disease but liver disease and those who had neither renal nor liver disease. A contingency table was prepared to assess the association between liver disease and diabetic nephropathy. A cut-off value for eGFR was 90ml/min below which is taken as diabetic renal disease and that for total bilirubin was 1.1mg/dl above which was taken as liver disease. In DM patients, eGFR ≥90, but other investigations suggesting renal disease in DM were also considered under diabetic nephropathy.
Statistical Analysis
Statistical analysis was done using Graph Pad Instat software. Mann-Whitney U test was done to compare the parameters between the two groups and expressed as mean ± Standard Error of Mean (SEM). The p<0.05 was considered significant. Spearman’s correlation coefficient was calculated to find the correlation between various parameters in patients. Linear regression analysis was carried out wherever applicable. Fisher-Exact test was done to assess the association of liver disease with diabetic nephropathy in group I, by drawing 2x2 contingency table. Kruskal Wallis test was applied to compare total bilirubin levels in different stages of diabetic nephropathy.
Results
Renal and hepatic profiles of group I and II were compared, results expressed as mean±SEM are depicted in [Table/Fig-1]. It was found that 14 diabetic patients (21%) had both renal and liver disease, 8 patients (12%) suffered only from liver disorder, 42 patients (62%) suffered only from nephropathy and 4 of the patients (6%) neither had renal nor liver disorder. Contingency table was constructed using the number of patients in each category mentioned [Table/Fig-2].
Comparison of renal and liver parameters between type II DM patients versus controls.
| Parameter | Type II Diabetesmellitus (n=68)Mean+ SD | Controls(n=58)Mean+ SD | p-value |
|---|
| Age (yr) | 52.3±1.7 | 47.8±2.1 | ns |
| Random blood sugar(mg/dl) | 207.03±9.6 | 101.52±2.09 | 0.0001 |
| AST (U/L) | 68.2±9.37 | 24.82 ± 0.95 | <0.0001 |
| ALT (U/L) | 43.52±5.74 | 19.32±1.22 | <0.0001 |
| Alkalinephosphatase (IU/L) | 89.64±5.05 | 82.89±3.83 | ns |
| Total bilirubin(mg/dl) | 1.17±0.14 | 0.65±0.05 | 0.015 |
| Direct bilirubin(mg/dl) | 0.49±0.06 | 0.25±0.02 | 0.0035 |
| eGFR | 65.45±4.42 | 92.2±6.39 | 0.0003 |
| Creatinine (mg/dl) | 1.52±0.16 | 1.14±0.16 | 0.0078 |
| Urea (mg/dl) | 42.1±5.4 | 28.96±3.4 | 0.02 |
p< 0.05 significant
p< 0.01 highly significant
p< 0.001 very highly significant
p< 0.0001 extremely highly significant
ns – not significant
DM - Diabetes Mellitus
Contingency table for Fisher-Exact test.
| Diabetic nephropathy | DM without nephropathy |
|---|
| DM with liver disease | 14 | 8 |
| DM without liver disease | 42 | 4 |
Fisher’s Exact test showed that the association of diabetic nephropathy and liver disorders significant (two-sided p-value is 0.0136). Odds ratio= 0.1667. The relative risk of developing of liver disorders in diabetic nephropathy was 0.64.
Number of patients in each stage of diabetic nephropathy are categorized [Table/Fig-3] and total bilirubin levels in each stage were compared. There was no significant difference in total bilirubin levels in patients among different stages of nephropathy.
Staging of chronic kidney disease.
| Stage | Description | eGFR | No. of DiabeticNephropathy patients |
|---|
| I | Normal/elevated GFR | ≥90 | 11 |
| II | Mildly ↓ GFR | 60-89 | 29 |
| III | Moderately ↓ GFR | 30-59 | 18 |
| IV | Severely ↓ GFR | 15-29 | 5 |
| V | Kidney failure | <15 | 5 |
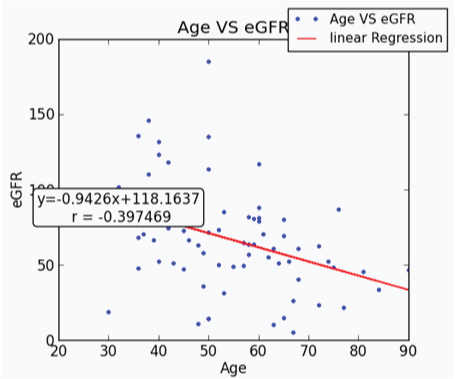
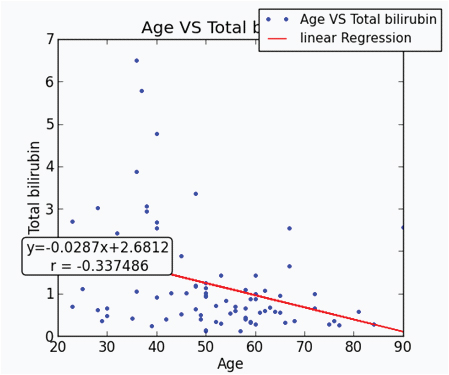
Linear regression analysis between age and eGFR in type II DM patients showed a highly significant negative association between them (r=-0.397, R2=0.15 and p<0.001) [Table/Fig-4]. Age and total bilirubin were significantly negatively correlated on linear regression analysis (r=-0.337, R2 = 0.1, p=0.002 [Table/Fig-5]). It was also found that there was no significant deviation from the linearity.
Linear regression analysis of age and eGFR.
Linear regression analysis of age and total bilirubin.
A weak positive association was found between eGFR and total bilirubin in Spearman’s correlation which was not statistically significant.
Spearman’s correlation showed a strong positive association between AST and eGFR, r = 0.27, two tailed p-value is 0.038. ALT and eGFR bear a positive association, r=0.439, p=0.0001. ALP didn’t show any significant association with renal function tests.
Discussion
When we compared the liver profile of diabetic patients with controls, we noted a significantly high total bilirubin, direct bilirubin, ALT and AST in diabetics. Our study agrees with a report by Trombetta et al., which suggest an elevation of liver enzymes in diabetics [9]. In a report involving clinical trials with type 2 diabetes patients, serum ALT, AST or ALP were 1-2.5 times higher than the upper normal [10].
Significantly, high total bilirubin levels in diabetic patients [Table/Fig-1] when compared to controls is in agreement with study by Eun Sook et al., which argues that bilirubin has a protective role in causing diabetic nephropathy because of its antioxidant property [11]. A positive association was observed between bilirubin and GFR in our study supports this fact. Protective role of bilirubin is accepted and proved in our study. We also found a significant association between renal and liver disease in DM. But there is no significant difference in bilirubin levels in different stages of nephropathy. This implies that, liver disease might have a protective role in causation in diabetic nephropathy, but it does not bear a relation with the progression of renal disease. The fact that liver disease bears an association with nephropathy in diabetes is supported by the strong positive correlation of eGFR with ALT levels in our study. This suggests that higher liver enzymes levels are associated with better renal functions.
There are several reports which suggest a beneficial role of total bilirubin in diabetic nephropathy [12,13]. In a prospective study by Ineke et al., reports a protective effect of bilirubin against progression of nephropathy in type II diabetes which is not proved in our report [14]. This could be attributed to a smaller number of patients in each group of nephropathy in our study. Tsuyoshi et al., showed in a study that patients with nonalcoholic steatohepatitis had decreased GFR [15]. He opines that screening and treating liver disease might be useful in prolonging the development and progression of diabetic nephropathy. A retrospective study was performed by Guoyu et al., to know the association between liver disease and renal disease in type II DM [16]. They reported that risk of liver disease is common in diabetic nephropathy and this was attributed to high liver fat content. However, the exact pathophysiology involved is not known.
A strong negative correlation has been found between age and eGFR as well as age and total bilirubin [Table/Fig-4,5]. This suggests that age has a significant role in causation of liver and renal disease in DM. We can summarize from our study that old diabetics tend to have low total bilirubin which is protective and hence are at risk of nephropathy.
Limitation
The sample size being small limited the study.
Conclusion
We have found a significant association between liver and renal disease in type II DM. By knowing the possible risk factors associated, it is possible to take therapeutic measures so as to delay progression of liver and renal diseases associated with DM. Only a few studies are available which report the temporal relation between liver and kidney diseases associated with type II DM. A prospective study need to be conducted with improved study design. i.e., confounding risk factors need to be matched and sample size need to be increased so as to know the association between renal and liver disease in diabetes as well as their co-occurrence.
p< 0.05 significant
p< 0.01 highly significant
p< 0.001 very highly significant
p< 0.0001 extremely highly significant
ns – not significant
DM - Diabetes Mellitus