A wide spectrum of techniques, are available for demonstrating the various mineralized tissues of the body. The technique employed relies upon several factors including the provisional diagnosis rendered by the clinician, the urgency of the case and the level of investigation desired. Following biopsy the tissue sample is subjected to a series of procedures including fixation, processing and staining to ensure that the sample is of diagnostic quality [1].
Hard tissue specimens differ from their soft tissue counterpart, in that the former have to be decalcified before routine processing and staining. Several decalcifying reagents including acids and chelating agents have shown promising results [1]. The end point of decalcification is determined using various modalities including, routine radiograph and chemical tests [1]. Following decalcification, the tissues are processed. Processing involves several steps including dehydrating the specimen and rehydrating them with the appropriate media to enable sectioning without tissue damage or distortion. Staining provides the tissue with the necessary differentiation to aid in diagnosis [1]. At present, the average time taken for Conventional Processing (CP) and staining is approximately 6-8 hours and for Conventional Decalcification (CD) is 25-40 hours (depending on the size of the specimen). The demand for faster processing is ever growing, especially in cases of malignancies wherein the diagnosis is time restrained [2].
Several innovations have been proposed to allow faster and accurate diagnosis. The use of automated processing machine heightens the quality of the final specimen, but the time duration remains the same (6-8 hours) [2]. Increasing the temperature decreases the viscosity of the processing fluid enabling rapid tissue penetration. Applying conventional heat to the processing fluid leads to uneven tissue penetration causing patchy staining. Microwave produces uniform heat thereby increasing the rate of tissue penetration and maintains the diagnostic quality of the specimen [2–5]. Mayers in 1970, was the first to propose the use of microwave in histopathology. He advocated the use of microwave to hasten the fixation time [2]. Apart from shortening the diagnosing time, Microwave Decalcification (MD) and processing has prevented exposure to several potential carcinogens. Studies have also shown that microwave processing causes lesser degree of nucleic acid denaturation [6–7]. Though many studies have emphasized the need for microwave decalcification, none to our knowledge have subjected the decalcified tissue to microwave processing and staining [4,5,8–12]. This study compares the conventional decalcification, processing and staining with microwave based decalcification, processing and staining.
The aim was to compare CD, histo-processing and staining of oral hard tissues, with microwave based decalcification, histo-processing and staining using 5% nitric acid as the decalcifying agent. The objectives were to estimate and compare the time difference and the tissue quality among the various techniques employed.
Materials and Methods
The study group for the present in-vitro analysis consisted of 240 hard tissue specimens received in the Department of Oral Surgery, M.S. Ramaiah Dental College, Bengaluru, Karnataka, India. The specimens were fixed in 10% buffered formalin. The study was performed after obtaining clearance from the ethical board of the institution.
Inclusion Criteria
A total of 180 sound teeth (60 incisors, 60 premolars, 60 molars) indicated for extraction (orthodontic purpose, teeth with Grade III mobility and impacted teeth) were collected.
Mandibular bone specimens (indicated for resection was collected post-diagnosis). These specimens were sectioned into 60 pieces of uniform size (approximately 0.5cm).
Exclusion Criteria
Teeth with caries and restorations
Bone specimens other than mandible
Pathologic bone
All the hard tissue specimens were subjected to one of the four techniques enlisted in [Table/Fig-1]. The entire procedure was blinded and evaluated by two examiners.
| CD-CP | Conventional decalcification with conventional tissue processing and staining. |
| CD-MP | Conventional decalcification with microwave tissue processing and staining. |
| MD-CP | Microwave decalcification with conventional tissue processing and staining. |
| MD-MP | Microwave decalcification with microwave tissue processing and staining. |
CD-conventional decalcification; MD-microwave decalcification; CP-conventional processing and staining; MP-microwave processing and staining
Conventional Decalcification, Processing and Staining: The formalin fixed hard tissue specimens were water washed for 30 minutes before being placed in 5% nitric acid at room temperature. The solutions were changed periodically till complete decalcification was achieved. The end point of decalcification was confirmed with a radiograph as it provides an accurate interpretation of the same without damaging the tissue specimen. Following decalcification, the specimens were subjected to routine processing and staining [3].
Microwave Decalcification, Processing and Staining: The MD protocol employed in the present study was based on a modification of the methodology employed by Sangeetha et al., [5]. Post fixation the hard tissue specimens were water washed for 10 minutes before being placed in a microwave bowl containing 5% nitric acid. The bowl with the specimens was placed in the microwave (Samsung Type-G2739N, maximum output was 750W), and set for a 10 second cycle at 300W. At the end of the cycle, the specimen was removed from the microwave and allowed to cool down for an hour, following which the specimens were placed for another 10 second microwave cycle. The process was repeated several times (average 7 cycles per day) with regular changes of each of the solutions (every 3 hours) till decalcification was completed. The end point of decalcification was confirmed with a radiograph.
The microwave tissue processing and staining was based on the methodology given by Mahesh Babu et al., [3].
The decalcified hard tissue specimens were evaluated by two oral pathologists by blinding the procedure. The evaluation was based on a modification in the criteria employed by Prasad et al., [13]. As illustrated in [Tables/Fig-2,3]. Evaluation ranged from scores of 1-5 (1-non-diagnostic, 2-poor, 3-average, 4-good, 5-excellent), depending on the quality of the tissue.
Criteria for evaluating the tooth specimens.
| Parameters | Criteria for Evaluation |
|---|
| Sectioning | Section thickness (uniform/uneven); artifacts (present/absent) |
| Staining | Staining (uniform/patchy); Intensity (under/over/optimal) |
| Dentin | Dentinal tubules, odontoblast architecture |
| Cementum | Cementum architecture and its attachment to dentin |
| Pulp | The zones of pulp and its attachment to the dentin |
Criteria for evaluating the bone specimens.
| Parameters | Criteria for Evaluation |
|---|
| Sectioning | Section thickness (uniform/uneven); artifacts (present/absent) |
| Staining | Staining (uniform/patchy); intensity (under/over/optimal) |
| Lacunae and cellular architecture | Osteocyte, osteoblast (presence/absence), retraction artifacts within the lacunae |
| Haversian canal and canaliculae | Histology of the vasculature and the fine cellular process in the canaliculae |
| Lamellations | Prominence and staining pattern |
Results
Total Decalcification, Processing and Staining Time Duration: Time taken for MD as calculated in hours for both bone and tooth specimens were approximately half the time of CD as elicited in [Table/Fig-4]. The time taken for CP and staining of both the hard tissue specimens was approximately 7 hours 31 minutes. MP and staining reduced the time period to approximately 2 hours 16 minutes.
Time duration for conventional and microwave decalcification in hours for the bone and tooth specimens.
| Group | N | Mean | SD | Median | Min. | Max. | Mann-Whitney U | p-value |
|---|
| Bone | CD | 30 | 26.8 | 1.716 | 27.0 | 23 | 29 | 0.000 | <0.001 |
| MD | 30 | 15.7 | 1.729 | 16.0 | 12 | 19 |
| Ti | CD | 30 | 22.67 | 1.322 | 22.50 | 21 | 26 | 0.000 | <0.001 |
| MD | 30 | 13.23 | 1.406 | 13.00 | 11 | 16 |
| Tp | CD | 30 | 44.03 | 1.991 | 43.00 | 41 | 48 | 0.000 | <0.001 |
| MD | 30 | 23.17 | 3.185 | 23.00 | 16 | 31 |
| Tm | CD | 30 | 75.63 | 2.251 | 75.00 | 71 | 79 | 0.000 | <0.001 |
| MD | 30 | 35.80 | 2.058 | 36.00 | 31 | 39 |
Ti-Tooth incisor; Tp-Tooth premolar; Tm-Tooth molar; CD-conventional decalcification; MD-microwave decalcification; N-number of hours
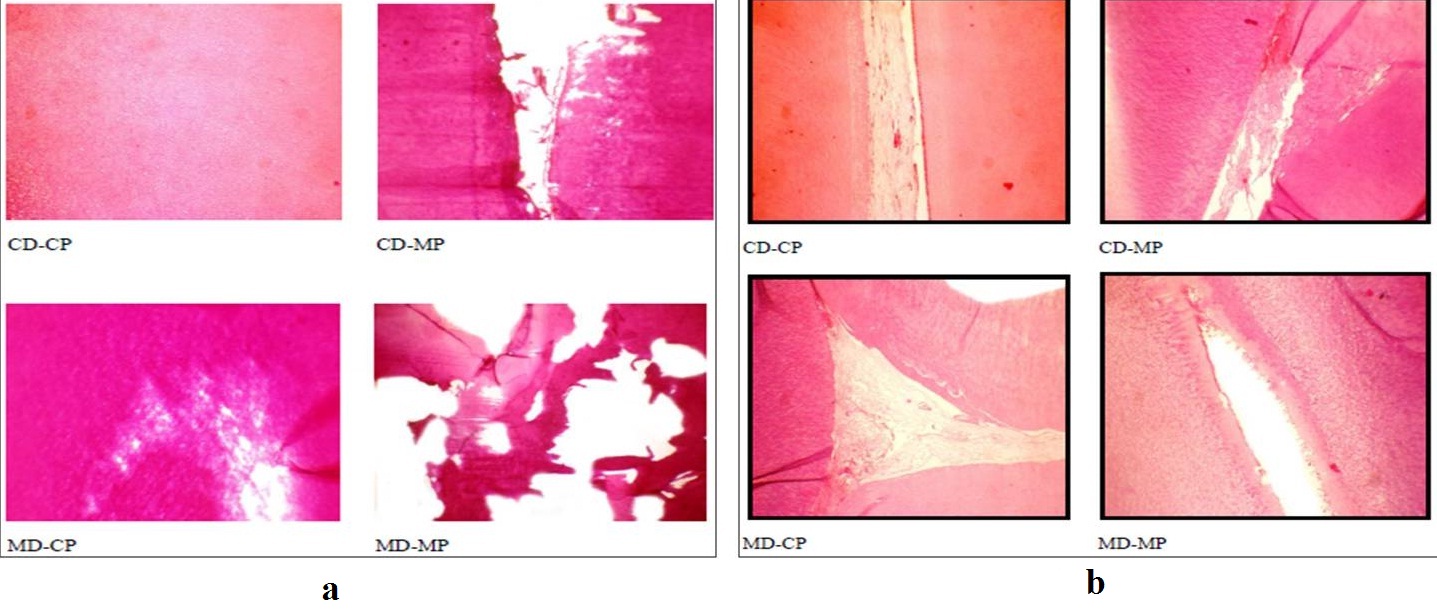
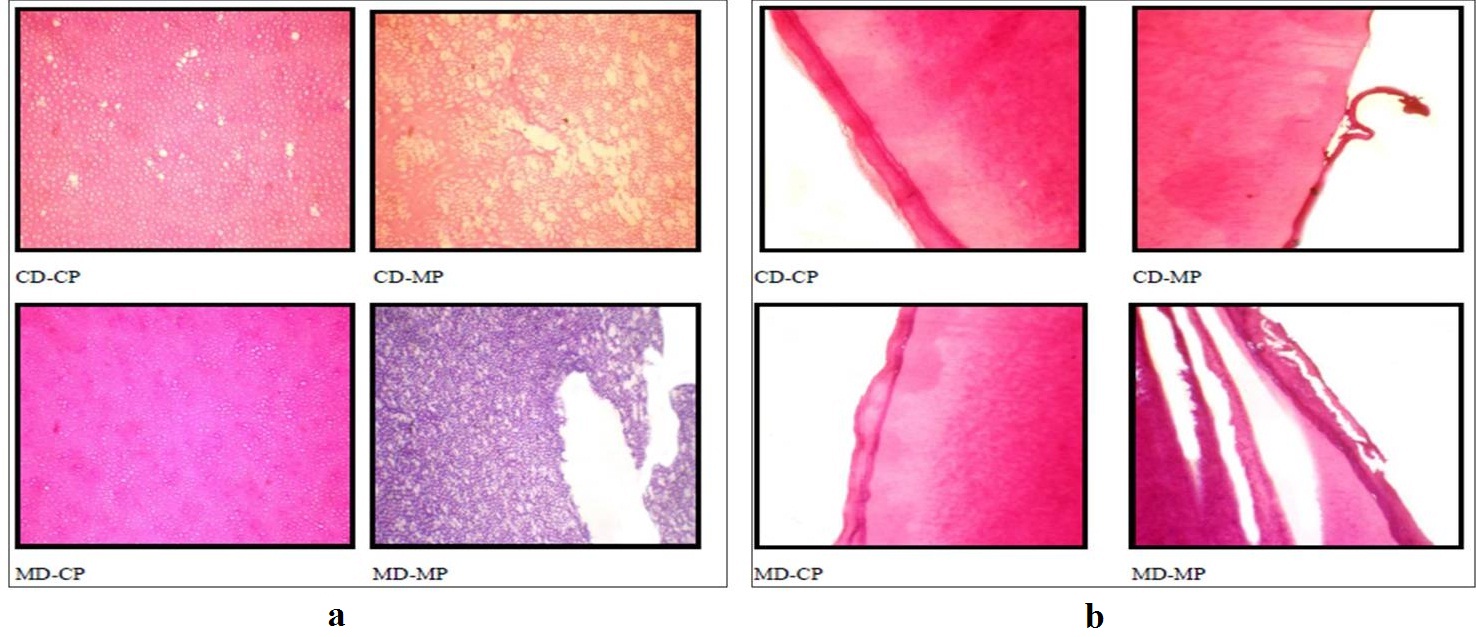
Quality of the Hard Tissue Specimens: The overall tissue quality of the bone specimens including sectioning and staining lacunae and cellular architecture, lamellations, haversian canal and canaliculae was assessed [Tables/Fig-5,6]. The tooth specimens were assessed for sectioning and staining quality, pulp, dentin and cementum [Tables/Fig-7,8]. The quality of both the hard tissue specimens was found to be better preserved in CD with CP and MD with CP in comparison to CD with MP and MD with MP. The kappa statistics was 0.900 which showed high agreement between the observers. The results are illustrated in [Table/Fig-9,10,11,12,13,14,15 and 16].
Illustrating the quality of sectioning and staining (a) and lacunae and celullar architecture (b) of the bone specimens among the four techniques
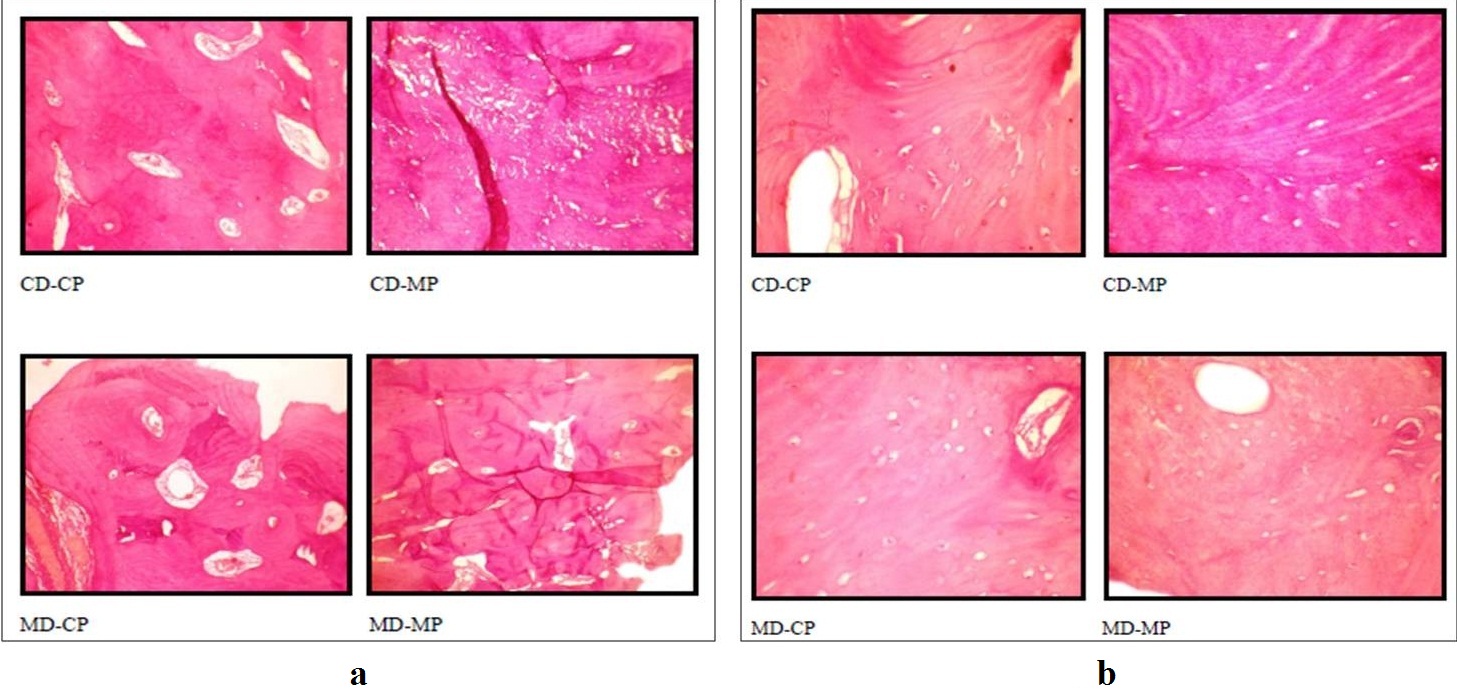
Illustrating the quality of lamellations (a) and haversian canaliculae (b) of the bone specimens among the four techniques.
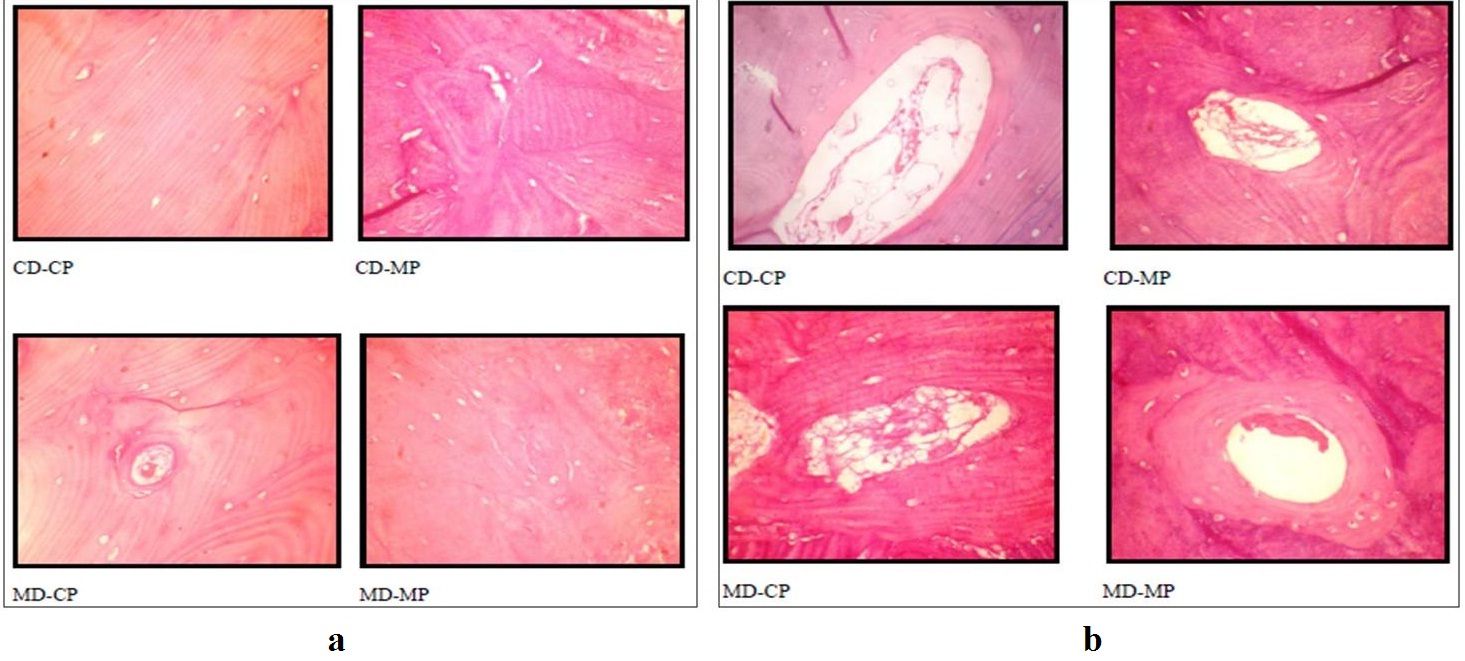
Illustrating the quality of sectioning and staining (a) and pulp (b) of the tooth specimens among the four techniques.
Illustrating the quality of dentine (a) and cementum (b) of the tooth specimens among the four techniques.
The difference in the quality of the bone specimens among the four techniques- Kruskal Wallis Test, N-number of specimens.
| | Group | N | Mean | SD | Min. | Max. | Chi square* | p-value |
|---|
| Bone | Sectioning | CD-CP | 15 | 4.47 | 0.516 | 4.00 | 4 | 48.720 | <0.001 |
| CD-MP | 15 | 1.40 | 0.507 | 1.00 | 1 |
| MD-CP | 15 | 3.47 | 0.516 | 3.00 | 3 |
| MD-MP | 15 | 1.60 | 0.737 | 1.00 | 1 |
| Staining | CD-CP | 15 | 3.93 | 0.799 | 4.00 | 3 | 37.642 | <0.001 |
| CD-MP | 15 | 1.60 | 0.632 | 2.00 | 1 |
| MD-CP | 15 | 2.27 | 0.458 | 2.00 | 2 |
| MD-MP | 15 | 1.73 | 0.704 | 2.00 | 1 |
| Lacunae and cellular architecture | CD-CP | 15 | 4.20 | 0.676 | 4.00 | 3 | 42.040 | <0.001 |
| CD-MP | 15 | 1.47 | 0.516 | 1.00 | 1 |
| MD-CP | 15 | 2.27 | 0.799 | 2.00 | 1 |
| MD-MP | 15 | 1.27 | 0.458 | 1.00 | 1 |
| Lamellations | CD-CP | 15 | 4.33 | 0.488 | 4.00 | 4 | 44.203 | <0.001 |
| CD-MP | 15 | 2.07 | 0.594 | 2.00 | 1 |
| MD-CP | 15 | 2.67 | 0.816 | 3.00 | 1 |
| MD-MP | 15 | 1.33 | 0.488 | 1.00 | 1 |
| Haversian canal and canaliculae | CD-CP | 15 | 4.00 | 0.756 | 4.00 | 3 | 39.237 | <0.001 |
| CD-MP | 15 | 2.00 | 0.845 | 2.00 | 1 |
| MD-CP | 15 | 2.80 | 0.775 | 3.00 | 2 |
| MD-MP | 15 | 1.33 | 0.488 | 1.00 | 1 |
The difference in the quality of the bone specimens between individual techniques- Mann-Whitney U test.
| | | CD-MP | MD-CP | MD-MP |
|---|
| | Group | Mann-Whitney U | p-value | Mann-Whitney U | p-value | Mann-Whitney U | p-value |
|---|
| Bone | Sectioning | CD-CP | 0.000 | <0.001 | 28.000 | <0.001 | 0.000 | <0.001 |
| CD-MP | - | - | 0.000 | <0.001 | 99.000 | 0.523 |
| MD-CP | - | - | - | - | 8.000 | <0.001 |
| Staining | CD-CP | 2.500 | <0.001 | 10.000 | <0.001 | 5.000 | <0.001 |
| CD-MP | - | - | 51.500 | 0.004 | 101.500 | 0.614 |
| MD-CP | - | - | - | - | 64.500 | 0.023 |
| Lacunae and cellular architecture | CD-CP | 0.000 | <0.001 | 10.000 | <0.001 | 0.000 | <0.001 |
| CD-MP | - | - | 50.000 | 0.005 | 90.000 | 0.264 |
| MD-CP | - | - | - | - | 35.000 | 0.001 |
| Lamellations | CD-CP | 0.000 | <0.001 | 10.000 | <0.001 | 0.000 | <0.001 |
| CD-MP | - | - | 64.500 | 0.030 | 45.000 | 0.002 |
| MD-CP | - | - | - | - | 22.500 | 0.001 |
| Haversian canal and canaliculae | CD-CP | 10.000 | <0.001 | 34.500 | 0.001 | 0.000 | <0.001 |
| CD-MP | - | - | 60.000 | 0.021 | 62.500 | 0.023 |
| MD-CP | - | - | - | - | 15.000 | 0.001 |
The difference in the quality of the incisor tooth specimens among the four techniques- Kruskal Wallis Test, N-number of specimens.
| | Group | N | Mean | SD | Min. | Max. | Chi square* | p-value |
|---|
| Ti | Sectioning | CD-CP | 15 | 4.33 | 0.488 | 4 | 5 | 49.367 | <0.001 |
| CD-MP | 15 | 1.13 | 0.352 | 1 | 2 |
| MD-CP | 15 | 3.53 | 0.64 | 2 | 4 |
| MD-MP | 15 | 1.73 | 0.704 | 1 | 3 |
| Staining | CD-CP | 15 | 4.07 | 0.884 | 2 | 5 | 44.488 | <0.001 |
| CD-MP | 15 | 1.40 | 0.507 | 1 | 2 |
| MD-CP | 15 | 4.20 | 0.676 | 3 | 5 |
| MD-MP | 15 | 1.60 | 0.737 | 1 | 3 |
| Pulp | CD-CP | 15 | 3.67 | 0.724 | 2 | 5 | 35.625 | <0.001 |
| CD-MP | 15 | 1.40 | 0.632 | 1 | 3 |
| MD-CP | 15 | 2.60 | 0.632 | 2 | 4 |
| MD-MP | 15 | 2.00 | 0.756 | 1 | 3 |
| Dentin | CD-CP | 15 | 4.33 | 0.617 | 3 | 5 | 41.173 | <0.001 |
| CD-MP | 15 | 1.33 | 0.617 | 1 | 3 |
| MD-CP | 15 | 2.40 | 0.828 | 1 | 4 |
| MD-MP | 15 | 1.73 | 0.594 | 1 | 3 |
| Cementum | CD-CP | 15 | 3.93 | 0.799 | 2 | 5 | 35.722 | <0.001 |
| CD-MP | 15 | 1.60 | 0.507 | 1 | 2 |
| MD-CP | 15 | 2.40 | 0.828 | 1 | 4 |
| MD-MP | 15 | 1.67 | 0.617 | 1 | 3 |
The difference in the quality of the incisor tooth specimens between individual techniques- Mann-Whitney U test.
| | | CD-MP | MD-CP | MD-MP |
|---|
| | Group | Mann-Whitney U | p-value | Mann-Whitney U | p-value | Mann-Whitney U | p-value |
|---|
| Ti | Sectioning | CD-CP | 0.000 | <0.001 | 45.000 | 0.001 | 0.000 | <0.001 |
| CD-MP | - | - | 1.000 | <0.001 | 58.000 | 0.008 |
| MD-CP | - | - | - | - | 10.500 | <0.001 |
| Pulp | CD-CP | 3.000 | <0.001 | 106.500 | 0.786 | 6.500 | <0.001 |
| CD-MP | - | - | 0.000 | <0.001 | 99.000 | 0.523 |
| MD-CP | - | - | - | - | 2.000 | <0.001 |
| Lamellations | CD-CP | 5.000 | <0.001 | 34.000 | 0.001 | 15.500 | <0.001 |
| CD-MP | - | - | 24.500 | <0.001 | 63.000 | 0.026 |
| MD-CP | - | - | - | - | 66.500 | 0.038 |
| Dentin | CD-CP | 0.500 | <0.001 | 11.500 | 0.001 | 0.500 | <0.001 |
| - | - | 33.500 | <0.001 | 70.500 | 0.049 |
| MD-CP | - | - | - | - | 63.500 | 0.021 |
| Cementum | CD-CP | 4.500 | <0.001 | 25.500 | <0.001 | 6.000 | <0.001 |
| CD-MP | - | - | 52.500 | 0.005 | 108.000 | 0.830 |
| MD-CP | - | - | - | - | 58.500 | 0.012 |
The difference in the quality of the premolar tooth specimens among the four techniques- Kruskal Wallis Test, N- number of specimens.
| | Group | N | Mean | SD | Min. | Max. | Chi square* | p-value |
|---|
| Tp | Sectioning | CD-CP | 15 | 4.33 | 0.724 | 3 | 5 | 44.517 | <0.001 |
| CD-MP | 15 | 1.60 | 0.507 | 1 | 2 |
| MD-CP | 15 | 4.33 | 0.724 | 3 | 5 |
| MD-MP | 15 | 1.93 | 0.884 | 1 | 3 |
| Staining | CD-CP | 15 | 4.13 | 0.743 | 3 | 5 | 45.253 | <0.001 |
| CD-MP | 15 | 1.73 | 0.704 | 1 | 3 |
| MD-CP | 15 | 4.13 | 0.64 | 3 | 5 |
| MD-MP | 15 | 1.47 | 0.64 | 1 | 3 |
| Pulp | CD-CP | 15 | 3.93 | 0.704 | 3 | 5 | 39.182 | <0.001 |
| CD-MP | 15 | 1.40 | 0.507 | 1 | 2 |
| MD-CP | 15 | 3.40 | 1.121 | 2 | 5 |
| MD-MP | 15 | 1.80 | 0.775 | 1 | 3 |
| Dentin | CD-CP | 15 | 4.13 | 0.64 | 3 | 5 | 40.627 | <0.001 |
| CD-MP | 15 | 1.20 | 0.414 | 1 | 2 |
| MD-CP | 15 | 2.27 | 0.799 | 1 | 4 |
| MD-MP | 15 | 1.93 | 0.799 | 1 | 3 |
| Cementum | CD-CP | 15 | 4.07 | 0.799 | 3 | 5 | 34.881 | <0.001 |
| CD-MP | 15 | 1.73 | 0.594 | 1 | 3 |
| MD-CP | 15 | 2.53 | 0.743 | 1 | 4 |
| MD-MP | 15 | 2.00 | 0.756 | 1 | 3 |
The difference in the quality of the premolar tooth specimens between individual techniques- Mann-Whitney U test.
| | | CD-MP | MD-CP | MD-MP |
|---|
| | Group | Mann-Whitney U | p-value | Mann-Whitney U | p-value | Mann-Whitney U | p-value |
|---|
| Tp | Sectioning | CD-CP | .000 | <0.001 | 112.500 | 1.000 | 5.000 | <0.001 |
| CD-MP | - | - | 0.000 | <0.001 | 90.000 | 0.312 |
| MD-CP | - | - | - | - | 5.000 | <0.001 |
| Staining | CD-CP | 3.000 | <0.001 | 111.500 | 0.963 | 1.500 | <0.001 |
| CD-MP | - | - | 2.000 | <0.001 | 88.500 | 0.269 |
| MD-CP | - | - | - | - | 1.000 | <0.001 |
| Pulp | CD-CP | 0.000 | <0.001 | 80.500 | 0.164 | 6.000 | <0.001 |
| CD-MP | - | - | 12.000 | <0.001 | 81.000 | 0.147 |
| MD-CP | - | - | - | - | 30.000 | <0.001 |
| Dentin | CD-CP | 0.000 | <0.001 | 10.500 | <0.001 | 4.000 | <0.001 |
| CD-MP | - | - | 30.000 | <0.001 | 54.000 | 0.006 |
| MD-CP | - | - | - | - | 89.000 | 0.295 |
| Cementum | CD-CP | 2.000 | <0.001 | 21.000 | 0.001 | 8.000 | <0.001 |
| CD-MP | - | - | 49.000 | 0.004 | 90.500 | 0.313 |
| MD-CP | - | - | - | - | 72.000 | 0.071 |
The difference in the quality of the molar tooth specimens among the four techniques- Kruskal Wallis Test, N- number of specimens.
| | Group | N | Mean | SD | Min. | Max. | Chi square* | p-value |
|---|
| Tm | Sectioning | CD-CP | 15 | 4.33 | 0.488 | 4 | 5 | 47.765 | <0.001 |
| CD-MP | 15 | 1.60 | 0.632 | 1 | 3 |
| MD-CP | 15 | 3.80 | 0.676 | 3 | 5 |
| MD-MP | 15 | 1.40 | 0.507 | 1 | 2 |
| Staining | CD-CP | 15 | 4.33 | 0.724 | 3 | 5 | 43.268 | <0.001 |
| CD-MP | 15 | 1.93 | 0.594 | 1 | 3 |
| MD-CP | 15 | 3.20 | 0.676 | 2 | 4 |
| MD-MP | 15 | 1.53 | 0.743 | 1 | 3 |
| Pulp | CD-CP | 15 | 4.33 | 0.617 | 3 | 5 | 36.762 | <0.001 |
| CD-MP | 15 | 1.87 | 0.743 | 1 | 3 |
| MD-CP | 15 | 2.40 | 0.828 | 1 | 4 |
| MD-MP | 15 | 1.60 | 0.737 | 1 | 3 |
| Dentin | CD-CP | 15 | 4.33 | 0.488 | 4 | 5 | 38.583 | <0.001 |
| CD-MP | 15 | 2.20 | 0.676 | 1 | 3 |
| MD-CP | 15 | 2.40 | 0.91 | 1 | 4 |
| MD-MP | 15 | 1.53 | 0.64 | 1 | 3 |
| Cementum | CD-CP | 15 | 4.47 | 0.64 | 3 | 5 | 39.372 | <0.001 |
| CD-MP | 15 | 2.00 | 0.655 | 1 | 3 |
| MD-CP | 15 | 2.27 | 0.961 | 1 | 4 |
| MD-MP | 15 | 1.33 | 0.488 | 1 | 2 |
The difference in the quality of the molar tooth specimens between individual techniques- Mann-Whitney U test.
| | | CD-MP | MD-CP | MD-MP |
|---|
| | Group | Mann-Whitney U | p-value | Mann-Whitney U | p-value | Mann-Whitney U | p-value |
|---|
| Tm | Sectioning | CD-CP | 0.000 | <0.001 | 65.000 | 0.025 | 0.000 | <0.001 |
| CD-MP | - | - | 2.500 | <0.001 | 94.500 | 0.394 |
| MD-CP | - | - | - | - | 0.000 | <0.001 |
| Staining | CD-CP | 2.000 | <0.001 | 33.000 | 0.001 | 2.000 | <0.001 |
| CD-MP | - | - | 22.000 | <0.001 | 73.500 | 0.076 |
| MD-CP | - | - | - | - | 16.000 | <0.001 |
| Pulp | CD-CP | 1.500 | <0.001 | 11.500 | <0.001 | 1.000 | <0.001 |
| CD-MP | - | - | 75.500 | 0.093 | 89.500 | 0.301 |
| MD-CP | - | - | - | - | 54.500 | 0.010 |
| Dentin | CD-CP | 0.000 | <0.001 | 10.000 | <0.001 | 0.000 | <0.001 |
| CD-MP | - | - | 101.000 | 0.604 | 56.500 | 0.012 |
| MD-CP | - | - | - | - | 52.000 | 0.007 |
| Cementum | CD-CP | 1.500 | <0.001 | 9.500 | 0.001 | 0.000 | <0.001 |
| CD-MP | - | - | 97.500 | 0.495 | 52.500 | 0.006 |
| MD-CP | - | - | - | - | 47.500 | 0.004 |
Discussion
In contrast to soft tissue specimens, hard tissue specimens have to be decalcified prior to processing and staining. The time consumed in decalcification has been a significant hurdle in the early diagnosis and treatment of malignant lesions of gnathic bones. Decalcification time depends on various factors like temperature, pH and the concentration of the decalcifying agent, size and density of the specimen to be decalcified [1].
The most commonly employed decalcifying agents include: nitric acid, formic acid and Ethylene Diamine Tetra-acetic Acid (EDTA). Among these nitric acid (5-10%) is known to be relatively more corrosive to the tissues resulting in gross damage to the organic components of the specimen. Formic acid is a reasonable replacement for nitric acid in which the specimen’s organic components are less likely to be degraded. But the later may fall short in its inability to produce results at a faster rate. Increasing the concentration of the decalcifying agent should decrease the decalcifying time [1]. Agents such as nitric acid, if used beyond a certain concentration (>10%) will result in significant tissue damage [1]. Thus, a balance has to be achieved between the time taken for decalcification and the quality of the final specimen. Depending on the depth of investigation necessary, the pathologist must select the agent of choice and customize the concentration of the decalcifying agent. Other factors including temperature have proven to have significant effect on the decalcification time and the final quality of tissue sections. Increasing the temperature of the decalcifying/processing/staining agent will increase the rate of penetration of the agent into the specimen [1].
The major drawback of increasing the temperature is uneven heating resulting in patchy decalcification leading to a gross reduction in tissue quality. Microwave produces uniform increase in temperature throughout the specimen. Thus, microwave decalci-fication, processing and staining could hasten the diagnostic time without compromising the diagnostic quality of the tissue [2–5]. The temperature and the time duration of MD has been customized according to the type of microwave employed. A normal household microwave has been employed in several studies where the temperature was fluctuant (as the microwave had only voltage setting, there was no temperature control). In such cases several cycles of short microwave exposure (8-10 seconds) have shown optimal results [5]. The MD protocol employed in the present study is based on a modification of Sangeetha et al., [5] protocol as elaborated in methodology. Following CD/MD, the specimen was subjected to MP/CP and staining as per the protocol adapted by Mahesh Babu et al., [3].
The results were interpreted based on two major criteria. The first was the time taken for decalcification, processing and staining. The second was the diagnostic quality of the tissue sample. As mentioned earlier, microwave hastens the diffusion of the decalcifying, processing and staining agents into the tissue specimens; thus, hastening the overall process. The major draw-back of using microwave is the reduction in quality of the specimen as the temperature rises. Beyond a threshold temperature, the microwave may cause severe damage rendering the tissue un-diagnostic. In the present study, microwave method reduced the decalcification time of both the bone and tooth specimens by half in comparison to CD. Thus, as per the first criteria i.e., decalcification time, microwave method showed a statistically significant advantage over conventional method. The results of the present study were in agreement with various other studies including that of Gruntz et al., Sangeetha et al., Roncaroli et al., Vongsavan et al., and Pitol et al., [4,5,8–10]. Further it was noted that the decalcification time increased as the specimen size increased (incisor to molar).
The MP and staining employed in the present study was a modified version of the protocol employed by Mahesh Babu et al., [3]. The total time taken for CP and staining, was approximately 7 hours 31 minutes in comparison to 2 hours 16 minutes using microwave. The present study is in accordance with several other studies including that of Amrutha et al., Mahesh Babu et al., Ralph et al., and Morales et al., [2,3,7,14] showing substantial reduction in the processing and staining time of soft tissue specimens using microwave.
The second factor in the present study was the quality of the specimens. Several parameters as illustrated in [Table/Fig-2,3] were employed to evaluate the hard tissue specimens. CD with CP and staining displayed utmost quality [Table/Fig-5,6,7 and 8]. MD with CP and staining retained the diagnostic features yet displayed a significant reduction in the overall tissue quality [Table/Fig-5,6,7 and 8]. This is in contrast to the results obtained by Gruntz et al., and Sangeetha et al., where in they observed that microwave decalcified tissue displayed a superior histopathological picture in comparison to the conventionally decalcified tissue [4,5]. CD with MP and staining and MD with MP and staining resulted in gross tissue damage [Table/Fig-5,6,7 and 8].
In the present study MP and staining showed a significant reduction in the procedural time but resulted in severe damage to the tissue. This is in contrast to the results obtained by Mahesh Babu et al., Boon and Kok et al., and Pritam et al., [3,15,16]. They noticed a significant increase in the quality of microwave processed soft tissue specimen. Mathai et al., Morales et al., Chaudari et al., Hopewood et al., and Leong et al., found no significant difference in the tissue quality between conventional and microwave processed soft tissue specimens [6,14,17–19]. The damage observed in MP of the hard tissue specimens could be due to the combined effect of the decalcification agent (acid) and the subsequent processing solutions (alcohol) in microwave. The soft tissue specimens used in Mahesh Babu et al., study were not subjected to any acidic solution which might predispose the tissue to disintegration on subsequent microwave based processing and staining [3]. This could be the reason why the soft tissues were more compatibile to MP than the decalcified hard tissue specimens.
Conclusion
To summarize, microwave significantly reduced the decalcification time for both the hard tissue specimens. Although, the quality of microwave decalcified tissue were inferior to those of conventional means, the tissues remained diagnostic. MP and staining also exhibited a significant reduction in the total time consumed, but resulted in severe tissue damage. Further, for hard tissue specimens, decalcification time proves to be the larger hurdle in early report delivery in comparison to the relatively insignificant processing time.
Thus, to conclude, MD followed by CP and staining could serve as an ideal method to reduce the decalcification time without compromising the diagnostic quality of the tissue. In the present study microwave method reduced the decalcification time by 50% in comparison to conventional method. Further studies on MD could employ a nitric acid concentration of less than 5% to improve the tissue quality.
CD-conventional decalcification; MD-microwave decalcification; CP-conventional processing and staining; MP-microwave processing and staining
Ti-Tooth incisor; Tp-Tooth premolar; Tm-Tooth molar; CD-conventional decalcification; MD-microwave decalcification; N-number of hours