Broadbent in 1931 introduced the cephalometry technique for studying dental malocclusions and skeletal discrepancies [1]. Conventional analysis is performed by manually tracing radiographic landmarks to measure the desired linear and angular values and hence may be prone to error and is time consuming. Hence, to avoid errors and make it less time consuming rapid advances in computers has led to the digitalization of cephalometric analysis [2]. The digital radiographic image is the image obtained from X-rays incidence and is displayed on the computer. There are two methods to obtain them called indirect and direct method. If the image is captured directly through a charged coupled device while eliminating the use of radiographic film and darkroom is a direct method whereas in the indirect method, also called hybrid system, a conventional radiograph is obtained by a video camera or scanner and is digitalized in a computer through a software program [3]. Such applications may substantially eliminate the need for hard copies of cephalometric films. Benefits of such applications include ease of processing, no hard copies, no scanning procedure, faster method of analysis and reduction in radiation exposure [4].
Many studies have investigated the reproducibility of hand-tracing versus digitized cephalometry. Jackson et al., and Döler et al., stated that the results from the digital imaging system were comparable with those obtained with the manual tracing method [5,6]. On the contrary Macrì and Wenzel concluded that the reliability of landmark location on digital images were inferior to conventional film [7].
Various computer programs have been developed such as the Dentofacial Planner, the Dolphin Imaging and the Quick Ceph® and many studies have been done using these softwares to assess the reliability with the conclusion that they are statistically significant in some studies [8,9]. Another software called FACAD® (Ilexis AB, Linköping, Sweden) is also used in cephalometric analysis but in India the accuracy and the reproducibility of this program has been found in the literature.
The aim of this study was to compare the accuracy of cephalometry done using manual tracing and those of tracings made using the FACAD® program, and to evaluate the reproducibility and reliability of each method.
Materials and Methods
In the present cross-sectional comparative study, cephalometric radiographs of 50 patients of age group between 17-30 years irrespective of sex were selected from the Department of Orthodontics, MNR Dental College and Hospital, Sangareddy, Telangana, India. Good quality radiographs without any artefacts to avoid interfering with location of anatomical points, permanent dentition without any missing teeth, radiographs of patients with various sub types of class 1 malocclusions, no excess soft tissue and magnification of x1.25 were the criteria used for selection of radiographs. The study was conducted over a period of 6 months.
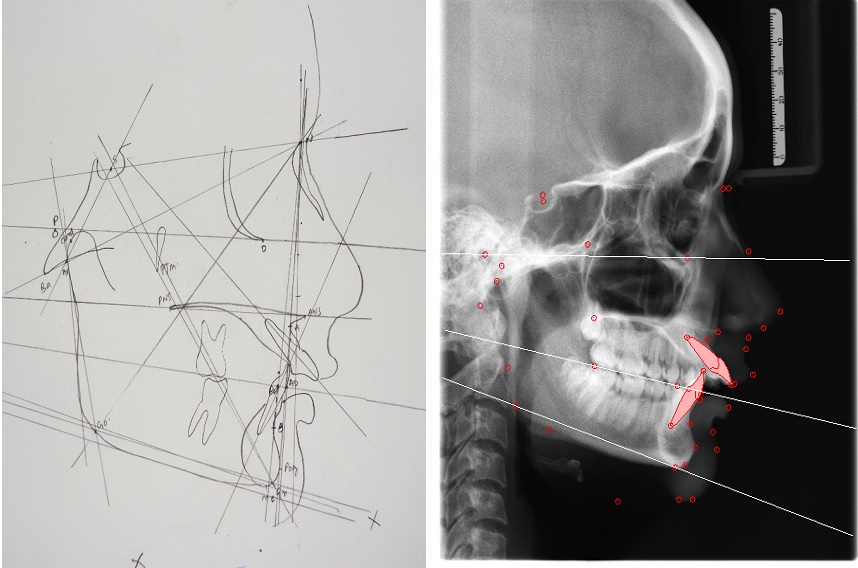
All the 50 lateral cephalometric radiographs were acquired using the digital cephalometer ORTHOPHOS XG (SIRONA). The digital images were stored in a computer database with the manufacturer’s software and imported to the FACAD 3.6 software program. Before digitization of the landmarks with FACAD 3.6, the films were calibrated by digitizing two points on the ruler within the digital cassette. Variables are automatically generated by the program once a set of landmarks has been digitized. For manual hand-tracing digital images were resized to 1:1 scale using Adobe Photoshop CS and printed on semi-gloss paper designed for high-quality photographic images using a 2400 dpi color laser printer (CARE STREAM 5700 LASER IMAGER) [Table/Fig-1] and tracings were performed on clear acetate placed over the printed images using a lead pencil. All hard and few soft tissue landmarks were traced, with bilateral structures averaged to make a single structure or landmark. A total of 27 anatomical landmarks were defined on each radiograph [Table/Fig-2], and 30 variables five analysis (Steiners, Witts, Tweeds, McNamara, Rakosi Jarabaks) were calculated.
Cephalometric landmark and measurement definitions used in the manual and digital cephalometric analyses.
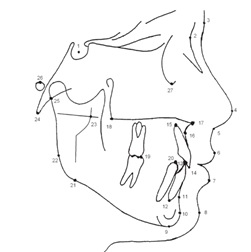
Location of the 27 landmarks used in the study: 1: Sella (S), 2: Nasion (N), 3: Glabella (G′), 4: Pronasale (Pr′), 5: Subnasale (Sn′), 6: LabrareSuperios. (Ls), 7: LabrareInferios. (Li), 8: Soft Pogonion (Pg′), 9: Menton (Me), 10: Pogonion (Pg), 11: Point B, 12: Lower incisor apex, 13: Lower incisor tip, 14: Upper incisor tip, 15: Upper incisor apex, 16: Point A, 17: Anterior nasal spine (ANS), 18: Posterior nasal spine (PNS), 19: Lower molar crown, 20: Lower first premolar tip, 21: Inferior gonion, 22: Posterior gonion, 23: Ad 124: Basion (Ba), 25: Articulare (Ar), 26: Porion (Po), 27: Orbitale
Statistical Analysis
For statistical evaluation of the principal data, differences in measurements between the two groups (manual and digital) were evaluated using analysis Independent t-test. No differentiations were made for age or gender. A level of p < 0.05 was considered to be significant.
Results
Correlation coefficients were found to be high for all parameters, with the exception of 1-NA, interincisal angle, y axis angle which are higher in manual tracing and facial axis angle have higher value in digital tracing [Table/Fig-3]. In Steiner’s analysis no statistically significant differences was found except in U1-NA angle (2.1) and interincisal angle where the values are higher in manual tracing compared to digital [Table/Fig-4]. In Wits analysis, correlation coefficients were found to be high for all parameters [Table/Fig-5]. In Tweeds analysis, manual and computerized tracing are almost similar [Table/Fig-6] along with McNamara analysis where in most values are similar except facial axis angle is higher in computerized tracing comparative to manual tracing [Table/Fig-7]. Similarly, in RakosiJarabaks analysis the Y axis values are much higher in manual tracings than digital tracing while all the values have higher correlation [Table/Fig-8].
Comparison of results of the tests between manual and digital tracings.
| Analysis | Results |
|---|
| Steiners’analysis | High correlation between manual and digital tracing Exception: Higher values in 1-NA angle and interincisal angle in manual tracing |
| Wits appraisal analysis | High correlation between manual and digital tracing |
| Tweed’s analysis | High correlation between manual and digital tracing |
| McNamara’s analysis | High correlation between manual and digital tracing Exception: Facial axis angle is higher in digital tracing |
| RakosiJarabak’s analysis | High correlation between manual and digital tracing Exception: Y axis have higher value in manual tracing |
Descriptive statistics using t-test for digital tracing and hand-tracing methods in Steiner’s Analysis.
| Group | N | Mean | Std. Deviation | Std. Error Mean | p-value |
|---|
| SNA | Manual | 22 | 82.14 | 3.106 | .662 | 0.792 |
| Computer | 22 | 81.86 | 3.803 | .811 |
| SNB | Manual | 22 | 77.52 | 3.157 | .673 | 0.748 |
| Computer | 22 | 77.23 | 2.901 | .618 |
| ANB | Manual | 22 | 4.23 | 2.759 | .588 | 0.545 |
| Computer | 22 | 4.68 | 2.082 | .444 |
| Go Gn to SN | Manual | 22 | 30.64 | 5.687 | 1.212 | 0.804 |
| Computer | 22 | 31.11 | 6.956 | 1.483 |
| 1 to N-A (mm) | Manual | 22 | 10.00 | 3.436 | .733 | 0.129 |
| Computer | 22 | 8.65 | 2.196 | .468 |
| 1 to N-A (angle) | Manual | 22 | 36.23 | 10.628 | 2.266 | 0.593 |
| Computer | 22 | 34.71 | 7.776 | 1.658 |
| T to N-B (mm) | Manual | 22 | 7.91 | 3.490 | .744 | 0.235 |
| Computer | 22 | 6.74 | 2.919 | .622 |
| 1 to N-B (angle) | Manual | 22 | 30.09 | 6.339 | 1.351 | 0.871 |
| Computer | 22 | 30.38 | 5.285 | 1.127 |
| 1 to 1 (angle) | Manual | 22 | 109.55 | 9.699 | 2.068 | 0.712 |
| Computer | 22 | 108.49 | 9.145 | 1.950 |
Descriptive statistics using t-test for digital tracing and hand-tracing methods in Wits appraisal Analysis.
| Group | N | Mean | Std. Deviation | Std. Error Mean | p-value |
|---|
| Wits Appraisal | Manual | 22 | 4.27 | 2.640 | .563 | 0.119 |
| Computer | 22 | 3.07 | 2.373 | .506 |
Descriptive statistics using t-test for digital tracing and hand-tracing methods in Tweed’s Analysis.
| Group | N | Mean | Std. Deviation | Std. Error Mean | p-value |
|---|
| FMA | Manual | 22 | 25.41 | 6.284 | 1.340 | 0.818 |
| Computer | 22 | 25.83 | 5.819 | 1.241 |
| FMIA | Manual | 22 | 54.73 | 7.735 | 1.649 | 0.698 |
| Computer | 22 | 53.93 | 5.677 | 1.210 |
| IMPA | Manual | 22 | 98.91 | 6.531 | 1.392 | 0.449 |
| Computer | 22 | 100.24 | 4.926 | 1.050 |
Descriptive statistics using t-test for digital tracing and hand-tracing methods in McNamara’s Analysis.
| Group | N | Mean | Std. Deviation | Std. Error Mean | p-value |
|---|
| N Perpendicularto Point A | Manual | 22 | 1.45 | 3.912 | .834 | 0.033 (S) |
| Computer | 22 | -.83 | 2.869 | .612 |
| N Perpendicularto Pogonion | Manual | 22 | -4.82 | 8.534 | 1.819 | 0.169 |
| Computer | 22 | -7.76 | 4.949 | 1.055 |
| Facial Axis Angle | Manual | 22 | -1.18 | 5.754 | 1.227 | 0.046 |
| Computer | 22 | 13.11 | 32.058 | 6.835 |
| Mand.Plane angle | Manual | 22 | 26.32 | 6.679 | 1.424 | 0.745 |
| Computer | 22 | 25.70 | 5.833 | 1.243 |
| Eff.Max Length | Manual | 22 | 89.05 | 19.335 | 4.122 | 0.632 |
| Computer | 22 | 86.96 | 6.203 | 1.322 |
| Eff.Mand.Length | Manual | 22 | 117.32 | 7.779 | 1.658 | 0.000 (HS) |
| Computer | 22 | 103.59 | 9.623 | 2.052 |
| Maxillomandibular Differential | Manual | 22 | 23.09 | 6.324 | 1.348 | 0.054 |
| Computer | 22 | 19.82 | 4.472 | .953 |
| Lower ant face height | Manual | 22 | 67.95 | 7.537 | 1.607 | 0.003 (HS) |
| Computer | 22 | 61.86 | 4.833 | 1.030 |
| 1 to point A distance | Manual | 22 | 10.09 | 3.407 | .726 | 0.100 |
| Computer | 22 | 8.64 | 2.173 | .463 |
| 1 to Apo Line Distance | Manual | 22 | 6.64 | 4.953 | 1.056 | 0.932 |
| Computer | 22 | 6.74 | 2.919 | .622 |
| Naso Labial angle | Manual | 22 | 126.64 | 5.206 | 1.110 | 0.341 |
| Computer | 22 | 128.14 | 5.120 | 1.092 |
Descriptive statistics using t-test for digital tracing and hand-tracing methods in RakosiJarabak’s Analysis.
| Group | N | Mean | Std. Deviation | Std. Error Mean | p-value |
|---|
| Saddle angle | Manual | 22 | 137.95 | 10.139 | 2.162 | 0.857 |
| Computer | 22 | 137.50 | 6.022 | 1.284 |
| Articular angle | Manual | 22 | 126.32 | 7.174 | 1.529 | 0.688 |
| Computer | 22 | 127.11 | 5.823 | 1.241 |
| Gonial angle | Manual | 22 | 53.41 | 5.535 | 1.180 | 0.168 |
| Computer | 22 | 55.44 | 3.952 | .843 |
| U/Gonial angle | Manual | 22 | 73.18 | 8.353 | 1.781 | 0.421 |
| Computer | 22 | 71.47 | 5.291 | 1.128 |
| L/Gonial angle | Manual | 22 | 390.82 | 12.097 | 2.579 | 0.495 |
| Computer | 22 | 392.86 | 6.930 | 1.478 |
| Sum of Posterior angles | Manual | 22 | 29.86 | 6.089 | 1.298 | 0.529 |
| Computer | 22 | 31.11 | 6.956 | 1.483 |
| Angle of Inclination | Manual | 22 | 89.91 | 3.322 | .708 | 0.000 (HS) |
| Computer | 22 | 85.77 | 3.590 | .765 |
| Basal Plane angle | Manual | 22 | 25.64 | 6.701 | 1.429 | 0.000 (HS) |
| Computer | 22 | 8.55 | 3.771 | .804 |
| Palatal Plane to MP | Manual | 22 | 29.05 | 3.415 | .728 | 0.000 (HS) |
| Computer | 22 | 15.48 | 5.171 | 1.103 |
| Antr.to postr. face ht Ratio | Manual | 22 | 66.600 | 4.2329 | .9024 | 0.377 |
| Computer | 22 | 65.177 | 6.1558 | 1.3124 |
| Y-Axis | Manual | 22 | 73.55 | 11.143 | 2.376 | 0.021 (S) |
| Computer | 22 | 67.56 | 3.672 | .783 |
| Interincisal angle | Manual | 22 | 108.77 | 9.621 | 2.051 | 0.943 |
| Computer | 22 | 108.55 | 10.383 | 2.214 |
Discussion
The accuracy of cephalometric analysis is important in the diagnosis of malocclusion and for treatment planning. Rapid advances in computer technology have led to increasing use of digital systems in cephalometry. The most important criteria for using mechanical or digital method are that it should be accurate, precise and must show a high rate of reproducibility in both tracing and analysis [10]. The focus of interest in this study was therefore to compare the accuracy of lateral cephalograms traced manually and with the FACAD® program.
Landmark identification is as important as the tracing method itself because interoperator error has in general been found to be greater than intraoperator error as indicated by Sayinsu et al., [11]. To avoid such errors measurements were carried out by one examiner only.
The cephalometric radiographs in this study were randomly selected. The variables used in this study were commonly used cephalometric variables for orthodontic diagnosis, treatment planning and evaluation of treatment results. Steiner’s, Wit’s, Tweed’s, McNamara, Rakosi, Jarabaks analysis is commonly used for orthognathic surgical planning, hard tissue, dental variables, and soft tissue variables.
In the present study, correlation coefficients were found to be high for all parameters with no statistically significant differences were found except in U1-NA angle (2.1) and interincisal angle where the values are higher in manual tracing compared to digital in Steiner’s analysis. Similarly, Wit’s appraisal analysis correlation coefficients were found to be high for all parameter. In Tweed’s analysis both manual and computerized tracing are almost similar. However, in McNamara analysis facial axis angle is higher in computerized tracing comparative to manual tracing but other values are almost similar. In Rakosijarabaks analysis, Y axis values are much higher in manual tracings than digital tracing with other values remaining same.
The present study assessed the reliability and reproducibility of cephalometric measurements using a computerized program on direct digital radiographs with those with hand tracing method which are in accordance with the studies of Gerbo et al., Turner and Weerakone, Santoro et al., [12–14].
Grybauskas et al., stated that measurements obtained from digital tracing and manual tracing were shown to have adequate reproducibility [15]. These findings coincide with the present study result. However Collins et al., compared the digital and manual tracing cephalometry which gave a statistically significant differences between measurement which are not in accordance with our study results [16].
In this study, the analysis of the results obtained comparing the cephalometric measurements in digital and manual tracings revealed values that were close to the means and standard deviations supporting those of Chen et al., Correia et al., and Vasconcelos et al., results [17–19].
According to AlBarakati et al., both methods of conventional and digital cephalometric analysis are highly reliable with some statistically significant differences in reproducibility but most were not clinically significant [20]. Similarly Prabhakar et al., provides support for computerized tracing method as these are easier and less time consuming with same reliability [21]. In a recent study conducted by Hardik et al., concluded that digital tracing with FACAD software is similar to manual cephalometric tracings and sufficient for clinical purposes [22].
However, this study has few drawbacks, as in the present study there was a slight difficulty in identifying some anatomical structures differently when projected on screen, even if they could be repeated consistently in each method and also this FACAD software is expensive compared to other cephalometric analysis software.
Despite few limitations and low correlation for some measurements between the FACAD software tracing and manual methods, most of the commonly used measurements were accurate. This study indicates that the digital method is reliable; validating most studies [Table/Fig-9] that have compared different cephalometric tracing methods [12–22]. In recent times digitizing X-rays has become the preferred method for cephalometric analysis as it is more user friendly and time saving. Further studies will help in assessing the digitalized cephalometric analysis in predictive tracings for orthognathic surgery and profile manipulation along with the options of 3 dimensions program.
Table depicting the previous studies done to compare the reliability, accuracy and reproducibility of digitalized and manual cephalometric analysis [12–22].
| Authors name | Result of the studies |
|---|
| Gerbo et al., [12] | Assessed the reliability of digitalized and manual tracing method |
| Turner and Weerakone [13] | Similar result as the present study |
| Santoro et al., [14] | Manual and cephalometric analysis have no significant differences |
| Grybauskaset al., [15] | Adequate reproducibility of measurements of both manual and digital tracings |
| Collins et al., [16] | Statistical significant differences between the measurements of the two methods used |
| Chen et al., [17] | Reproducibility and reliability of both the methods |
| Correiaet al., [18] | Similar values of the measurements in both manual and digital methods |
| Vasconceloset al., [19] | Digital and manual tracings revealed values were close to the means and standard deviations |
| AlBarakatiet al., [20] | Highly reliable |
| Prabhakaret al., [21] | Provides support for computerized tracing method as these are easier and less time consuming |
| Hardiket al., [22] | Stated that digital tracing with FACAD software is similar to manual cephalometric tracings |
Conclusion
The reliability and reproducibility of the measurements with the FACAD® and with the conventional method are highly correlated. The advantages of digital imaging such as enhancement, transmission, archiving and low radiation dosages makes the digitized method to be preferred over conventional method in daily use without the loss of quality.