Breast cancer is the most common cancer in women in both developed and developing countries [1]. Since, the prognosis of the breast cancer depends on the stage of presentation, it is extremely important to detect them early. It is also of paramount importance to characterize these lesions for further management. Hence, a diagnostic test which is both sensitive and specific is required for the proper management of breast lesions. At present, conventional mammogram and ultrasound are the modalities used to detect and characterize breast lesions. Due to limited specificity of these diagnostic modalities [2] invasive procedures like FNAC and biopsies are being increasingly used to differentiate benign from malignant lesions. There are many studies that have shown higher sensitivity and specificity for MR mammogram in this regard [3–5]. However, few studies have also shown less specificity for MR mammogram in differentiating benign from malignant breast lesions [6,7]. This differentiation is important because if a lesion is undoubtedly found to be benign in Magnetic Resonance (MR) mammogram, the lesion can be followed up thus reducing the need for invasive procedures. Hence, we decided to study the exact role of MR mammography in differentiating benign from malignant breast masses in one of the tertiary care centre in Pondicherry, India.
Materials and Methods
Subjects
This was a prospective study which was done in the Department of Radiology, JIPMER (Jawaharlal Institute of Post graduate Medical Education and Research) wherein patients between the age group of 18 to 65 years with palpable suspicious breast lesions based on conventional imaging (Ultrasound and Mammography) were included in the study. The study was approved by the ethical committee and all patients gave informed consent to participate in the study. This study was done between January 2010 to January 2011. Patients who were claustrophobic, having known contraindication to MRI namely cochlear implants, pacemakers, etc., and patients with breast lesions that were definitely benign either clinically or by conventional imaging were excluded from the study. Overall 36 patients were enrolled and they underwent gadolinium enhanced MR Mammography.
MR Mammography Imaging Technique
All breast images were obtained with 1.5 Tesla MRI device (Magnetom Avanto- seimens, Erlangen, Germany) with the use of dedicated breast coil. Before MR imaging, an antecubital intravenous access was obtained. The patient was then placed in the prone position with the breasts hanging in a double breast coil at the isocentre of the magnet. Images started with the acquisition of scout images in all the three planes. Then T2 weighted turbo spin echo fat saturated sequence and T1 weighted 3D FLASH (fast low angle shot) saturated sequence were obtained before administration of contrast. This was followed by standard axial T1 weighted 3D FLASH fat saturated dynamic sequence. This sequence was repeated sequentially before and five times after a bolus of gadolinium over a period of five minutes so that the rate and duration of enhancement could be assessed. Subtraction post processing was used to improve the detection of contrast enhancing lesions.
The precontrast T1W 3D FLASH non-fat saturated sequence was acquired with repetition time msec/echotime sec- 8/4.1, flip angle 30 degree, matrix 320X320, field of view 340X340 and slice thickness of 1mm. The precontrast T2 weighted fat saturated sequence was acquired with repetition time msec/echotime sec -6000/110, flip angle 30 degrees, matrix 256X256, field of view 400X400mm and slice thickness of 4mm. The 3D FLASH fat saturated dynamic sequence was acquired with repetition time msec/echotime sec- 4/2, flip angle 12degree, matrix of 448X 448, field of view 340X340 and slice thickness of 1mm.
Post-contrast image was obtained after administration of 0.1mmol/Kg body weight of Gadobenate dimeglumine (Multihance) injected with the help of automatic injector at the rate of 2ml/sec.
Image Analysis
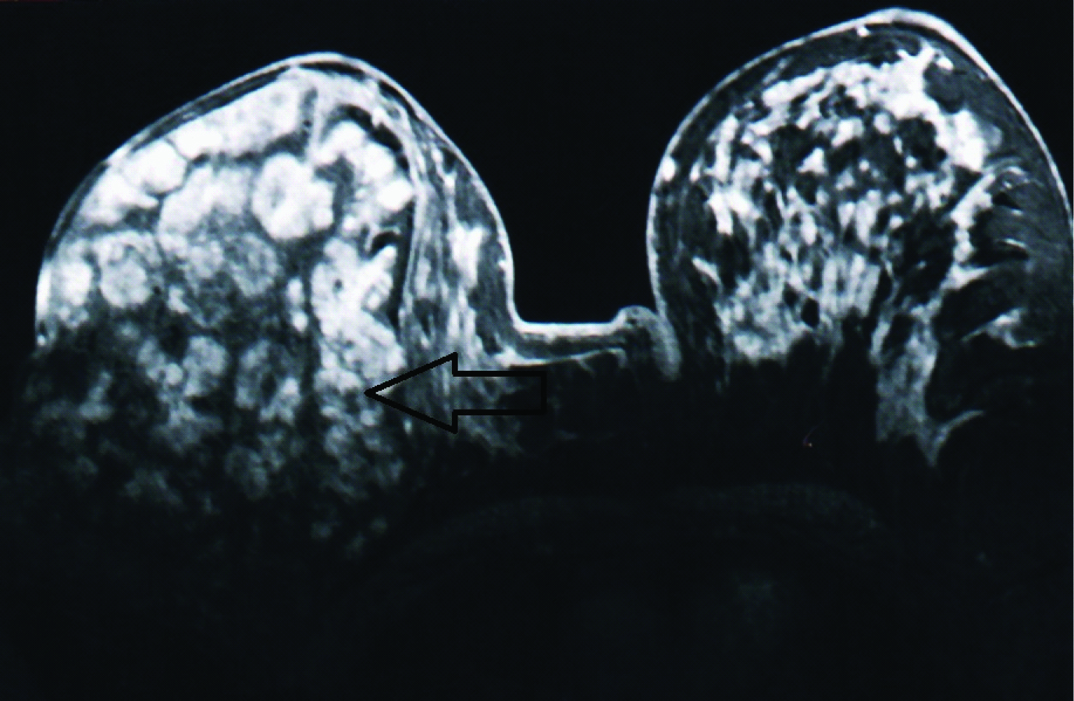
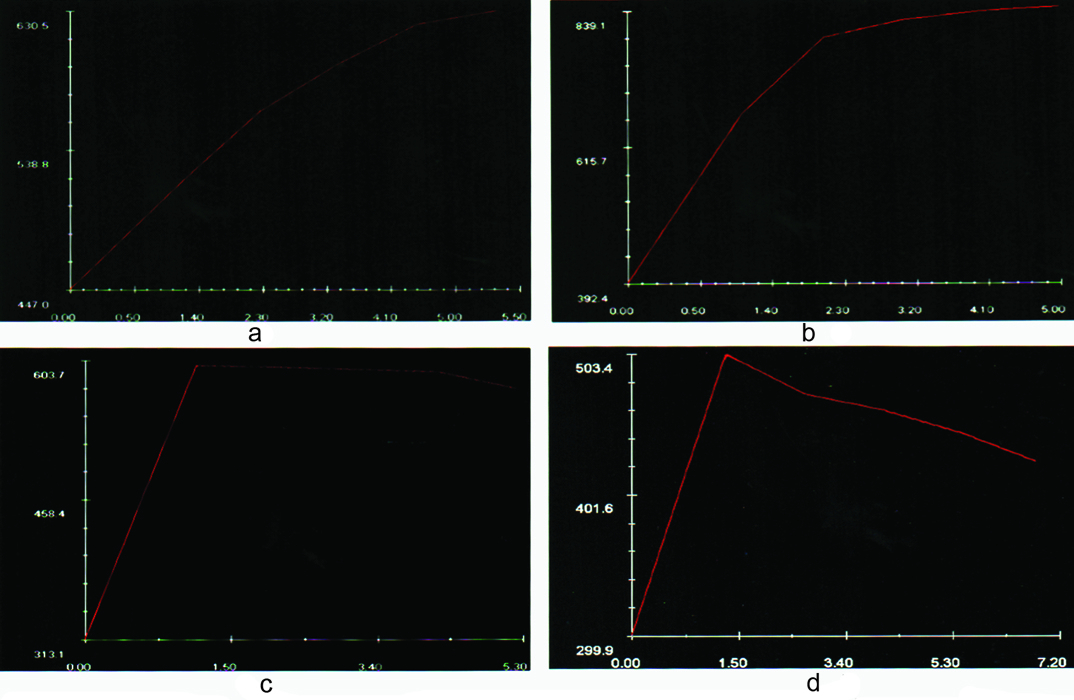
In MR mammography, margins and shape of the enhancement curve were analysed (sample cases shown in [Table/Fig-1,2]). Once the lesion was identified, region of interest was drawn in the most rapidly enhancing portion and time-signal intensity curve was obtained (Sample enhancement curves shown in [Table/Fig-3]). Based on the time signal intensity, the curves were classified into type Ia (slow sustained enhancement), type Ib (rapid initial and sustained late enhancement), type II (rapid initial and stable late enhancement), type III (rapid initial and decreasing late enhancement) [8]. The margins of the lesions were classified as smooth, irregular or spiculated. The final diagnosis of the lesions was determined by subsequent histopathological reports. (FNAC/Biopsy/Mastectomy specimen)
Post contrast image (T1, FLASH 3D) showing a large smooth lesion with non enhancing internal septations occupying almost the entire right breast. The pathological diagnosis was classical phylloides tumour.
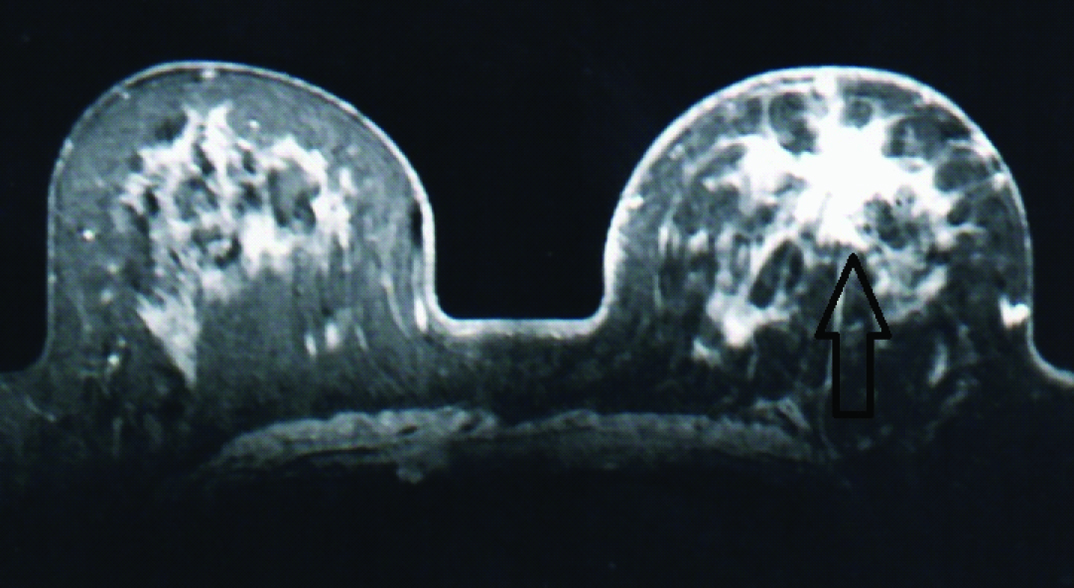
Post contrast image from dynamic series (T1 FLASH 3D) showing a spiculated enhancing lesion in the left breast. The pathological diagnosis was infiltrating ductal carcinoma.
Pictures shows examples of type Ia (A), type Ib (B), type II (C), and type III (D), enhancement curves seen in our study.
Statistical Analysis
The sensitivity, specificity, positive predictive value and negative predictive values of MR Mammography based on enhancement kinetics or margins were calculated independently using histopathological diagnosis as the standard of reference. The sensitivity and specificity values based on the margins of the lesion and type of enhancement curves were compared using Mc Nemar X 2 test. The chi-square test was used to demonstrate statistical difference in the distribution of curve types in benign and malignant lesions. All tests of significance were carried out at 95% confidence interval and p-value of <0.05 was considered as statistically significant. Graphpad in stat (version 3.10) was used for statistical analysis.
Results
All the 36 study subjects underwent MR Mammography in which three patients lost follow-up. In the remaining 33 patients 35 lesions were found. Out of these 35 lesions the type of enhancement curve for 3 lesions could not be determined as the patients with these three lesions were uncomfortable after the contrast injection and could not lie down for a prolonged period to undergo the remaining MRI sequences. The margins of the lesions were determined for all the 35 lesions [Table/Fig-4]. The final diagnosis was confirmed by the subsequent Histopathological Examination (HPE) report. Based on the HPE there were 22 invasive carcinomas (Infiltrating ductal) and the remaining 13 were benign lesions which includes, Phylloides (3), fibroadenomas (4) and benign proliferative breast diseases (6). The sensitivity, specificity, positive predictive value, negative predictive value of MR mammography in differentiating benign from malignant lesions based on margins of the lesion were 95.45%, 84.62%, 91.3%, 91.67% respectively and based on the type of enhancement curve was 76.2%, 90.9%, 94.1%,66.67%, respectively.
Shows characterization of margins of the lesions based on MRI in HPE proven malignant and benign breast masses.
| Margins of Lesion based on MRI | Number of Malignant Lesions by HPE | Number of Benign Lesions by HPE | Total |
|---|
| Irregular/ Spiculated | 21 | 2 | 23 |
| Smooth | 1 | 11 | 12 |
| Total | 22 | 13 | 35 |
In benign solid and fibrocystic lesions, the predominant signal intensity curve was type Ia/b which was seen in 90.9% (10 of 11) of the benign lesions. Type II curve was seen in 9.1% (1 of 11) of benign lesions and type III curve was not seen in any of the benign lesions [Table/Fig-5]. In malignant lesions, Type III was seen in 23.9% (5 of 21) while type II was seen in 52.4% (11 of 21) of the lesions. Type Ia/b curve was seen in 23.9% (5 of 21) of the malignant lesions. The chi square test demonstrated a statistically significant difference in the distribution of curve types in benign and malignant lesions (X2 =10.5, p=0.001). Five malignant lesions which showed benign type of enhancement curve were found to have irregular margins. Only one malignant lesion had smooth margins but showed malignant type of enhancement curve. Two benign lesions were found to have irregular margins out of which one showed malignant type of enhancement curve whereas the other lesion showed benign type of enhancement curve.
Shows the type of enhancement curve based on MRI in HPE proven malignant and benign breast masses.
| Type of Enhancement Curve based on MRI | Number of Malignant Lesions by HPE | Number of Benign Lesions by HPE | Total |
|---|
| Malignant type of curve Type II & III | 16 | 1 | 17 |
| Benign type of curve Type Ia/Ib | 5 | 10 | 15 |
| Total | 21 | 11 | 32 |
Hence, from our study we found that the sensitivity and negative predictive value were higher for the margins of the lesions than when compared to the type of enhancement curve whereas, the specificity and positive predictive value was higher for the type of enhancement curve. The Mc Nemar X2 test comparing sensitivity between morphological analysis and the type of enhancement curve showed statistical significance (X2 =14.9, p-value=0.001) whereas comparing specificity between morphological analysis and the type of enhancement curve showed no statistical significance (X2=0.00, p-value=1.00). The PPV was more for the type of enhancement curve in differentiating benign from malignant lesions; however this was not statistically significant, while the NPV was more for the type of the margin and was statistically significant.
Discussion
MR mammography is increasingly used now in addition to conventional modalities such as mammogram and ultrasound for evaluation of breast lesions [9]. MR mammogram can be used for varied purposes such as, screening dense breasts especially in young women with history of breast cancer, evaluation of the breast with implants, characterize indeterminate breast lesions, diagnose recurrent breast cancer and in staging of local breast cancer [10,11]. In our study we tried to evaluate the role of MRI in characterizing suspicious breast masses diagnosed clinically or by other imaging modalities (ultrasound, mammogram). Earlier studies have reported that MR mammogram had a sensitivity ranging from 85-100% and specificity ranging from 50-85% in differentiating benign and malignant breast lesions [3–5].
Morphological characteristics of the lesion and the dynamic enhancement characteristics of the lesions were used by most of the researchers in evaluating the breast lesions using MR Mammography and based on these different patterns, the breast lesions were considered either benign or malignant [8,12]. The enhancement pattern of benign and malignant lesions varies significantly due to the neo-angiogenesis associated with malignant lesions. However, certain benign tumours show enhancement similar to malignant lesions thereby decreasing the specificity [13]. Hence, there is a concern regarding the diagnostic value of signal intensity curve data.
In our study, we found that the dynamic enhancement time signal intensity curves vary significantly among benign and malignant lesions. Most malignant breast lesions showed Type 2/3 enhancement curve whereas most benign lesions showed type 1a/1b curve. Type 3 curve was seen in all the breast malignant lesions in our study. The sensitivity based on time signal intensity curve is lower in our study when compared with the previous studies [3–5,8]. This may be due to the fact that many malignant lesions in our study had necrotic areas within it. The specificity based on time signal intensity curve is higher in our study when compared with other studies [3–5,8]. This may be due to the improved temporal resolution of the sequences used in our study.
Several studies have reported the efficacy of the morphology of a lesion in characterizing the breast lesion. Studies by Nunes et al., have shown that 97-100 % of lesions having smooth margins were benign [12,14]. In our study we found that 91.6% of masses with smooth margins to be benign. Previous studies [12,14,15] have shown that irregular mass and a mass with spiculated margin are associated with a high positive predictive value (95-100%) for malignancy. In our study, we found that 91.3% of masses with irregular margins were found to be malignant. Nunes et al., also found that none of the malignant lesions had smooth borders [12], however in our study, one patient (4.5%) with malignant lesion had a smooth border. Non-enhancing septations within a lesion can no longer be assigned to describe benign lesions since the results of a study done by Schnall et al., revealed that 47% of malignant lesions were shown to have non-enhancing septations [15]. In our study, only one lesion had non enhancing septations and it turned out to be a benign type of phyllodes.
We found that the analysis of margins of the lesion had higher sensitivity when compared with the type of enhancement curve. The analysis of type of enhancement curve had higher specificity and diagnostic accuracy when compared with analysis of margins of the lesion but doesn’t show any statistical significance. So analysis of the type of enhancement curve can be done after determining the margins of the lesion. If the margins suggest a benign lesion, then a time signal intensity curve analysis can be performed. If a wash out type of curve is obtained in a benign appearing lesion, biopsy can be performed. If the margins and the type of enhancement curve suggest benignity, the lesion can be followed up, thus avoiding the need for biopsy. If margins suggest a malignant lesion, then directly biopsy can be done without further imaging studies. These observations from our study are similar to those obtained by Kuhl et al., [8].
Limitation
The limitations of our study are firstly the strict inclusion criteria of including only the suspicious breast lesions and leaving the classical benign lesions based on conventional imaging and secondly the small sample size.
Conclusion
MR mammography has a major role in the evaluation of suspicious breast lesions. The type of the margin (smooth vs irregular) had a very good sensitivity and NPV, while the pattern of enhancement curve (Type Ia/Ib vs Type II vs Type III) had a very good specificity and negative predictive value in differentiating benign from malignant breast lesions.