Quantification of DNA Extracted from Formalin Fixed Paraffin-Embeded Tissue Comparison of Three Techniques: Effect on PCR Efficiency
Dushyant Kumar1, Manoj Kumar Panigrahi2, Moushumi Suryavanshi3, Anurag Mehta4, Kandarpa Kumar Saikia5
1 Ph.D Scholar, Department of Bioengineering & Technology, Gauhati University, Assam, India.
2 Ph.D Scholar, Department of Bioengineering & Technology, Gauhati University, Assam, India.
3 Head, Centre for Molecular Diagnostic and Cell Biology, Rajiv Gandhi Cancer Institute and Research Centre, New Delhi, India.
4 Director Lab Services, Rajiv Gandhi Cancer Institute and Research Centre, New Delhi, India.
5 Assistant Professor, Department of Bioengineering & Technology, Gauhati University, Assam, India.
NAME, ADDRESS, E-MAIL ID OF THE CORRESPONDING AUTHOR: Dr. Dushyant Kumar, Rajiv Gandhi Cancer Institute & Research Centre, Delhi-110085, India.
E-mail: dushyant.leo@gmail.com
Introduction
Mutation detection from Formalin Fixed Paraffin-Embedding (FFPE) tissue in molecular lab became a necessary tool for defining potential targeted drug. Accurate quantification of DNA extracted from FFPE tissue is necessary for downstream applications like Polymerase Chain Reaction (PCR), sequencing etc.
Aim
To check and define which method for FFPE DNA quantification is suitable for downstream processes.
Materials and Methods
In this experimental experience study Biorad Smartspec Plus spectrophotomery, Qubit Fluorometer, and Qiagen Rotorgene qPCR was used to compare 20 FFPE DNA quantification in Rajiv Gandhi Cancer Institute and Research Centre, in 2015 and quantified amount of DNA used for PCR reaction.
Results
The average concentration of DNA extracted from FFPE tissue measured using the spectrophotometer was much higher than the concentration measured using the Qubit Fluorometer and qPCR.
Conclusion
Results varied depending upon the technique used. A fluorometric analysis may be more suitable for quantification of DNA samples extracted from FFPE tissue compared with spectrophotometric analysis. But qPCR is the best technique because it details DNA quantity along with quality of amplifiable DNA from FFPE tissue.
Fluorometer, qPCR, Sequencing, Spectrophotometer
Introduction
Formalin Fixed Paraffin Embeded (FFPE) tissues are commonly used in histopathology and immunohistochemistry (IHC) studies for clinical diagnosis. For FFPE storage tissue used are to be fixed in 4% neutral buffered formalin for 6-48 hour. Formaldehyde is used as fixation agent to preserve tissue samples for longer duration. Preservation of tissues with FFPE is the best method for archival of clinical samples [1]. These FFPE tissues are suitable for years of storage.
DNA extracted from paraffin-embedded tissues, a major potential source of tumour DNA, varies widely in quality [2]. Mutation analysis of FFPE-derived DNA assists diagnosis of most solid tumours. Tests like Epidermal Growth Factor Receptor (EGFR), Kristen Ras Gene (KRAS), Neuroblastoma Ras Gene (NRAS), Raf murine sarcoma viral oncogene homolog B (BRAF) mutation analysis and Next Generation Sequencing for significantly mutated genes hot spot detection using FFPE DNA have become key player for deciding particular cancer treatment. Use of EGFR tyrosine kinase inhibitor erlotinib as first-line treatment for NSCLC illustrates the potential for targeted drugs as alternatives to chemotherapy [3–5]. Retrospective Sanger sequencing of tumours from patients revealed activating EGFR mutations in exon 18, 19, 20, 21, making non small cell lung carcinoma (NSCLC) disease management very easy [6]. Similarly, vemurafenib and BRAF V600E have shaped workup of colorectal cancers and melanomas respectively [7–9].
Unfortunately, the FFPE process causes fragmentation and chemical modification in DNA, such as cross-linking between protein and DNA, deamination and adducts [10]. Such modifications result in loss of quality and number of amplifiable DNA templates and pose significant challenges to PCR sensitivity and specificity [11]. DNA quantitation may also impact PCR efficiency.
In light of these challenges, we need to have a well established quantitation method which can quantify FFPE DNA accurately. Assessment of DNA integrity and quantity remains a key challenge for high-throughput molecular techniques, including PCR, Real Time PCR, Sanger Sequencing, Next-generation sequencing [1].
Common methods used to quantify DNA include spectrophotometry, fluorometry and qPCR. Spectrophotometry is employed to measure the amount of light that a sample absorbs. The instrument operates by passing a beam of light through a sample and measuring the intensity of light reaching a detector and relies on light absorption by DNA at 260 nm [12]. Spectrophotometry has a disadvantage that it cannot differentiate DNA and RNA. Fluorometry on the other hand detects fluorescence from double-stranded DNA-specific dyes. Qubit fluorometer uses fluorescent dyes to determine the concentration of nucleic acids and proteins in a sample. Each dye is specific for one type of molecule: DNA, RNA or protein. These dyes have extremely low fluorescence until they bind to their targets (DNA, RNA or protein). Upon binding, they become intensely fluorescent. qPCR relies on quantitation from the cycle threshold associated with a template-specific probe. However, qPCR is the most expensive of these methods. Here we have compared the three methods for quantification of DNA extracted from FFPE tissue.
Materials and Methods
In this study, 20 FFPE random samples were received from July 2015 to December 2015 for different mutation analysis (EGFR, KRAS, NRAS, and BRAF) in Centre for Molecular Diagnostic and Cell Biology Lab in Rajiv Gandhi Cancer Institute and Research Centre, New Delhi, India. There were 13 EGFR, 4 KRAS & NRAS, and 3 BRAF mutation analysis samples (shown in [Table/Fig-1]). Extractions was perfomed using QIAGEN DNAeasy Kit (Qiagen; Hilden, Germany) from 3-5 sections each of 5-10μm in size from FFPE tissue in 1.5ml centrifuge tube as per the protocol given in the kit handbook. Briefly deparaffinization of FFPE tissue was done using 1ml xylene and spin at 10000rpm for 2minutes. The supernatant was discarded without disturbing the tissue pellet. Repeated the xylene step, once more, followed by 1ml absolute 96-100% ethanol step. Air dried the tissue pellet and added 200μl tissue lysis buffer given in the kit and 20μl protenase K. Incubated at 560C until the tissue lysed completely and followed the kit instruction for downsteam procedure.
DNA concentration comparison using qubit and spetrophotometer.
| Test Name | Samples | DNA Concentration in Qubit | DNA concentration in Spectro |
|---|
| EGFR | 1 | 0.1 | 3 |
| EGFR | 2 | 0.6 | 9 |
| EGFR | 3 | 0.5 | 5 |
| EGFR | 4 | 1 | 10 |
| EGFR | 5 | 2 | 60 |
| EGFR | 6 | 0.3 | 4 |
| EGFR | 7 | 0.52 | 26 |
| EGFR | 8 | 0.1 | 9 |
| EGFR | 9 | 0.1 | 21 |
| EGFR | 10 | 1.05 | 38 |
| EGFR | 11 | 0.6 | 18.5 |
| EGFR | 12 | 1.56 | 4.03 |
| EGFR | 13 | 0.5 | 9.5 |
| KRAS/NRAS | 14 | 1.3 | 11.2 |
| KRAS/NRAS | 15 | 2.8 | 29 |
| KRAS/NRAS | 16 | 1.9 | 17 |
| KRAS/NRAS | 17 | 3.1 | 21 |
| BRAF | 18 | 2.9 | 16 |
| BRAF | 19 | 5.2 | 68 |
| BRAF | 20 | 14 | 152 |
DNA quantification was determined by Biorad Smartspec Plus spectrophotomery, Qubit 3.0 fluorometer (Life technology, USA) and qPCR using 5μl DNA in duplicate. For Spectrophotometry reading we prepared 1:10 dilution of DNA sample with molecular grade water and analysed at 260nm. For Fluorometry, Qubit dsDNA HS Assay kit (Q32851) was used. We prepared qubit working solution by diluting the qubit reagent 1:200 in qubit buffer. We used 5μl of DNA for quantification.
For qPCR assay, we used Qiagen primer probe mix provided with EGFR therascreen kit, UK. 5μl of FFPE DNA was used to amplify with 19.5ul mastermix with 0.5μl Taq DNA Polymerase provided in the kit. Threshold Cycle (ct) value calculated as per the instruction given by EGFR therascreen kit, UK. For sample results with ct value greater than 32 we had rerun the procedure with increased amount of DNA.
Results
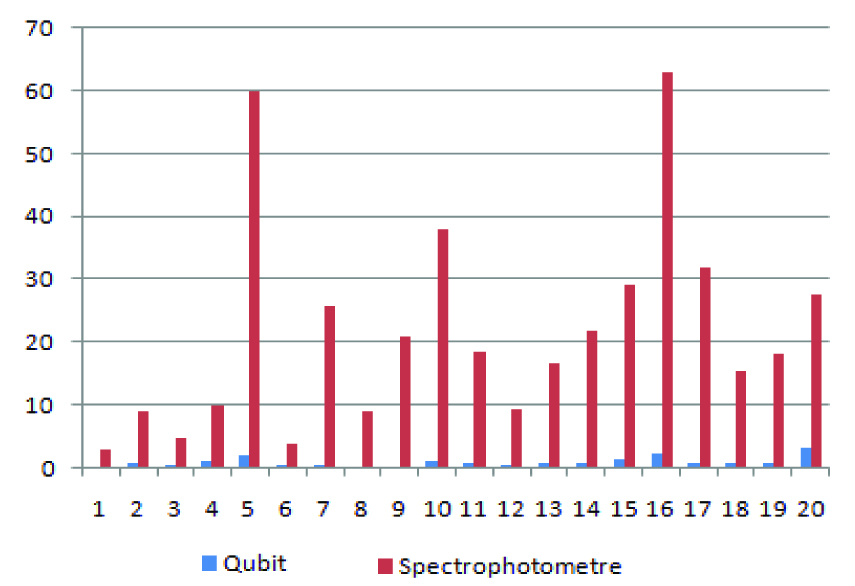
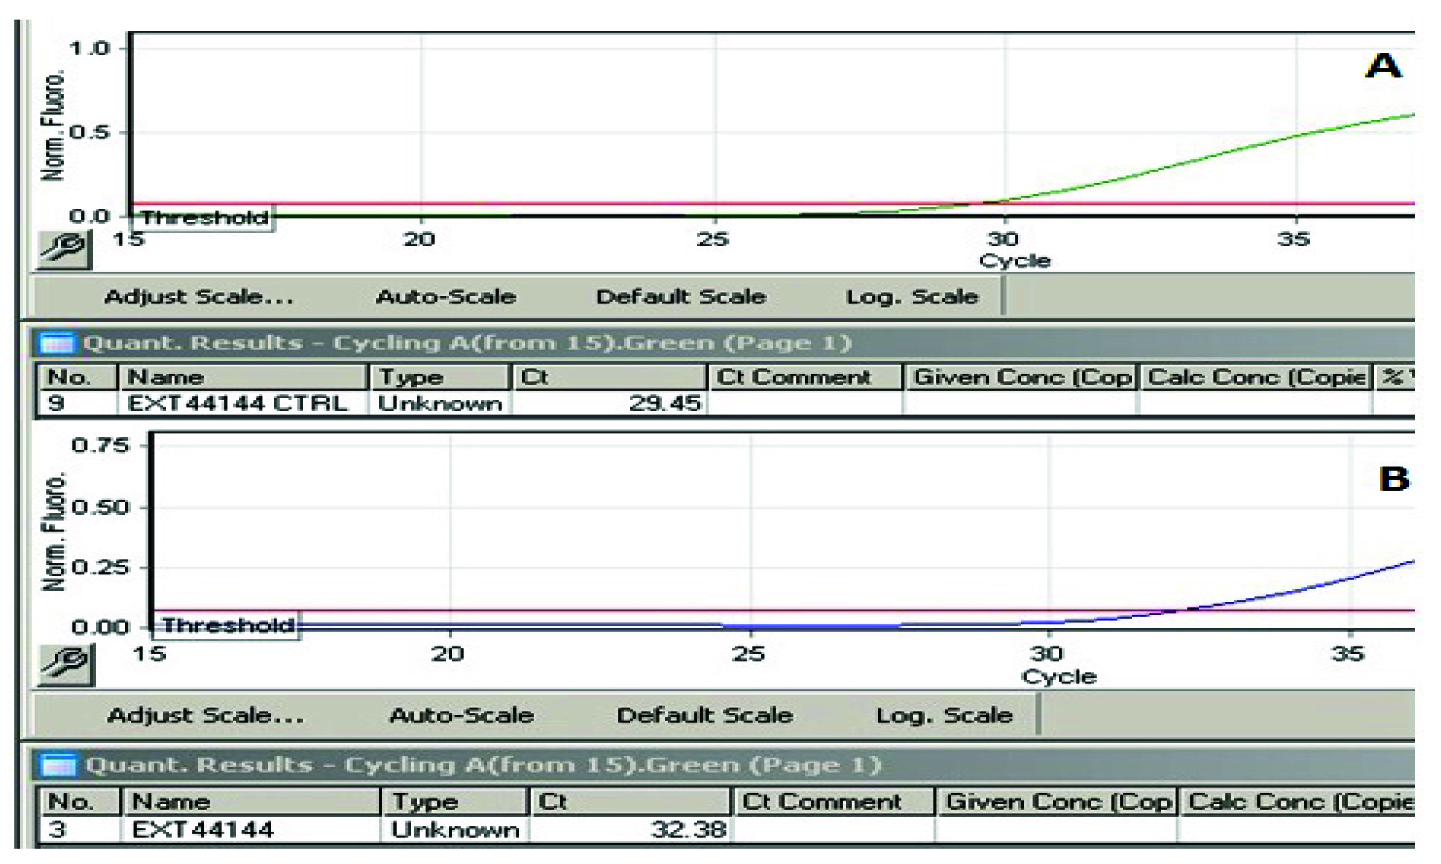
Comparing Biorad Smartspec Plus and Qubit 3.0 measurements of identical samples shows that Biorad Smartspec Plus spectrophotometry overestimates DNA by more than ten folds (q/s ratio 13.27) as shown in [Table/Fig-1]. On qPCR when we used 10ng of quantified DNA by spectrophotometer and Fluoremeter we got significant variations in control ct values. Some of the control ct values were out the reportable parameters given by Qiagen Therascreen Kit reporting instructions. Results of qPCR are given in [Table/Fig-2].
qPCR results using DNA concentration calculated from qubit and spectrophotometer.
| Sample | qPCR Ct value usingDNA concentrationcalculated from Qubit | qPCR Ct value usingDNA concentration calculatedfrom Spectrophotometer |
|---|
| 1 | 27.6 | 31.74 |
| 2 | 28.24 | 31.52 |
| 3 | 29.45 | 33.38 |
| 4 | 32.08 | 34.44 |
| 5 | 29.15 | 33.13 |
| 6 | 28.22 | 31.41 |
| 7 | 32.2 | 36.7 |
| 8 | 30.02 | 33.23 |
| 9 | 29.42 | 32.92 |
| 10 | 27.31 | 32.69 |
| 11 | 28.41 | 33.12 |
| 12 | 27.56 | 32.83 |
| 13 | 28.39 | 33.6 |
| 14 | 26.9 | 32.73 |
| 15 | 25.87 | 32.47 |
| 16 | 27.98 | 33.41 |
| 17 | 26.57 | 32.74 |
| 18 | 27.29 | 33.12 |
| 19 | 26.89 | 32.24 |
| 20 | 28.91 | 33.67 |
Discussion
The FFPE tissue DNA PCR results are influenced by various factors such as the type and amount of tissue, the type of fixative used for tissue preservation, the duration of fixation, age of the paraffin block and storage conditions, as well as the length of the desired DNA segment to be amplified. Removal of paraffin from the tissue is the most critical step for successful extraction as undissolved paraffin which leads to poor sample quality and inhibition of PCR amplification [12]. Naoki Kaneko et al., demonstrated that formalin fixation time and percentage play an important role in getting good quality of amplifiable DNA for PCR analysis [13]. There is another factor, quantification of DNA which also influence the PCR results from FFPE tissue DNA. We have demonstrated that significant variation exists between DNA quantification protocols that might cause laboratories to under/overestimate the quantity of DNA in their samples.
The UV-absorbance method uses a spectrophotometer which relies on light absorption by DNA and RNA at 260nm. The more DNA, RNA in the sample, the more light is absorbed. In addition, using the absorbance method, it is not possible to distinguish between DNA, RNA, or free nucleotides or amino acids in the sample, leading to potentially highly inaccurate measurements [14].
Biorad Smartspec Plus spectrophotometry overestimates DNA as shown in [Table/Fig-3] and on the basis of [Table/Fig-1] results average q/s ratio was 13.27. which could theoretically result in using lower amounts of starting DNA for the downstream procedures for mutation analysis by PCR, real time PCR, Sanger sequencing, Pyrosequencing, Next generation sequencing, this could lead to false negative results or unsatisfactory results which could not be analyzed or reported as shown in [Table/Fig-4] (qPCR results) and [Table/Fig-5]. (Pyrosequencing results). Deben et al., O’Neill et al., also reported the similar findings [15,16].
Comparison of DNA concentration using spectrophotometer and qubit - quantification was performed with 5μl of DNA.
Threshold cycles obtained from qPCR A. Threshold cycle (Ct) using DNA concentration from Qubit Fluorometry. B.Threshold cycle (Ct) using DNA concentration from Spectro reading.
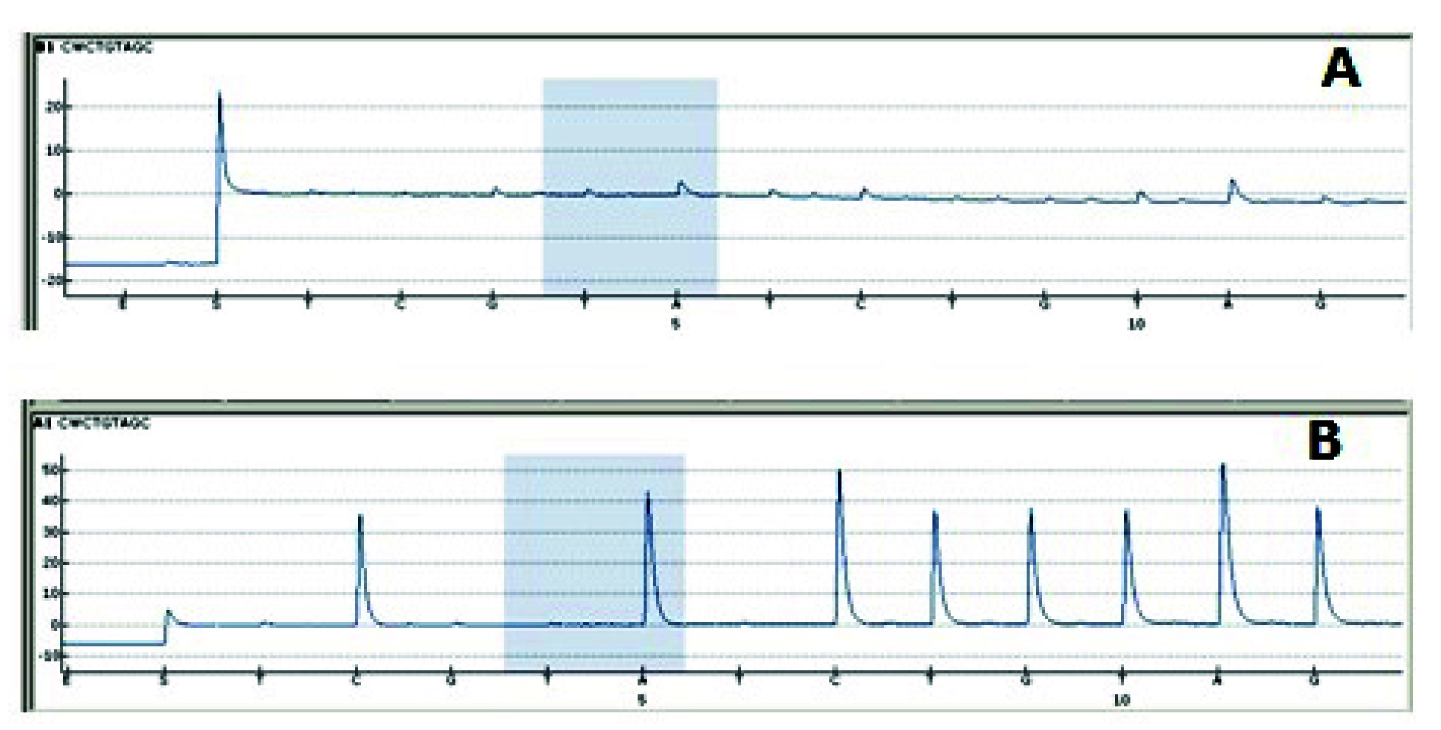
Comparison of Pyrosequencing results A. Using 10ng DNA calculated with spectrophotometer very small peak height in program is seen, which is due to less amplicons generated by PCR. B. When used 10ng DNA calculated by Qubit Fluorometer good peak height has been generated.
Simbolo et al., reported worst spectro/qubit correlation for partially degraded versus intact DNA which also supports our findings [17]. All these finding suggests that degraded DNA obtained from FFPE tissue and disconcordance between spectrophotometry and qubit reading. But our study demonstrated the effect of this spectrophotometry and qubit reading disconcordance on downsteam processes. If a given sample does not contain the required number of mutant templates, downstream mutation detection will not be successful. Failures in DNA recovery represent a waste of precious patient samples, which necessitates repeat testing or even repeat biopsy that can delay critical patient therapy. Measuring DNA integrity during pre-PCR may therefore save costs and time [18].
We also demonstrated use of qPCR for assessing DNA integrity, which quantifies the percentage of templates competent for amplification [19]. qPCR results as shown in [Table/Fig-4] as per protocol of therascreen EGFR RGQ PCR Kit, sample control threshold cycle (Ct) value should be within range of 23-30.69 for accurately reporting sample results, and ct value within 30.69-37 should be interpreted cautiously as very low level of mutation may not be detected. So the cases in which CT value is above 30.69 will increase the chances of false negative reports. On the basis of findings which we got from this study, we suggest that 5-10 ng of FFPE DNA from qubit fluorometer should be used in PCR and sequencing based diagnostic mutation analysis to avoid false negative results.
Limitation
This study is limited to 20 samples for better conclusion large number based study is required.
Conclusion
In our lab we found a significant variation in FFPE DNA quantification by spectrophometry, Fluoremetry and qPCR. As qPCR tells the DNA quantity along with quality of amplifiable DNA but is expensive in all three techniques so fluorometric analysis may be more suitable for quantification of DNA samples extracted from FFPE tissue. External quality control should include pre-PCR steps in their assessment of mutation detection from FFPE samples.
[1]. Miething F, Hering S, Hanschke B, Dressler J, Effect of fixation to the degradation of nuclear and mitochondrial dna in different tissuesJ Histochem Cytochem 2006 54:371-74. [Google Scholar]
[2]. Didelot A, Kotsopoulos SK, Lupo A, Multiplex picoliter-droplet digital PCR for quantitative assessment of DNA integrity in clinical samplesClin Chem 2013 59:815-23. [Google Scholar]
[3]. Fukuoka M, Wu YL, Thongprasert S, Biomarker analyses and final overall survival results from a phase III, randomized, open-label, first-line study of gefitinib versus carboplatin/paclitaxel in clinically selected patients with advanced Non-small-cell lung cancer in Asia (IPASS)J Clin Oncol 2011 29:2866-74. [Google Scholar]
[4]. Maemondo M, Inoue A, Kobayashi K, Gefitinib or chemotherapy for non-small-cell lung cancer with mutated EGFRN Engl J Med 2010 362:2380-88. [Google Scholar]
[5]. Mitsudomi T, Morita S, Yatabe Y, Gefitinib versus cisplatin plus docetaxel in patients with non-small-cell lung cancer harbouring mutations of the epidermal growth factor receptor (WJTOG3405): an open label, randomised phase 3 trialLancet Oncol 2010 11:121-28. [Google Scholar]
[6]. Han SW, Hwang PG, Chung DH, Epidermal growth factor receptor (EGFR) downstream molecules as response predictive markers for gefitinib (Iressa, ZD1839) in chemotherapy-resistant non-small cell lung cancerInt J Cancer 2005 113:109-15. [Google Scholar]
[7]. De Roock W, Claes B, Bernasconi D, Effects of KRAS, BRAF, NRAS, and PIK3CA mutations on the efficacy of cetuximab plus chemotherapy in chemotherapy-refractory metastatic colorectal cancer: a retrospective consortium analysisLancet Onco 2010 11:753-62. [Google Scholar]
[8]. Esfahani K, Agulnik JS, Cohen V, A systemic review of resistance mechanisms and ongoing clinical trials in ALK-rearranged non-small cell lung cancerFront Oncol 2014 4(174) [Google Scholar]
[9]. Poulikakos PI, Persaud Y, Janakiraman M, RAF inhibitor resistance is mediated by dimerization of aberrantly spliced BRAF(V600E)Nature 2011 480:387-90. [Google Scholar]
[10]. Dedhia P, Tarale S, Dhongde G, Khadapkar R, Evaluation of DNA extraction methods and real time PCR optimization on formalin-fixed paraffin-embedded tissuesAsian Pac J Cancer 2007 8(1):55-59. [Google Scholar]
[11]. Rait VK, Zhang Q, Fabris D, Conversions of formaldehyde-modified 2’deoxyadenosine 5’-monophosphate in conditions modeling formalin-fixed tissue dehydrationJ Histochem Cytochem 2006 54:301-10. [Google Scholar]
[12]. Larissa AP, Katey SS, Heryet C, DNA extraction from paraffin embedded material for genetic and epigenetic analysesJ Vis Exp 2011 49:2763 [Google Scholar]
[13]. Kaneko N, Tanimoto T, Morimoto M, Use of formalin-fixed paraffin-embedded tissue and single-strand conformation polymorphism analysis for polymerase chain reaction of antigen receptor rearrangements in dogsJ Vet Med Sci 2009 71(4):535-38. [Google Scholar]
[14]. Glasel JA, Validity of nucleic acid purities monitored by 260 nm/280 nm absorbance ratiosBiotechniques 1995 18:62-63. [Google Scholar]
[15]. Deben C, Zwaenepoel K, Boeckx C, Expression analysis on archival material revisited: isolation and quantification of RNA extracted from FFPE samplesDiagn Mol Pathol 2013 22:59-64. [Google Scholar]
[16]. O’Neill M, McPartlin J, Arthure K, Comparison of the TLDA with the Nanodrop and the refernce Qubit SystemJ Phys 2011 307:1-6. [Google Scholar]
[17]. Simbolo M, Gottardi M, Corbo V, DNA qualification workflow for next generation sequencing of histopathological samplesPLoS ONE 2013 8:e62692 [Google Scholar]
[18]. Joshua R Kapp, Tim Diss, James Spicer, Variation in pre-PCR processing of FFPE samples leads to discrepancies in BRAF and EGFR mutation detection: a diagnostic RING trialJ Clin Pathol 2015 68:111-18. [Google Scholar]
[19]. Sah S, Chen L, Houghton J, Functional DNA quantification guides accurate next-generation sequencing mutation detection in formalin-fixed, paraffin-embedded tumour biopsiesGenome Med 2013 5:77 [Google Scholar]