Acute Cerebrovascular Events (ACE)s are a wide set of emergent clinical manifestations, including etiologic (ischemic or haemorrhagic), anatomic, and clinical TIA or stroke) parameters. TIA is a short-lasting form of ACE with complete resolution of symptoms within a definite 24-hour time period [1–3]. Clinical conditions with symptoms similar to those of ACEs are identified as mimics. TIA mimics refer to clinical manifestations with transient focal neurological symptoms that are not attributable to focal cerebral ischemia [4,5]. The current literature indicates that rate of TIA mimics ranges from 10% to 48.5% [6–9].
In ED settings, the differential diagnosis of stroke, TIA, and TIA mimics are a challenging diagnostic process. The current literature reveals that migraine, seizures, conversion disorders, and brain tumours are the most prevalent differential diagnoses that should be considered and excluded on this continuum [10]. After history-taking and a detailed neurologic examination, diagnostic screening allows physicians to exclude other possible diagnoses and to validate the ischemic process of the cerebrovascular system. Biochemical tests are relatively easy to perform and have lower cost parameters in comparison to imaging studies. A retrospective cross-sectional study determined that a high initial Red Blood Cell Distribution Width (RDW) may lead to a Cerebral Venous Sinus Thrombosis (CSVT) diagnosis in patients presenting with headache to EDs or neurology outpatient units [11]. Additionally, increased RDW was found to be associated with death due to stroke [12]. Another observational study reported that the Neutrophil to Lymphocyte Ratio (NLR) may be used as a simple and easily measured marker for the prediction of the short-term prognosis and in-hospital mortality in both ischemic and haemorrhagic stroke patients [13]. The Platelet to Lymphocyte Ratio (PLR) and Mean Platelet Volume (MPV) are additional parameters of the CBC that reflect an inflammatory response and disease activity in various clinical conditions [14,15]. However, we could not find any surveys investigating the diagnostic role of CBC parameters in the diagnostic process for TIA.
Seizures are an important group of diagnoses in the differential evaluation of TIAs because of their variable and temporary signs and symptoms. Physicians must frequently rule out TIA in asymptomatic patients with normal diagnostic neuroimaging. We aimed to investigate the efficacy of CBC components in the differential diagnosis of TIA and seizures.
Materials and Methods
We designed a retrospective case-control study using the hospital’s inpatient database. Patients admitted to the ED and hospitalized with an initial diagnosis of TIA or seizure at the neurology clinic of Erzurum Ataturk University Training Hospital Erzurum, Turkey between January 1, 2012 and December 31, 2014 were recruited for the study. Patients with inaccessible or missing data were excluded.
We analysed the data of all consecutive patients admitted to the ED with suspected TIA or seizure over the defined period of 24 months. Their clinical symptoms upon admission included unilateral paresis, unilateral sensory loss, aphasia, dysarthria, transient monocular blindness, diplopia, vertigo, blurred vision, memory loss, and headache. ED evaluations included a physical examination and the following biochemical laboratory studies: CBC, routine biochemistries (glucose, blood urea nitrogen, creatinine, sodium, potassium, alanine transaminase, and aspartate transaminase), and arterial blood gas analyses for patients with suspected carbon monoxide intoxication. In addition to the ED evaluation, patients with suspected TIA or seizure were consulted to the neurology clinic. All patients underwent diffusion-weighted imaging (DWI) and those with an initial diagnosis of seizure underwent Electroencephalogram (EEG) on follow-up at the neurology clinic. A final TIA diagnosis was based on the evaluation of a neurologist, along with the results of neuroimaging and EEG. We divided the patients into two groups (TIA and seizure) according to their final diagnosis, and compared their demographics (age, gender), CBC values, NLR and PLR. The study was approved by the Institutional Ethics Committee.
CBC Protocol
Venous blood samples were obtained for CBC and biochemistry analyses within the first 30 minutes after admission to the ED. Blood was collected into an Ethylenediaminetetraacetic Acid (EDTA) tube, stored at 4°C and centrifuged for 10 min at 4,000 rpm to separate the plasma. CBC parameters were measured using a Beckman Coulter Automated CBC Analyser (Beckman Coulter, Inc., Fullerton, Miami, FL, USA). NLR was calculated by dividing the neutrophil value by the lymphocyte value, and PLR was calculated by dividing the platelet value by the lymphocyte value.
DWI Protocol
MRI studies were performed with a 3 Tesla MRI scanner (Magnetom Skyra; Siemens Healthcare, Berlin, Germany). A single-shot echoplanar imaging sequence was used for DWI. The sequence parameters for DWI were as follows: TR/TE = 6800/98 ms; flip angle 150; voxel size 1.3×1.3×4.0mm; matrix 186×256; slice thickness 4 mm; FOV 250×71.9mm; averages 3; PAT mode 2; and distance factor 40%. We used 27 DWI scans with two b-values: 0 and 1,000s/mm2. Apparent diffusion coefficient map images were obtained. All images were evaluated by the attending radiologist.
EEG Protocol
EEG studies were performed with a Nihon Kohden LS120. Hyperventilation and intermittent photic stimulation were performed during the procedures. All studies were completed within 20 minutes.
Statistical Analysis
The Kolmogorov–Smirnov test was used to determine the normality of the distribution of continuous variables. The numerical variables were stated as the mean±standard deviation or median (25th–75th quartiles) according to normality of distribution. Comparisons between the TIA and seizure groups were done with Student’s t-test and the Mann–Whitney U test for continuous variables according to normality of distribution, and with the χ2 test for categorical variables. Receiver-Operating Characteristic (ROC) curve analyses were performed to identify the optimal cut-off point of the age value for the prediction of TIA. Statistical analysis was performed with SPSS version 20.0 (SPSS for Windows, IBM, Armonk, NY, USA).
Results
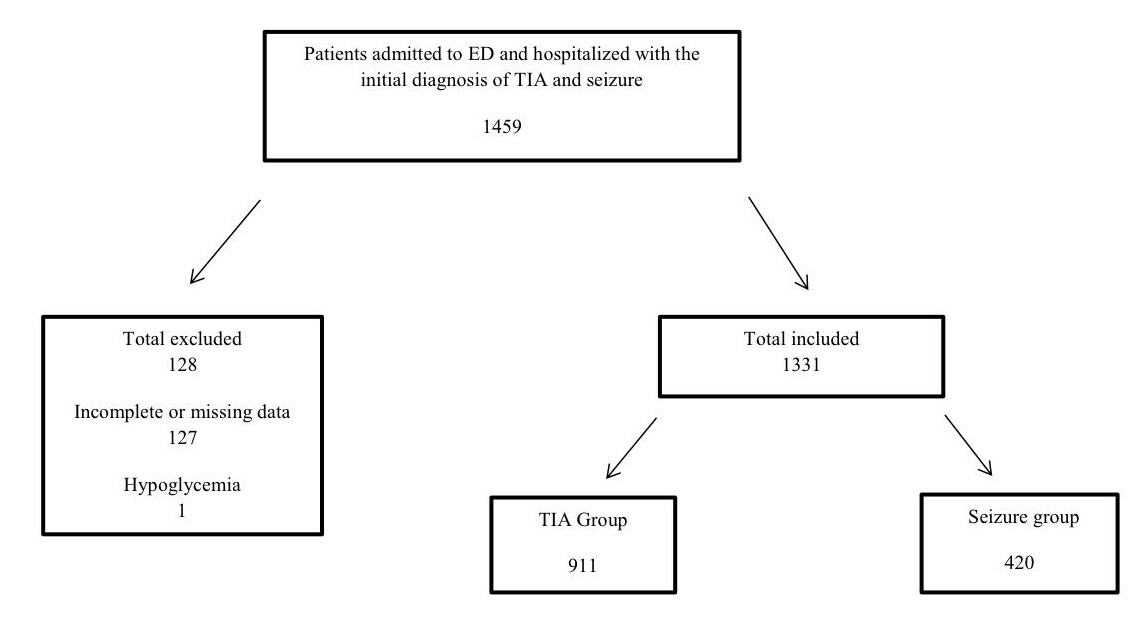
We identified 1,459 ED admissions that resulted in neurology clinic hospitalizations of patients with initial diagnoses of TIA (n=911) and seizure (n=420) over a 24-month time period. Patients with incomplete or missing data (127 patients) and one patient with a diagnosis of hypoglycemia were excluded from the study [Table/Fig-1].
Study enrollment flowchart.
The main demographics of the subjects are listed in [Table/Fig-2]. Our results showed that the TIA group had higher ages (p<0.001) and the seizure group included more males (p=0.09). The LOS duration of the two groups (means of 7.9 days and 7.8 days for the TIA and seizure groups, respectively) were similar (p=0.954). A comparison of the laboratory analyses showed statistically significant differences in basophils, eosinophils, haematocrit (Htc), Mean Corpuscular Haemoglobin Concentration (MCHC), Mean Platelet Volume (MPV), Platelet Distribution Width (PDW), platelets, Red Blood Cell (RBC) count, RDW, White Blood Cell (WBC) count [Table/Fig-3], and NLR [Table/Fig-4]. For statistical significance, we entered two demographic variables (age, gender), 10 laboratory CBC parameters (basophils, eosinophils, haematocrit, MCHC, MPV, PDW, platelets, RBC, RDW, and WBC), and one calculated CBC parameter (NLR) in a multivariate logistic regression analysis [Table/Fig-4]. This analysis demonstrated that age, gender, MCHC, MPV, RBC, WBC, and NLR were statistically significant variables that differed between the TIA and seizure groups. After statistical comparison and correlation analysis of two groups, we obtained that only mean WBC values were over normal limits (10.6x10⁹/L, normal limits 4.3-10.3x10⁹/L).
Demographics, and calculated CBC values (NLR, PLR) of TIA and seizure groups.
| Demographics | TIAMean (Min-Max) or n (%) | SeizureMean (Min-Max) or n (%) | p-value | TotalMean (Min-Max) orn (%) |
|---|
| Age (Year) | 65(53-74.75) | 31(21-45.75) | <0.0001 | 40(25-63) |
| Gender (Male) | 433(47.6%) | 232(55.3%) | 0.009 | 704(52.9%) |
| NLR | 2.7(1.9-5) | 2.5(1.6-4.6) | 0.022 | 2.6(1.69-4.66) |
| PLR | 125.6(96.2-180) | 128.4(96.3-184.4) | 0.504 | 128.2(96.3-182.8) |
CBC values characteristics and comparison of TIA and seizure groups.
| Characteristics | TIAMean(Min-Max) or Mean ± SD | SeizureMean (Min-Max) or Mean ± SD | Reference values for CBC | p-value | TotalMean (Min-Max) or Mean ± SD |
|---|
| Hb | 14.2(13.1-15.3) | 14.1(12.9-15.4) | 13.6-17.2 g/dL | 0.399 | 14.1(12.9-15.4) |
| Htc(mean±SD) | 42.6±5.5 | 41.9±5.3 | 39.5%-50.3% | 0.045 | 42.2±5.4 |
| RBC(mean±SD) | 4.9±0.7 | 4.8±0.6 | 4.38-5.77x10⁶/ml | 0.019 | 4.8±0.6 |
| RDW | 14.1(13.4-15.1) | 13.6(13-14.5) | 11.8-14.3 | <0.0001 | 13.7(13-15.1) |
| MCH | 29.5 (28.2-30.9) | 29.9(28.5-31.2) | 27.2-33.5 | 0.013 | 29.8(28.2-31.2) |
| MCHC | 33.3(32.7-33.9) | 33.6(32.9-34.2) | 32.7-35.6 | <0.0001 | 33.5(32.7-34.2) |
| MCV | 88.4(85-91.8) | 88.8(85.4-92.4) | 80.7-95.5 | 0.436 | 88.6 (85-92.4) |
| WBC | 9.2(6.9-14.95) | 10.6(6.9-75) | 4.3-10.3x10⁹ /L | 0.002 | 9.9 (6.9-75) |
| Neutrophil | 5.3(4.1-7.4) | 5.1(3.7-7.4) | 2.1-6.1x10⁹/L | 0.133 | 5.2(3.7-7.4) |
| Lymphocytes | 1.8(1.3-2.4) | 2(1.4-2.5) | 1.3-3.5x 10⁹/L | 0.115 | 1.9(1.3-2.5) |
| Basophils% | 0.06 (0-0.2) | 0.09 (0-0.28) | 0-2% | <0.0001 | 0.07 (0-0.28) |
| Eosinophils% | 0.15 (0-0.55) | 0.12 (0-0.27) | 1-6% | <0.019 | 0.13 (0-0.55) |
| MONO% | 0.61 (0-1.18) | 0.65 (0-1.31) | 2-10% | 0.299 | 0.64 (0-1.31) |
| Platelets*103 | 233.5(192-283.8) | 254(208-300) | 150-450x109 /L | <0.0001 | 248(192-300) |
| MPV | 8.1(7.4-8.8) | 7.9(7.3-8.7) | 6.8-10.8 fL | 0.008 | 7.9(7.3-8.8) |
| PDW | 16.8(16.5-17.3) | 16.6(16.3-17.1) | 10-14 fL | <0.0001 | 16.7(16.3-17.3) |
Correlation analysis of demographics, CBC values and calculates parameters.
| Characteristics | B | S.E. | Wald | p-value | OR |
|---|
| Age | 0.083 | 0.005 | 299.478 | 0.000 | 1.086 |
| Gender (male) | -0.717 | 0.174 | 16.975 | 0.000 | 0.488 |
| Ba% | 0.893 | 0.504 | 3.141 | 0.076 | 2.443 |
| Eo% | 0.742 | 0.493 | 2.266 | 0.132 | 2.100 |
| MCHC | 0.199 | 0.087 | 5.181 | 0.023 | 1.220 |
| MPV | 0.167 | 0.077 | 4.666 | 0.031 | 1.181 |
| PDW | 0.146 | 0.124 | 1.406 | 0.236 | 1.158 |
| Plt | 0.000 | 0.001 | 0.010 | 0.920 | 1.000 |
| RBC | 0.585 | 0.136 | 18.540 | 0.000 | 1.795 |
| RDW | -0.043 | 0.050 | 0.764 | 0.382 | 0.957 |
| WBC | -0.008 | 0.002 | 16.151 | 0.000 | 0.992 |
| NLR | -0.045 | 0.016 | 8.021 | 0.005 | 0.956 |
In the ROC curve analyses, we analysed the Area Under the Curve (AUC) to identify the effect of age on the TIA and seizure group discrimination. The analysis resulted with an AUC of 0.854. At the age of 37.5 years, sensitivity was 92.4%, specificity was 64.3%, the positive likelihood ratio was 2.58, and the negative likelihood ratio was 0.11 [Table/Fig-5,6].
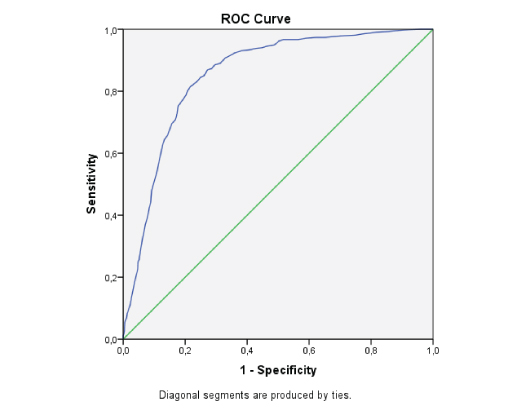
Area under the curve to identify the effect of age on TIA and seizure.
| Area | Std.Errora | Asymptotic Sig.b | Asymptotic 95% Confidence Interval |
|---|
| Lower Bound | Upper Bound |
|---|
| 0.854 | 0.011 | 0.000 | 0.833 | 0.875 |
The test result variable(s): AGE has at least one tie between the positive actual state group and the negative actual state group. Statistics may be biased.
a. Under the nonparametric assumption
b. Null hypothesis: true area = 0.5
Discussion
Our study presents data covering a 24-month period, and differentiates the two main diagnoses of 1,331 patients in the ED and neurology clinic settings. The current literature includes studies on TIA and TIA mimic differentiation involving 868 patients, 206 patients, and 671patients [13,16,17]. With regard to the number of participants and the specific topic, our study contributes a valuable analysis to the literature on TIA and seizure.
Our study demonstrated that age (p=0.00) and gender (p=0.00) were statistically significant parameters for the differentiation of TIA patients from seizure patients. Noureddine et al., reported that in their survey, patients with TIA mimics were approximately 14 years younger than those with true TIA [10]. A current data review reported that age is a key aspect of the patient’s history that is helpful in distinguishing TIA from mimics, but seizures have no sex predilection [18]. Although the clinical signs and symptoms may be confusing with regard to loss of conscious, amnesia, and motor or sensory disabilities, TIA and seizures have different pathophysiologic pathways. Decreased blood flow to the cerebrovascular system is the main responsible factor in TIA and other ACEs, but seizures are based on aberrant electrical discharges involving the cerebral cortex. We assess that compared with seizure patient group; TIA patient group’s statistical significant higher age is compatible with the pathophysiologic difference between two diagnoses. Considering our study results about demographic variables, we can conclude that age may be used as a valid marker to differentiate between the two groups. However, we obtained a statistically significant result, we can not comment over gender variables in differentiation of these two conditions in clinical area.
Platelets play an important role in diseases prone to thrombosis and inflammation. In our analysis, we determined that platelet-associated values on CBC (platelet count, PDW, and MPV) were statistically different between the TIA and seizure groups. However, MPV is the only independent variable that could differentiate between the two groups as a result of the logistic regression analysis and mean MPV values of two groups were within normal limits [Table/Fig-3]. The current literature describes the diagnostic value of MPV in ACEs. Gasparyan et al., reported that elevated MPV is a characteristic laboratory feature of ischemic stroke, detectable from the early hours of onset [15]. In addition, a higher MPV is associated with a larger volume of cerebral damage and a greater risk of poor outcomes during the early post-stroke period [19,20]. Contrary to the diagnostic value on ACEs’, MPV has no diagnostic value on discrimination of TIA and seizure patients according to our study results. PLR is regarded as a representative index of systemic inflammation. However, the literature shows that its prognostic value is only applicable for various cancers (ovarian, colorectal, breast, non-small-cell lung, and soft-tissue sarcoma) and rheumatologic diseases, such as psoriasis vulgaris and psoriatic arthritis [21,22]. In our study, we did not detect statistically significant differences between the PLR values of the two groups; therefore, we conclude that PLR has no diagnostic value for discrimination between TIA and seizure.
Another calculated CBC parameter is the NLR. When comparing the cellular components of blood, both neutrophils and lymphocytes play roles in the peripheral inflammatory response, but lymphocytes are more involved in the regulation of the immune response [23]. From this point of view, the diagnostic value of neutrophil counts, lymphocyte counts, and the NLR has been investigated particularly in cardiovascular diseases. Our results showed that there was no statistical difference between the two groups’ neutrophil and lymphocyte counts, but the WBC and NLR values were different. Additionally, a logistic regression analysis showed that they were independent variables in the discrimination between the two groups. The current literature indicates that higher WBCs and NLRs have predictive power in the prognosis and mortality of cardiovascular diseases [24–26]. In terms of ACEs, Gökhan et al., reported that NLR may be used as a marker for the prediction of the short-term prognosis and in-hospital mortality in both ischemic and haemorrhagic stroke patients [13]. We consider that our study results support the use of NLR and WBC levels for the differential diagnosis of TIA, particularly in cases involving symptoms that may be confused with seizure. However, this result has a drawback about the normal limits of the tests. About NLR, it’s a ratio of CBC parameters and we have no validated normal limits for diagnostic assessment. We assess that diagnostic value and accuracy of NLR should be further evaluated on discrimination of TIA and seizure patients.
Erythrocytes are one of the three major cellular components of blood, along with platelets and leukocytes. Unlike the latter two components, erythrocytes play a principal role of delivering oxygen to tissues. Before determining the results of our study, we expected to find lower Htc and RBC values in older TIA patients compared to the younger seizure group, but the results went in the opposite direction. Baskurt et al., reported that Htc has the strongest impact on whole-blood viscosity compared to other parameters, such as plasma viscosity, RBC deformability, and RBC aggregation [27]. Li et al., reported that increased whole-blood viscosity is associated with silent cerebral infarction [28]. Considering the results of these studies and our study, we think that a statistically significant difference in Htc between the two groups is an indicator of increased whole-blood viscosity, and may thus be a reason for the increased risk of TIA. But Htc is not alone a diagnostic test that can differentiate the two groups of patients. We found that RBC and MCHC were independent variables that could differentiate the TIA and stroke groups. But mean RBC and MCHC values of two groups were within normal limits and we cannot comment on the pathophysiology of this result due to deficiencies in the literature. The effects of whole-blood viscosity on TIA should be investigated with more detailed studies.
RDW is the CBC parameter that represents the size variations of circulating erythrocytes. The diagnostic value of RDW has been investigated in greater detail compared to other indices of erythrocytes. In terms of ACE, the RDW value is regarded as a useful tool for predicting the severity and functional outcome of stroke, but there are not enough studies on this in the literature with regard to TIA [29]. Although the logistic regression analysis did not show a significant difference, we found that the RDW value was statistically significantly different between the two groups, with higher RDW values in the TIA group. On the other hand, RDW is an age-dependent parameter that increases with age [30]. We suggest that RDW may be used as an indicator for the differential diagnosis between TIA and seizure, but age-related changes and the diagnostic accuracy of the test should be further investigated.
Limitation
Limitations of our study include its retrospective nature and the incompatibility between statistical and clinical significance of the study results. However 11 CBC parameters had statistically significant difference and five of them were statistically independent variables, only mean 11X109/L WBC values of seizure group were over normal limits compared with TIA patients’. In addition, many laboratory standards accept 4-11X 109/L limits as normal, and this range more restricts clinical diagnostic value of WBC results on TIA and seizure discrimination.
Conclusion
We conclude that CBC may have a diagnostic value on TIA and seizure differentiation, but this is limited because of statistical and clinical incompatibility. Elevated WBC values of seizure patients compared with TIA patients’ may help clinicians at the preliminary phase of diagnostic studies. We conclude that age is a remarkable and valuable demographic parameter in addition to physical examination, laboratory and imaging studies.
The test result variable(s): AGE has at least one tie between the positive actual state group and the negative actual state group. Statistics may be biased.
a. Under the nonparametric assumption
b. Null hypothesis: true area = 0.5