Diabetes Mellitus (DM) is a serious health hazard all over the world. In the South East Asian region of which India is a part, there were 72 million adults with DM in 2013 and it is expected to rise to more than 123 million by 2035 [1]. India, the largest country in this region has 65 million adults with DM and it is second only to China in the world [2]. Diabetes is frequently accompanied by serious short-term complications like diabetic ketoacidosis or hypoglycaemia, disabling long term complications like cardiovascular disease, neuropathy, nephropathy or retinopathy. There is also an increased risk of depression [3]. Some studies have shown that there is a risk of depression in diabetes and that the relationship is bidirectional [4,5]. Other studies have observed that depression in diabetes was associated with chronic complications, increased pill burden and old age [6–8]. Therefore, depression in diabetics warrants early recognition and treatment. The present study was an attempt to decipher whether there is any difference in the metabolic and clinical profile between patients having Type 2 Diabetes Mellitus (T2DM) with depression and without depression as there are conflicting reports relating to depression and metabolic profile in these patients. To the best of our knowledge, there are no studies available in this region of rural Krishna district regarding the association of depression in T2DM and especially any research done elucidating our research question.
The present study was a cross sectional pilot study done on depressed T2DM and non-depressed T2DM subjects. Our institution caters to a largely rural population, having a low socio-economic status. Therefore, the dietary habits, work, socio economic status and culture of the diabetic depressed and non depressed cohort are homogeneous.
To study the clinical and biochemical profile of subjects with T2DM and depression and to compare a non depressed diabetic group on the same parameters.
Materials and Methods
The pilot study was an ICMR short term studentship study. It was a cross sectional, comparative study done over a 2 month period (May and June 2015), conducted at a tertiary care teaching hospital in rural Andhra Pradesh. Patients with T2DM attending the outpatient clinic of General Medicine department were the subjects of this study. Informed consent was taken from the patients and ethical committee clearance was obtained from the Institutional ethical committee for carrying out the study.
The inclusion criteria were T2DM subjects diagnosed as having the disease for more than 1 year (either in the institution or elsewhere), aged between 20 to 80 years and of both sexes. The exclusion criteria were pregnant women, those with acute complications of T2DM, deaf subjects, those who cannot understand the self report questionnaire, subjects with prior depression, family history of depression or history of thyroid disease.
The socio demographic, clinical data, including biochemical data and anthropometry measurements were recorded on a semi structured proforma. Depression was assessed and graded using the Patient Health Questionnaire-9 (PHQ-9), a self report questionnaire in Telugu- the local language. Its use has been validated for the Indian population and it is considered to be a reliable tool in the diagnosis of depression [9]. The subjects with T2DM were categorized as depressed or non depressed after administering the PHQ-9 questionnaire. Out of them 30 subjects diagnosed as depressed and 30 who were not depressed were selected for the study. The PHQ-9 is a nine item self report version of Primary Care Evaluation of Mental Disorders (PRIME-MD), which assesses major depression according to Diagnostic and Statistical Manual IV edition (DSM-IV) criteria. There is a good agreement reported between the diagnosis of depression by this questionnaire and that done by psychiatric health professionals [10]. Those patients with values between 6-10 were considered as suffering from mild depression, values above 10 was diagnosed as moderate depression and above 15 as severely depressed. Major depression is diagnosed if the score is >10. Subjects with values <5 are considered as non-depressed [11]. One group had 30 depressed T2DM subjects and the other group comprised of 30 non-depressed T2DM subjects. Fasting blood samples were obtained from the patients after an overnight fast of 12 hours. Two millilitres (ml) of blood in lithium heparin vacutainer tubes for fasting glucose and HbA1C estimation and 2 ml blood in vacutainer tubes having clot activator was collected for estimation of lipid profile, urea and creatinine. The collected blood samples were centrifuged at a speed of 3000 rpm for 10 minutes and the plasma or serum separated for estimation of analytes. Simultaneously, a spot urine sample was collected in a sterilized container and analysed for micro protein and creatinine concentration. All the analytes were estimated using standardized kits of Randox company (United Kingdom based company), using a fully automated clinical chemistry analyser- Randox Daytona. Low density lipoprotein was estimated by Freidewald’s formula. The formula is TC-(TG/5+ HDL). All the above values are in milligrams per decilitre (mg/dl). Urinary micro protein was estimated by pyrogallol red method. Microprotein/creatinine ratio was estimated. A value of >0.2 was considered significant proteinuria [12].
Standard body height was measured with a commercial stadiometer. A digital scale with an accuracy of ± 100g was used to measure Body Weight (BW) in kilograms (kg). The Waist Circumference (WC) in centimetres (cm) was measured in a horizontal plane, midway between the inferior margin of the ribs and the superior border of the iliac crest with a standard tape. Body Mass Index (BMI) was calculated (weight in kg/height in square metres). Systolic and diastolic blood pressure was measured using a mercury sphygmomanometer.
Neuropathy was evaluated by history and by clinical examination done by physician. Incipient nephropathy was diagnosed by spot urine protein-creatinine ratio. The ophthalmologist conducted a detailed fundus examination to identify retinopathy. Coronary artery disease was diagnosed by a history of angina or myocardial infarction as documented by previous treatment records.
Statistical Analysis
Descriptive statistics was used and Student’s t-test was used to compare the continuous variables. The categorical variables were compared using the Chi-square test. Correlation coefficient was used to test for relationship if any, of the continuous variables. A probability value of <0.05 was considered significant.
Results
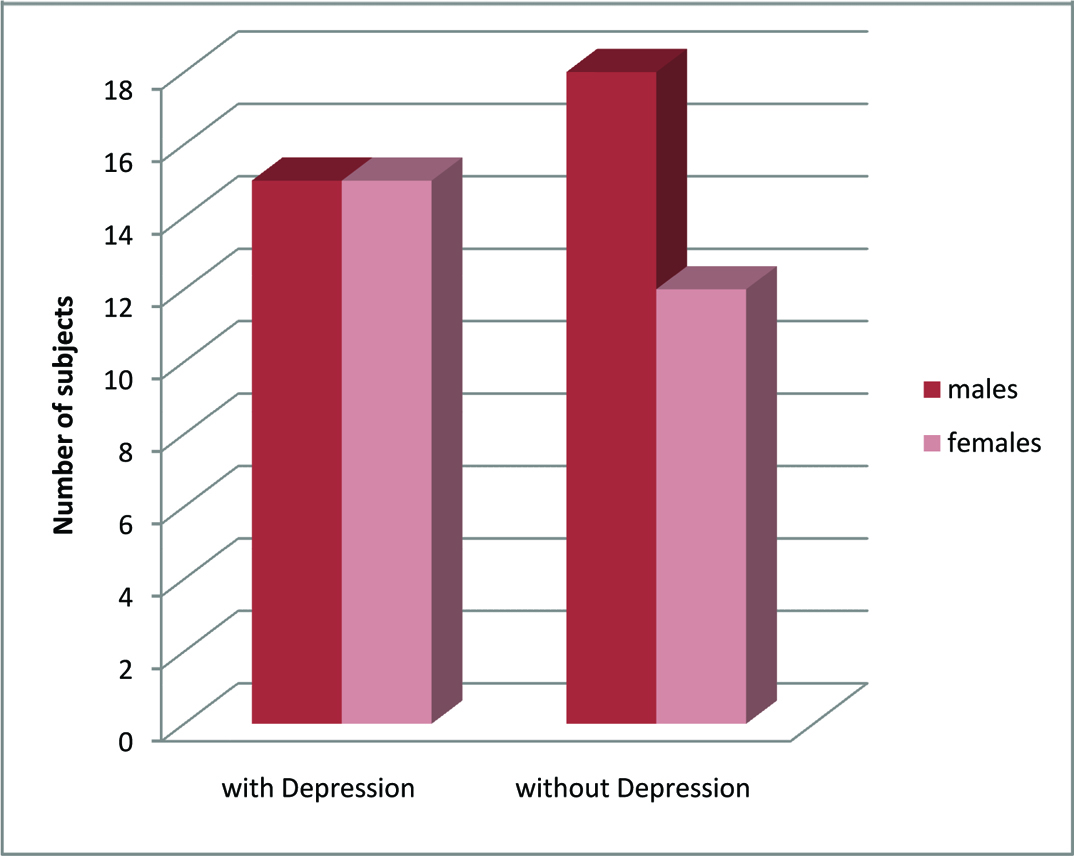
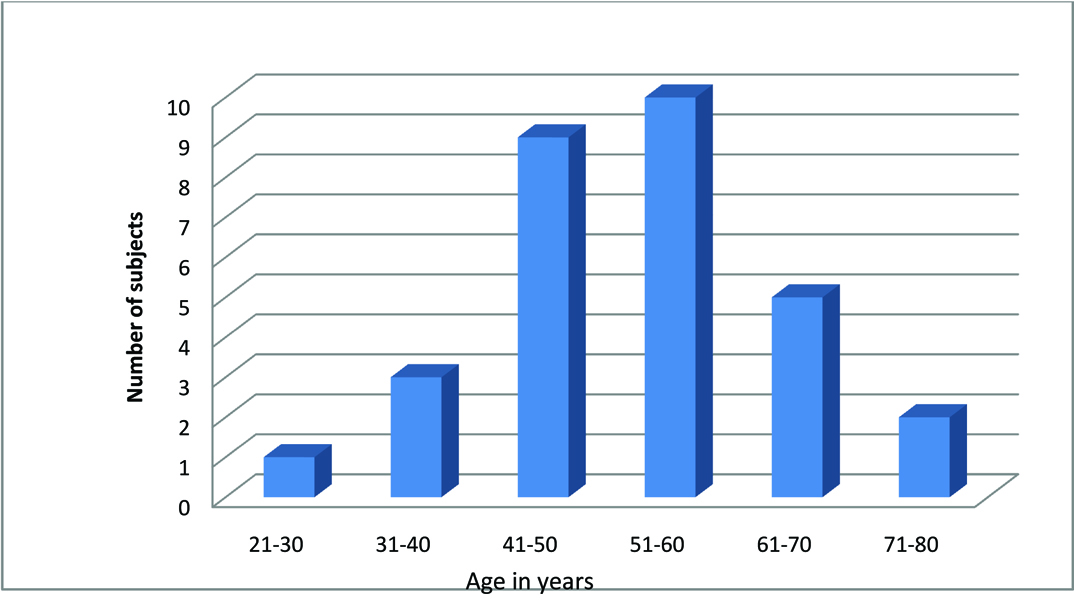
Descriptive statistics was used to compare the socio-demographic, biochemical and clinical data between the two groups. These two groups were similar on most of the socio demographic parameters, biochemical and many of the clinical parameters as given in [Tables/Fig-1]. The biochemical parameters between the two groups did not show statistically significant differences p >0.05 as seen in the table. The Chi-square test for association between the categorical variables like use of insulin, gender predilection, exercise and complications with depression were not significant as seen in [Table/Fig-2]. [Table/Fig-3] shows the correlation coefficient between continuous variables like, waist circumference and BMI with depression. There was no significant correlation. [Table/Fig-4] shows the number of subjects with different grades of depression. [Table/Fig-5] shows the gender distribution in depressed diabetics. The number of males and females in the depressed group were the same. [Table/Fig-6,7] show age-wise distribution of depressed and non depressed diabetics respectively. Younger age group subjects were present in the non depressed group.
Socio-demographic and clinical profile in depressed and non depressed diabetics. Mean and standard deviation is shown. p-value <0.05 is significant.
| Parameters | Depressed | Non-depressed |
|---|
| Age, in years and standard deviation(SD) | 50.8 (±9.7) | 53.5 (±12.9) (p=0.35) |
| Gender | Males -15; Females – 15 | Males -18; Females – 12 |
| Duration of illness in years | 9.9 (±8.2) | 8.1 (±5.7) (p=0.31) |
| Number of subjects doing exercise | 12 | 14 |
| Number of subjects with family history of diabetes mellitus | 10 | 8 |
| Subjects on insulin | 14 | 9 |
| Subjects with chronic complications | 8 | 9 |
| Body mass index in kg/square metre | 28.8(±5.2) | 27.2(±4.1) (p=0.20) |
| Waist circumference in centimetres | Males - 106.6 (±18.6) Females - 113.5(±15.4) | Males - 104.4(±13.1) (p=0.71) Females - 102.1(±14.1) (p=0.54) |
| Systolic blood pressure in mmHg | 126.4(±14.1) | 136.6(±19.4) (p=0.23) |
| Diastolic blood pressure in mmHg | 75(±7.7) | 78.7(±9.8) (p=0.75) |
| Haemoglobin in gm% | Males 13.1(±1.3); Females 11.7(±1.3) | Males 13.1(±1.5); Females 11.5(±1.3) (p=0.68) |
| Glycated haemoglobin% | 8.3(±1.3) | 8.1(±1.1) (p=0.39) |
| Depression score | 9.8(±2.5) | 1.9(±0.9) |
| Fasting blood sugar in mg/dl | 169.6±49.4 | 175.2±53.5[ p=0.67) |
| Total cholesterol in mg/dl | 200.2±29.6 | 196.4±36.8 (p=0.65) |
| LDL cholesterol in mg/dl | 124.2±28.8 | 122.4±34.5 (p=0.64) |
| HDL cholesterol in mg/dl | 41.3±6.1 | 40.5±6.3 (p=0.59) |
| Urea in mg/dl | 26.1±6.5 | 29.9±7.4 (p=0.66) |
| Creatinine in mg/dl | 0.9±0.1 | 1.01±0.8 (p=0.79) |
| Protein/creatinine ratio | 0.2±0.1 | 0.15±0.1 (P=0.51) |
Association between categorical variables and depression.
| Association between categorical variables | Chi-square test value | p-value (<0.05 significant) |
|---|
| Insulin use and depression | 1.76 | 0.18 |
| Exercise and depression | 0.62 | 0.43 |
| Complications and depression | 0.08 | 0.77 |
| Gender difference in depression | 0.61 | 0.44 |
Correlation between continuous variables and depression.
| Continuous variables | Correlation coefficient |
|---|
| Waist circumference in men | r2 = 0.08 |
| Waist circumference in females | r2 = 0.03 |
| Body mass index | r2 = 0.005 |
Number of subjects with different grades of depression.
| Grades of depression | Number of patients |
|---|
| Mild | 16 |
| Moderate | 12 |
| Severe | 2 |
Gender distribution of depression.
Age distribution of depressed subjects.
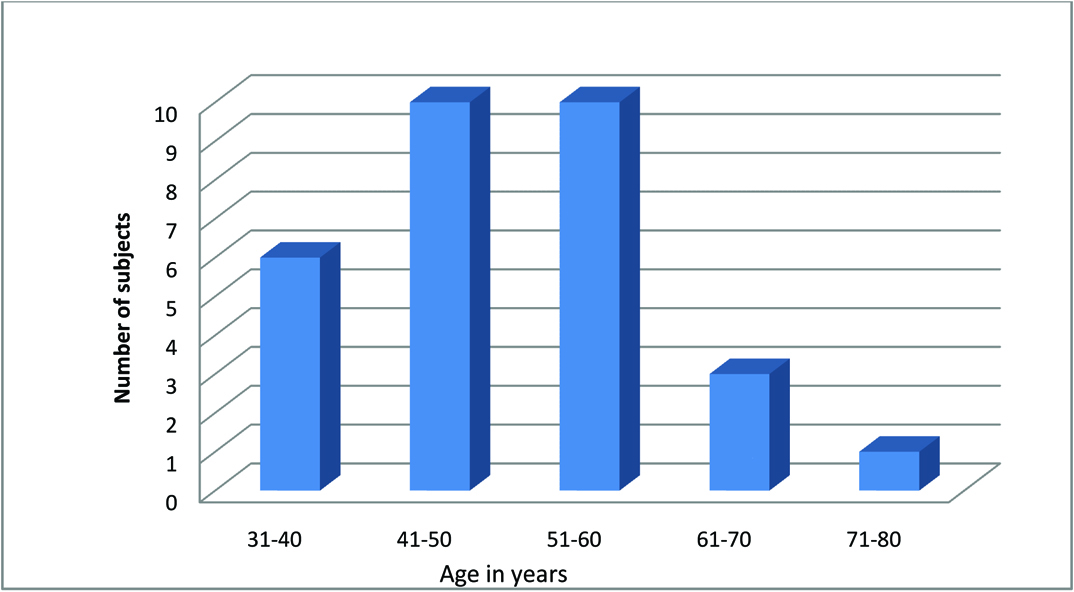
Age distribution of non depressed subjects.
Discussion
The present study on 30 Type 2 diabetic patients with depression and 30 non depressed Type 2 diabetic patients had shown that the mean age of the depressed and non depressed cohort was 50.8±9.7years (y) and 53.5±12.9 years respectively. This was not statistically significant. An Indian study, by Mathew et al., in Ludhiana reported similar findings where the mean age in depressed diabetics was 53.9 ± 9.5 years and in non-depressed diabetics 56.2±11.4 years [13]. Another study in Mangalore city showed that the diabetic patients were more pronounced in the 41-60 year age group [14]. There were equal number of males and females (15 males and 15 females) in the depressed group compared to the non-depressed group represented by 18 males and 12 females in our study. Preponderance of females 53% when compared to 37% males was found in a study by Joseph et al., [14]. The difference was statistically significant in their study. Mathew et al., found no significant gender difference in relation to depression p=0.428. The reason why there was no significant gender difference with relation to depression could be that in the latter study and in the present study the study population was small being 80 and 60 subjects respectively, when compared to the study by Joseph et al., where the study was conducted on 230 T2DM subjects [13,14]. A study by Zuberi et al., in Karachi, Pakistan on 286 subjects with T2DM found that there was female preponderance. Their study reported that women exercised less and had greater BMI when compared to men [15]. Since our study was carried out on a small sample coming to the hospital we did not find any sex difference in the prevalence of depression.
The duration of illness was not statistically different in our study between the depressed and non-depressed groups’ p=0.31, though the mean duration of illness was longer in the diabetic depressed population. The present study did not differ from other studies in this regard like the CURES study done on a sizeable population of 847 T2DM subjects, found no significant difference in duration of illness in the depressed and non depressed group p=0.687 [7]. Lin et al., conducted a longitudinal study on a primary care population with T2DM numbering 4623. The mean duration of T2DM was not very different in subjects with no depression, minor depression and major depression being 8.6, 10.2 and 9 years respectively [16].
The BMI between the two groups did not vary significantly in our study. The study by Niraula et al., in Nepal too did not find any relation between BMI and depression severity p=0.90 [17]. Similarly, the CURES-102 study did not find any significant difference in the 2 groups compared on BMI p=0.215. They found no significant difference even in the waist circumference between the 2 groups p=0.057 [7]. This finding was similar to our study where the waist circumference between males and females between the two groups and BMI showed statistically no significant difference and found no correlation between waist circumference and BMI with depression. A study done by Raval et al., reported that BMI was more in females when compared to males p<0.001, though there was no difference in WC in the two groups [6]. Mathew et al., reported that increased BMI was a significant risk for depression in T2DM p<0.001 [13]. A systematic review and meta analysis of longitudinal studies by Luppino et al., reported that there is a 55% risk of developing depression in an obese person, whereas depressed persons had a 58% risk of being obese. It was a bi-directional relationship [18].
The biochemical profile comprising FBG, lipid profile, serum creatinine, blood urea, glycated haemoglobin and spot urine protein creatinine ratio did not vary significantly between the two groups (p>0.05). The CURES -102 study also showed no differences in all these parameters in depressed diabetics versus the non-depressed group, except that spot urine microalbumin/creatinine ratio was used in their study to identify nephropathy, while our study assessed nephropathy by the urine microprotein/creatinine ratio. Their study reported that nephropathy as assessed by microalbumin/creatinine ratio was significantly associated with depression, p<0.001, but the association was lost after adjusting for retinopathy, p=0.119 [7]. Raval et al., in their study reported that there was no difference in the HbA1C level in patients with and without depression. They too found that micro and macro vascular complications due to DM were strongly related to the prevalence of depression in this group. The lipid profile in their study did not show any significant difference for most parameters except for LDL and TG that were higher in women when compared to men. Similarly FBG was higher in women when compared to men. The central adiposity seen in females in their study could be the reason for the changes observed in FBG, LDL and TG in female depressed diabetics [6].
A study done by Matthew et al., found no difference in HbA1C between T2DM patients with depression and without depression, p=0.013. In their study, the majority of the patients did not meet the glycaemic target of HbA1C<7% [13]. Therefore, they concluded that this could be the reason for the difference not being statistically significant. This finding is similar to our study where the diabetic subjects had elevated HbA1C, the mean being >8%. The study by Joseph et al., also reported no difference in HbA1C values between depressed and non depressed diabetics, p=0.922 [14]. A meta-analytic study by Lustman et al., found that depression was associated with poor glycaemic control in T2DM also. It was reported that the studies that diagnosed depression using standard diagnostic interviews reported better association of poor glycaemic control with depression when compared to self report questionnaires, probably because self report questionnaires also identify subclinical depression. The study also found that though the effect size was small 0.17 the difference in HbA1C was 3% which is not small when translated into clinical information [19]. Katon et al., in their study reported that mean HbA1C value ≥8% and diabetic complications are associated with depression in diabetics. They found that the value of ≥8% correlated with depression in subjects <65 years of age. They also reported that depression was more below 65 years of age. They had used the PHQ-9 to study depression. In our study a similar HbA1C value in both depressed and non-depressed diabetics was seen, as more number of patients belonged to the subclinical depression category and only 2 patients had severe depression [20].
The present study did not show any difference in the prevalence of long term complications between the depressed and non-depressed diabetics. Lin et al., in their study found a strong association between diabetic complications and major depression. The association was more for the microvascular complications than macrovascular complications [16]. In our study the 2 patients who had severe depression with a PHQ-9 value >15 had chronic complications of DM like coronary artery disease and neuropathy. The subjects in the subclinical and clinical depression group did not show any difference in the complications due to T2DM as assessed by the Chi-square test. The cause of the increased complications due to depression severity has been explained as follows. Activation of hypothalamo-pituitary-adrenal axis, increased release of catecholamines, cytokines, platelet/endothelial cell adhesion molecule-1 is associated with depression. This largely contributes to the progression of disease and complications associated with T2DM [16].
The categorical variables that were evaluated for association with depression were insulin use, chronic complications, exercise and gender difference. There was no association between these variables and depression in our study. Zuberi et al., found no significant association between insulin use, exercise and depression but found an association between lack of self care activities and gender with depression. Self care activities like taking the proper dosage, foot care and dietary restriction was not seen in the depressed group [15]. A study by Park et al., found that depression was associated with lack of exercise and poor self care behaviour. They too found no significant relation between insulin use and depression [21]. The study by Joseph et al., and another study found an association between insulin use and depression. They deduced that this could be because the patients found insulin to be a burdensome treatment and also due to the pain of injection [14, 22].
Fruehwald Schultes et al., found that hyperinsulinemia led to hypercortisolemia and hypercortisolemia led to damage of limbic system responsible for mood and memory. This accounted for the behavioural and neurocognitive deficits seen in subjects with this disorder [23]. Insulin also acts as a trophic factor in the brain [24]. It was observed that in T2DM which is due to insulin resistance, insulin cannot activate its receptor leading to absence of activation of Phosphtidyl Inositol-Kinase (PI3-K) which is required to inactivate Glycogen Synthase Kinase-3 (GSK-3) [25]. The GSK-3 constitutively inhibits the activity of glycogen synthase and this inhibition is overcome when insulin acts on its receptor. The Brain Derived Neurotropic Factor (BDNF), also activates PI3-K pathway which is also a central signalling pathway for the synthesis of proteins responsible for neuronal growth, survival and neuronal plasticity [26]. This factor is also reduced in diabetic patients. Overall it leads to activation of GSK-3 that is associated with learned helplessness in animals that is analogous to depression in humans [27].
Limitation
The limitations are that as it was a cross-sectional study, the bi-directional relationship between depression and diabetes cannot be established. As the sample size was 60 and we had more subclinically depressed diabetics, we could not find any difference in the biochemical and clinical profile between depressed and non depressed diabetics.
Conclusion
Our study did not find any significant difference in the socio-demographic, biochemical and clinical data between depressed and non-depressed diabetics. As the PHQ-9 sensitivity in diagnosing clinical depression is seen for values above 10, this can be used to differentiate clinical from subclinical depression in further studies and a larger cohort can be taken to study the difference between the 2 groups on similar parameters to test the null hypothesis. The strength of our study is that it is the first pilot study of this kind in this area.