A steady increase in the number of admission to the tuberculosis hospitals of malignant diseases associated with or simulating tuberculosis has accentuated the problem of accurate diagnosis of tuberculosis and malignancy as various symptoms are similar between these two diseases. The co-existence of tuberculosis and lung cancer has attracted attention for several years and remained controversial [5]. India is a country with high prevalence of tuberculosis so higher probability of lung cancer patients wrongly diagnosed and treated with anti-tubercular drugs delays the diagnosis and initiation of anti-cancer treatment and add up the rate of mortality [6,7].
A high index of clinical suspicion and focussed diagnostic approach is essential to establish the right diagnosis and at early stage which can decrease the rate of mortality in lung cancer patients. In this context easy, cost effective diagnostic tool which can be afforded and performed in primary health care system must be priority.
The first step in etiological investigation of pleural effusion is to determine whether it is transudate or exudate by the criteria proposed by Light et al., in 1972 [8]. However, in cases of congestive heart failure treated with diuretic therapy transudates develop high protein content which may contributes to false positive result [9], similar problems has been encountered in evaluation of ascitis too which has led to estimation of serum-ascitis albumin gradient which is regarded as better predictor between exudates and transudates [10]. In purview of worldwide epidemiological aspects, most cases of pleural effusion in India results as a consequence of tuberculosis or cancer [11]. In this respect, although differential diagnosis must be a priority, it is often difficult to achieve it due to similar biochemical profiles and predominance of lymphocytes in both these conditions. In this context, the objective of our present study is to describe the characteristics and laboratory performance of serum and pleural fluid total protein, albumin, globulin, Serum-Effusion Albumin Gradient and LDH levels between tuberculosis and lung cancer group and to compare it with age and sex matched apparently healthy control groups. If any significance is obtained it will be beneficial to differentiate pulmonary tuberculosis from lung cancer at a very early stage in primary health care facilities and helps in decreasing mortality rate of lung cancer cases as it will not be treated mistakenly as pulmonary tuberculosis in smear negative cases also.
Materials and Methods
This case control study was conducted in the Department of Biochemistry from October 2014 till January 2016 in collaboration with Department of Pulmonary Medicine, Rohilkhand Medical College and Hospital, Bareilly, Uttar Pradesh, India. Ethical clearance was procured from institutional ethical committee with vide reference no. IEC/64/2014. We have taken 100 cases of diagnosed tuberculous effusion, 50 cases of lung cancer who are earlier considered as smear negative pulmonary tuberculosis cases and given DOTS in primary health centre later referred to Department of Pulmonary Medicine (as complications started) and 100 cases of age and sex matched apparently healthy controls (who appeared for general health check up in study age and sex group, non-teaching staffs that are apparently healthy and belongs to study age group).
We have only considered exudative pleural effusion cases as per Light’s criteria i.e., (a) pleural fluid/serum total protein ratio >0.5, (b) pleural fluid/serum LDH ratio >0.6, (c) pleural fluid LDH >200 IU/L [8] and Roth et al. i.e., Serum-pleural effusion albumin gradient of ≤1.2 gm/dL suggests exudates and > 1.2 gm/dL suggests transudates [12].
Standardised diagnostic criteria for tuberculosis were
Pleural biopsy demonstrating a granulamatous process.
Detection of Mycobacterium tuberculosis in pleural fluid or tissue by Z-N staining.
A compatible clinical history and radiological examination, in patients with a lymphocytic exudates and ADA levels higher than 24 IU/L as well as favourable clinical evaluation after specific treatment.
Standardised diagnostic criteria for lung cancer
(1) Finding of neoplastic cells in pleural fluid or tissues obtained by needle biopsy.
(2) CT scan of thorax.
(3) In inconclusive cases, diagnosis was established by thoracoscopy guided biopsy or surgery.
The following patients were excluded from our study
(1) Pleural exudates other than tuberculosis and lung cancer.
(2) Other cases of cancer.
(3) Chronic diseases like diabetes mellitus, hypertension, etc.
(4) Any liver, renal and muscular disorders.
(5) Known HIV positive cases.
The following parameters were evaluated i.e., total protein, albumin, globulin, LDH in serum and pleural effusion secondary to tuberculosis and cancer. Evaluation of these parameters were done in EM 360 auto analyser using commercially available kits provided by Transasia Diagnostics Ltd. Total protein was assayed by modified biuret method, albumin by bromocresol green end point assay method and LDH by modified IFCC method. Globulin (total Protein – albumin) and Serum-Effusion Albumin Gradient (serum albumin – pleural fluid albumin) was calculated mathematically.
After taking informed consent from patients pleural fluid was collected by thoracocentesis done by Department of Pulmonary Medicine and 4mL blood was collected in Serum Separation Tube (SST) by venipuncture under aseptic condition. Serum was separated after allowing the blood to stand for 30 min at Room Temperature (RT) and then centrifuged at 2000 rpm for 5 min. Fresh samples was used for our study.
Statistical Analysis
Data was presented as mean ±SD, comparison between cases (TB and Cancer group) and with control group was done by ANOVA and comparison between each of the group was done by Unpaired Student’s t-test. The p-value <0.05 was considered as statistically significant. Statistical analysis was done by using licensed SPSS 16.0 software (SPSS Inc., Chicago, IL, USA) for windows. We have used MS Excel licensed software to present and to prepare charts and graphs of our present study data.
Results
The demographic distribution of our study population for the pulmonary tuberculosis and lung cancer group is shown in [Table/Fig-1]. Patients with tuberculosis were significantly of lower age group than lung cancer group with p-value <0.0001. The predominance of female (37%) was more in tuberculosis group than in lung cancer group (14%).
Demographic distribution of study population.
| Pulmonary Tuberculosis group | Lung Cancer Group | Control Group |
|---|
| Male | 63 | 43 | 63 |
| Female | 37 | 7 | 37 |
| Mean Female age (yrs) | 40.918 ±13.781 | 62.428±7.656 | 40.287±13.757 |
| Mean Male age (yrs) | 45.46±13.525 | 58.186 ±8.764 | 45.662±13.635 |
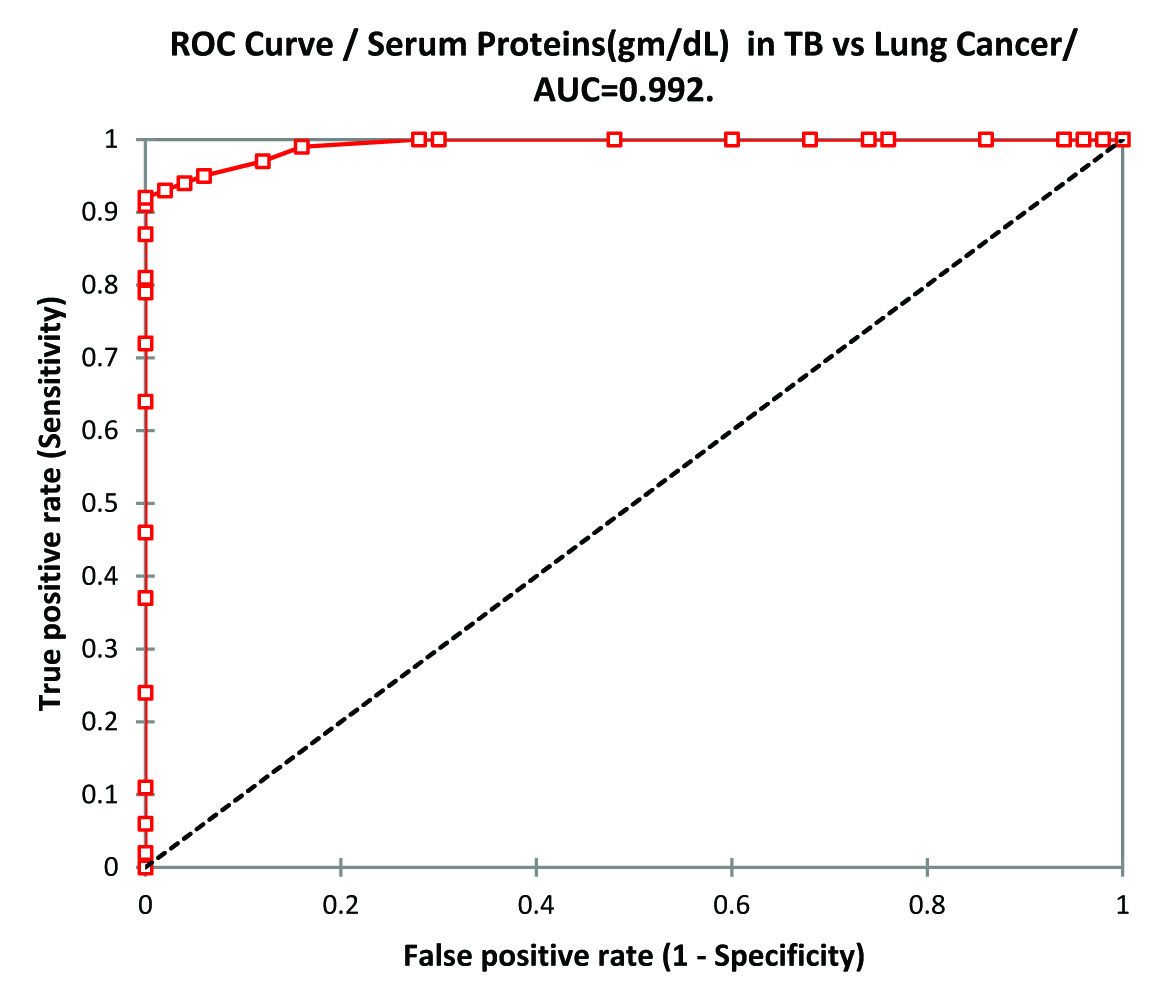
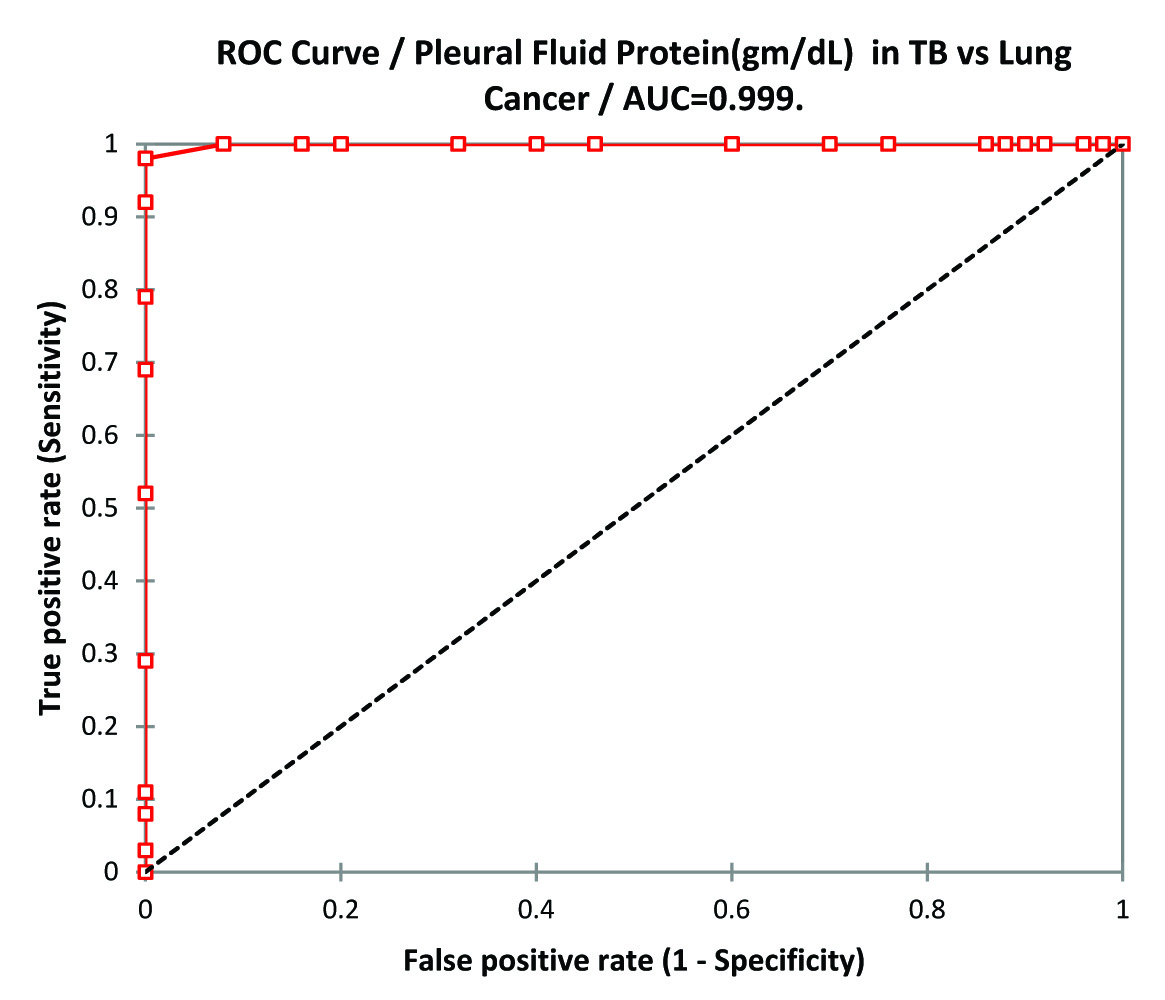
The biochemical analysis of serum and pleural fluid total protein, albumin, globulin (gm/dL) is shown in [Table/Fig-2] which shows serum and pleural fluid protein concentration in tuberculosis group was significantly higher than lung cancer group (p-value <0.0001) but both were significantly less than that of control group (p-value <0.01). ANOVA of serum total proteins in TB, lung cancer and control group was p-value 0.00 and F-value 400.462. When plotted in ROC curve in TB vs. Lung Cancer the best cut-off values for serum Proteins was 6.2gm/dL(sensitivity 92.0%, Specificity 100%) [Table/Fig-3]. For Pleural Effusion best cut-off value was 4.5 gm/dL (sensitivity 98.0%, specificity 100%) [Table/Fig-4].
Values of total protein, albumin, globulin (gm/dL) in tuberculosis, lung cancer and control groups.
| Tuberculosis Group | Lung Cancer Group |
|---|
| Serum | Pleural fluid | Serum |
|---|
| TP | Albumin | Globulin | TP | Albumin | Globulin | TP | Albumin | Globulin |
|---|
| 6.865± 0.399gm/dL*vs. Cancer ‘p’ <0.0001*vs. Control‘p’ <0.01 | 3.932± 0.344gm/dL*vs.Cancer ‘p’ <0.0001*vs. Control ‘p’ <0.0001 | 2.933± 0.439gm/dL*vs. Cancer ‘p’ <0.0001*vs. Control ‘p’ =0.2189 | 4.94± 0.2gm/dL*vs. Cancer ‘p’ <0.0001 | 3.232± 0.331gm/dL* vs. Cancer ‘p’ <0.0001 | 1.709± 0.378gm/dL*vs. Cancer ‘p’ <0.0001 | 5.304 ± 0.383gm/dL*vs. TB ‘p’ <0.0001*vs. Control ‘p’ <0.0001 | 3.252 ± 0.342gm/dL* vs. TB ‘p’ <0.0001*vs. Control ‘p’ <0.0001 | 2.052± 0.233gm/dL*vs. TB ‘p’ <0.0001*vs. Control ‘p’ <0.0001 |
| Lung Cancer Group | Control Group |
|---|
| Pleural Fluid | Serum |
|---|
| TP | Albumin | Globulin | TP | Albumin | Globulin |
|---|
| 3.904±0.416gm/dL*vs. TB ‘p’ <0.0001 | 2.626± 0.359gm/dL*vs. TB ‘p’ <0.0001 | 1.278± 0.309gm/dL*vs. TB ‘p’ <0.0001 | 7.011±0.319gm/dL | 4.138±0.406gm/dL | 2.873± 0.208gm/dL |
| ANOVA analysis of TB, Lung Cancer & Control Groups |
|---|
| Serum Proteins | Serum Albumin | Serum Globulin | Serum LDH |
|---|
| ‘p’=0.00F=400.462, F crit=3.0323between groups SS=107.864 df=2, MS=53.932Within groups SS=33.2646, df=247, MS=0.1346 | ‘p’=0.00F=96.734, F crit=3.0323between groups SS=26.645, df=2, MS=13.322within groups SS=34.018, df=247, MS=0.1377 | ‘p’ =0.00F=136.9624 F crit=3.0323between groups SS=29.148 df=2, MS=14.5740Within groups SS=26.283, df=247, MS=0.1064 | ‘p’=0.00F=978.29 F crit=3.0323between groups SS=1749429, df=2, MS=8747148Within groups SS=2208489, df=247, MS=8941.251 |
ROC Curve analysis of Serum Proteins in TB vs Lung Cancer.
ROC Curve analysis of Pleural Fluid Proteins in TB vs Lung Cancer.
Albumin in serum as well as pleural fluid in tuberculosis group was significantly higher than lung cancer group (p-value<0.0001) but both were significantly less than that of control group (p-value <0.0001). ANOVA of serum albumin in TB, lung cancer and control group was p-value 0.00 and F value 96.734.
Globulin in serum and pleural fluid was significantly higher in tuberculosis group than lung cancer group (p-value<0.0001). Serum globulin was higher in TB group than control group but found to be statistically insignificant (p-value=0.2189) but serum globulin was significantly low in lung cancer group than control group (p-value <0.001). ANOVA of serum globulin in TB, lung cancer and control group was p-value 0.00 and F-value 136.9624.
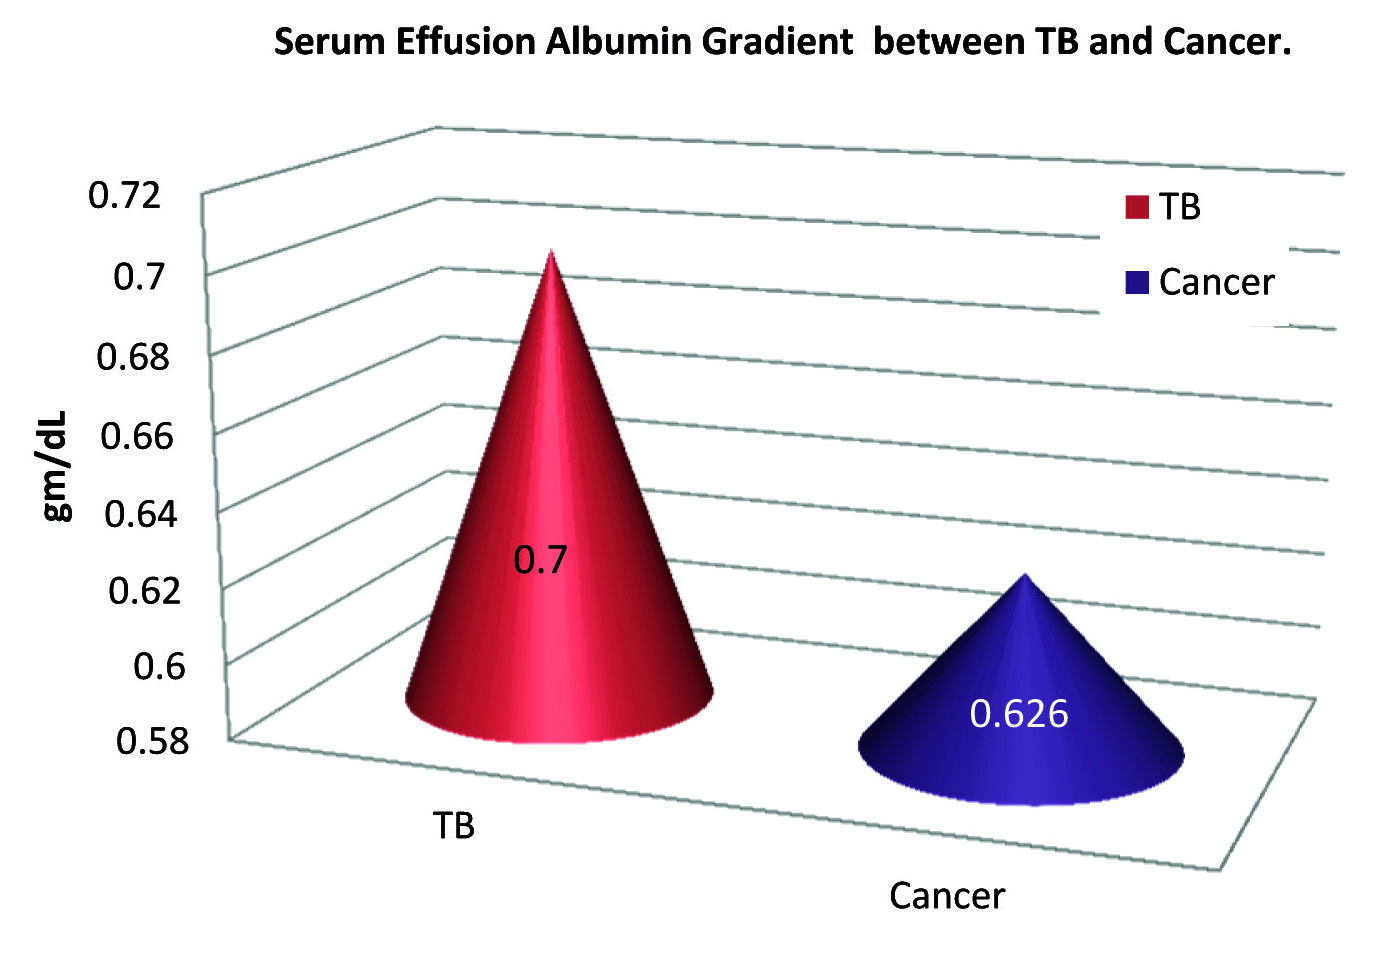
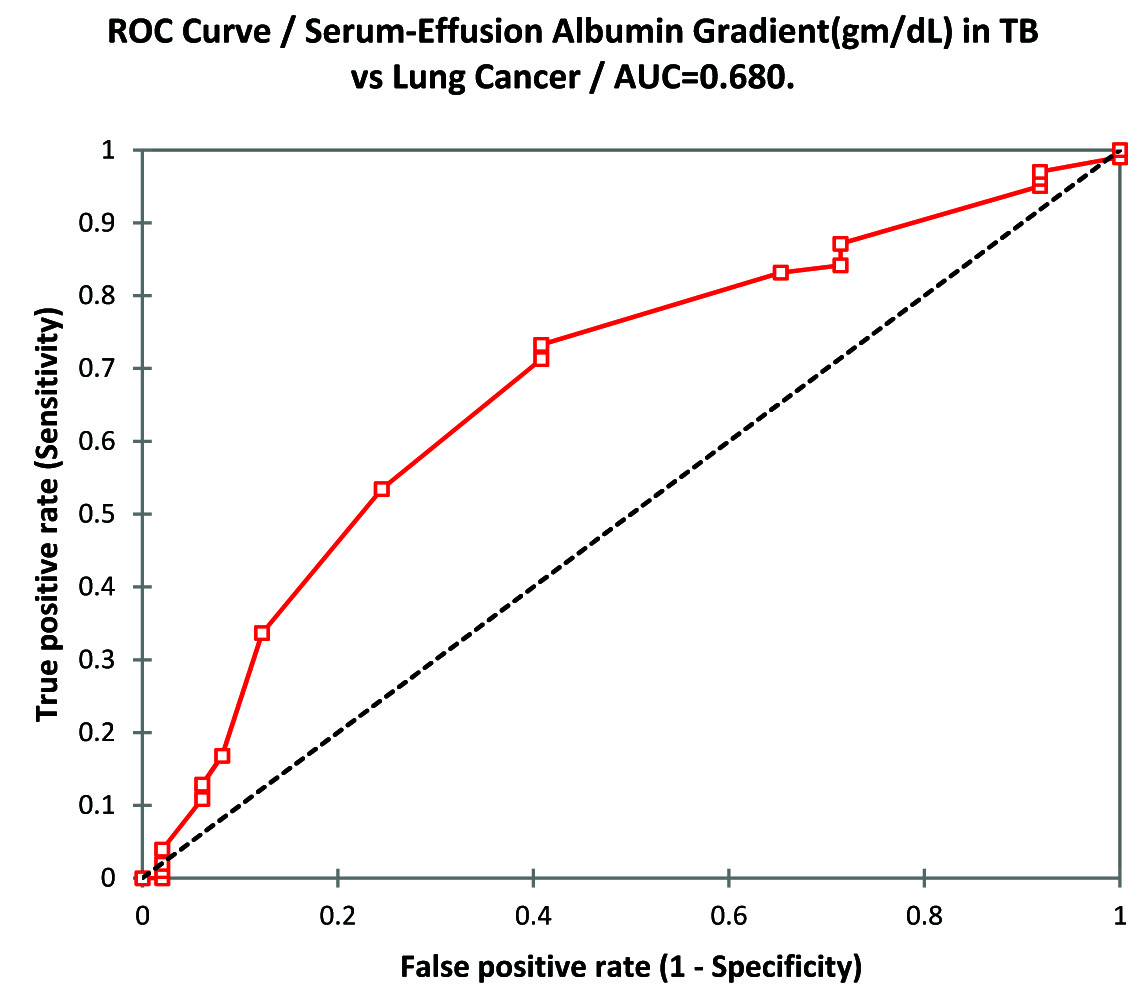
The calculated values of Serum Effusion Albumin Gradient (SEAG) is also significantly higher in TB group than lung cancer group (SEAG of TB group 0.70±0.135 gm/dL vs. 0.626±0.136 gm/dL in lung cancer group; p-value<0.002). The data is presented as [Table/Fig-5]. The ROC curve analysis shows cut-off values of SEAG 0.6 gm/dL (sensitivity 73.3% and specificity 59.2%) [Table/Fig-6].
Mean serum effusion albumin gradient in TB and lung cancer (gm/dL).
ROC curve analysis of serum effusion albumin gradient in TB vs lung cancer.
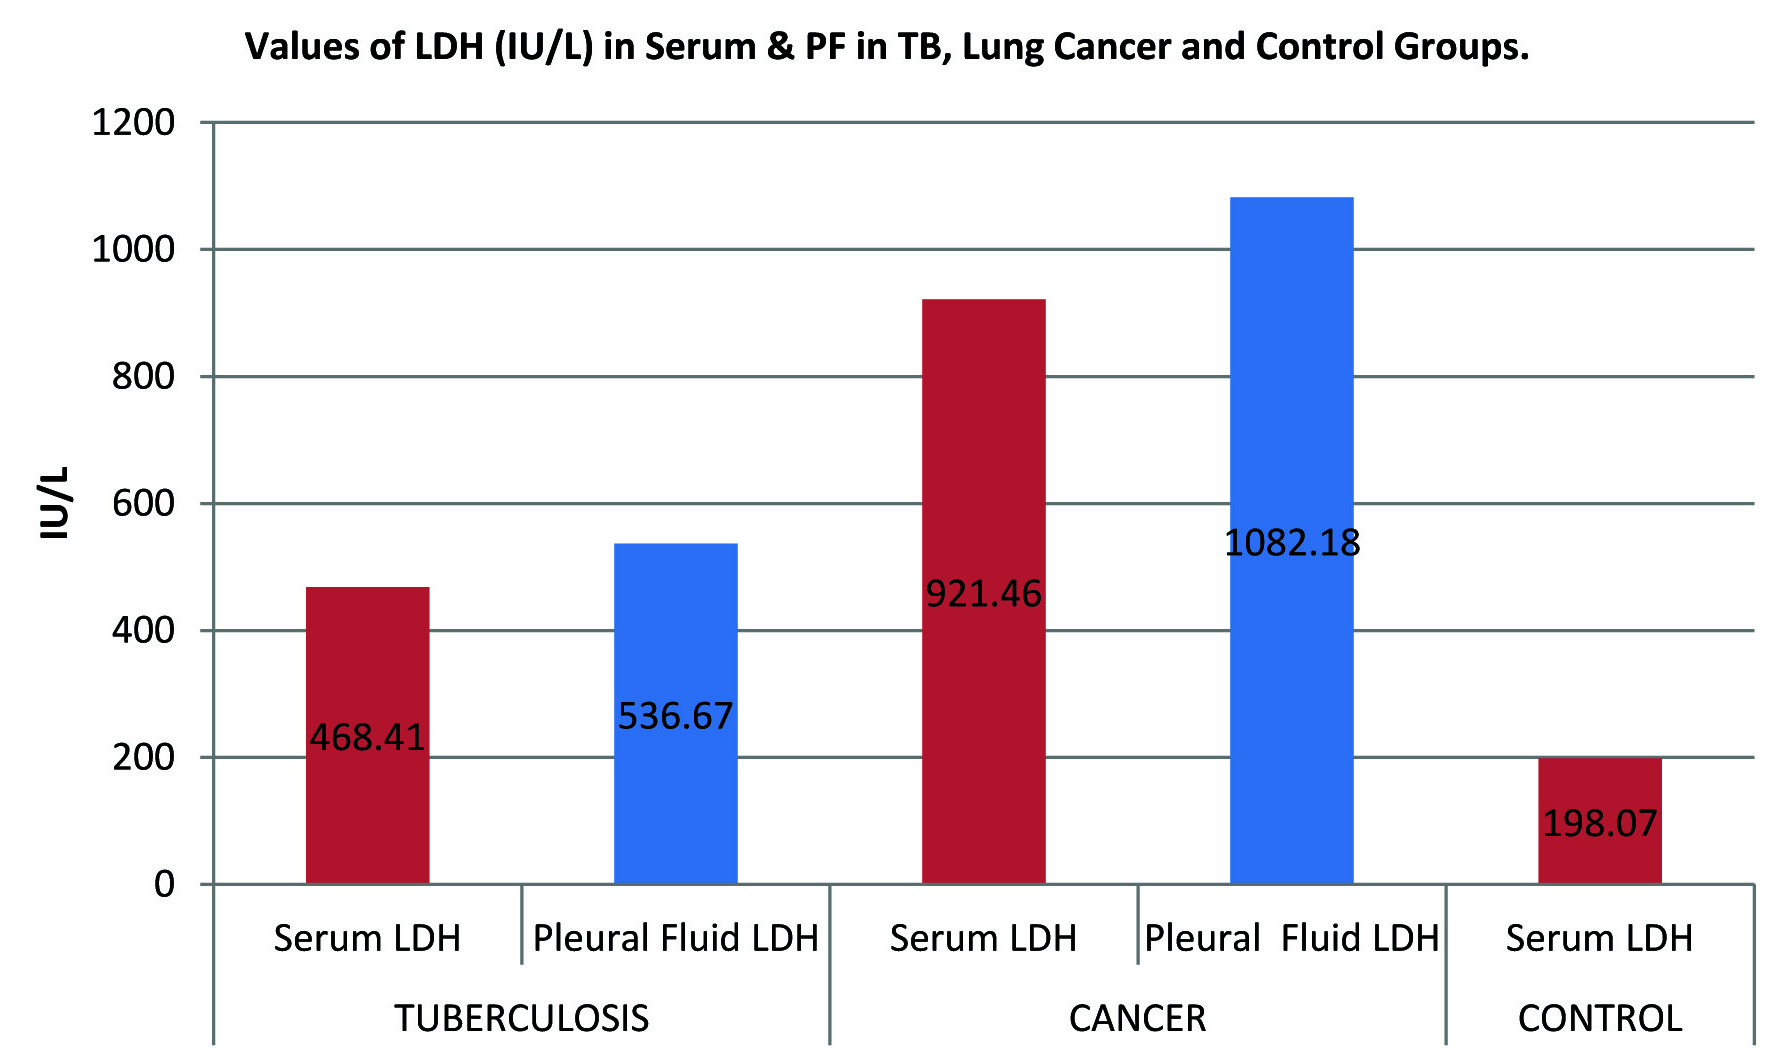
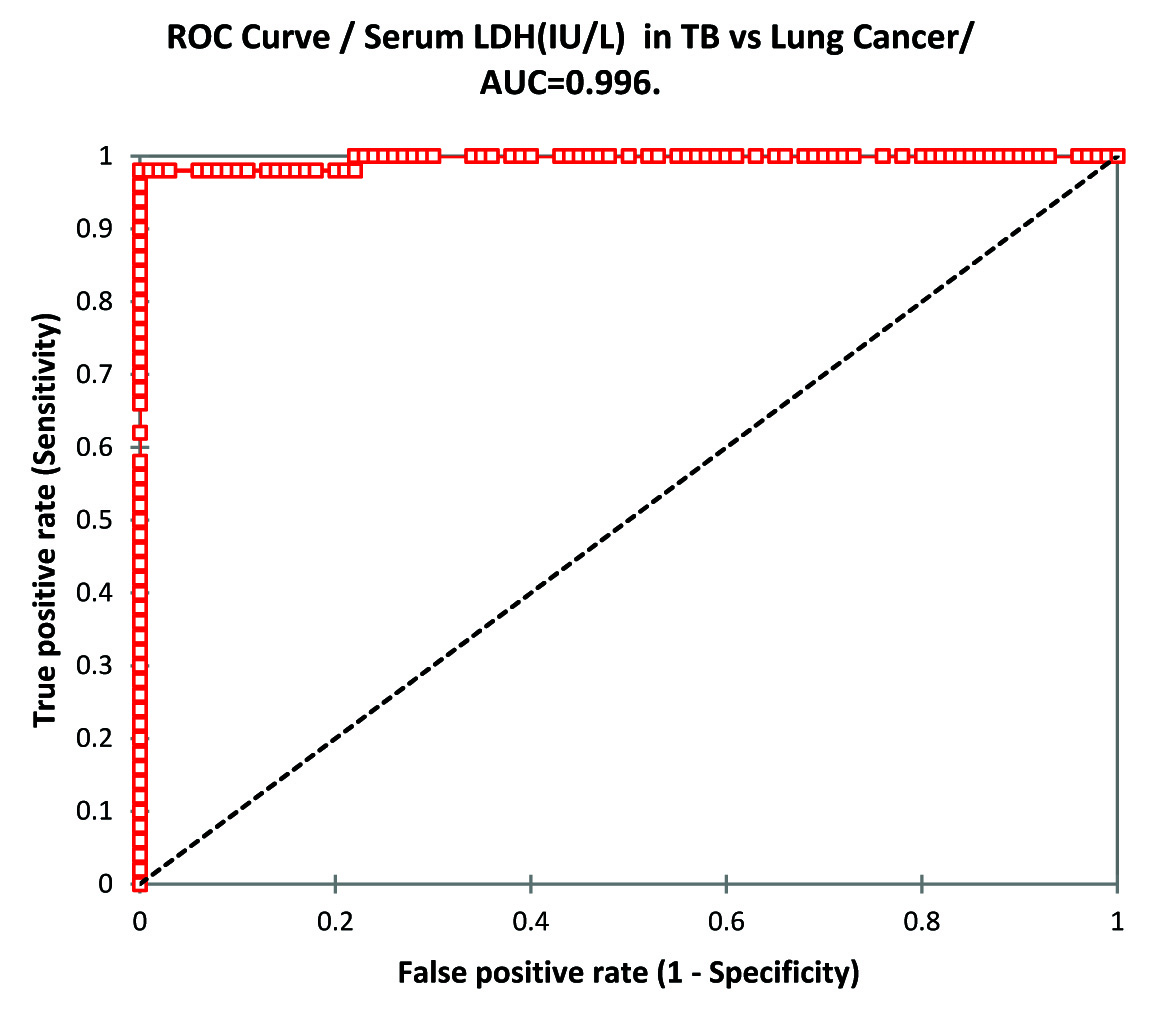
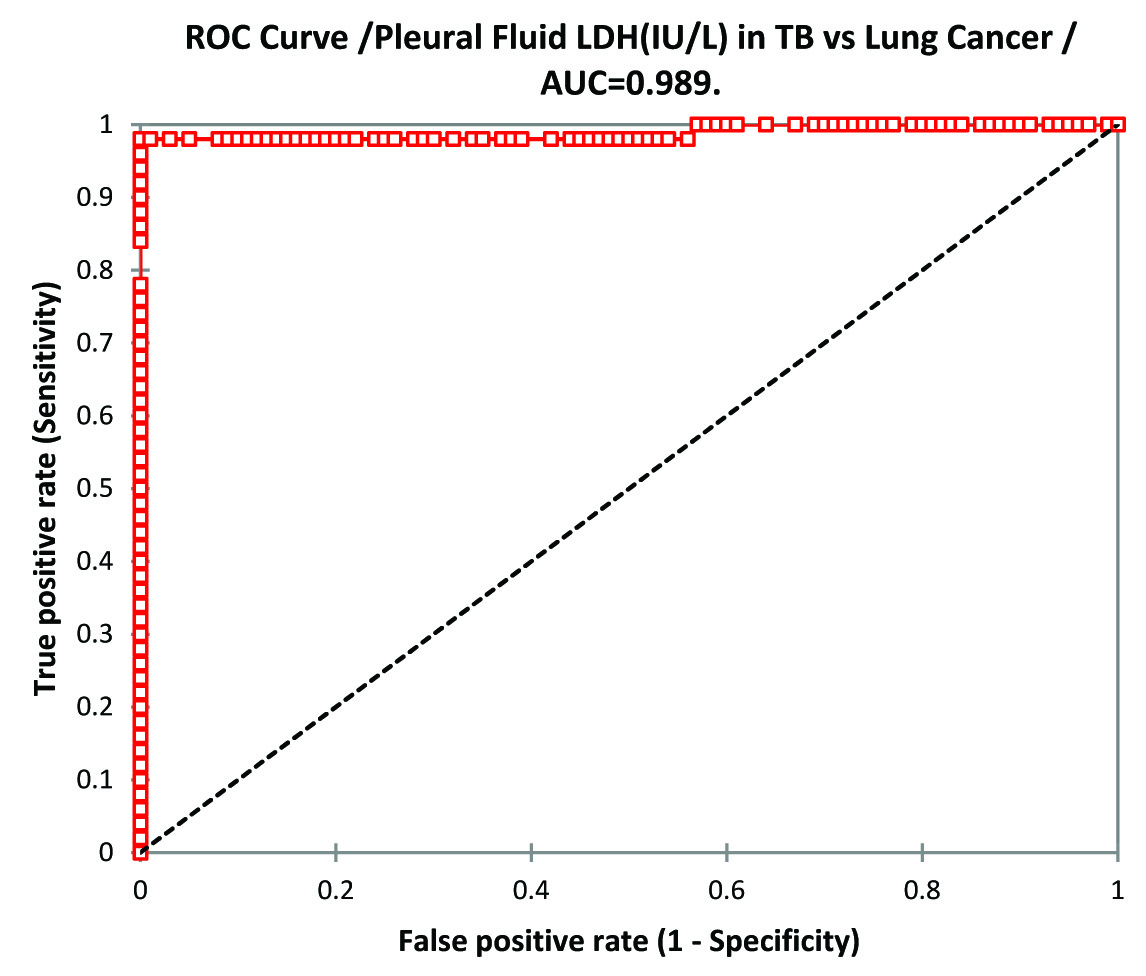
LDH (IU/L) in serum and pleural fluid of lung cancer group was significantly higher than TB group (p-value<0.0001). Serum LDH in lung cancer as well as TB group was significantly higher than control group (p-value <0.0001). ANOVA of serum LDH in TB, lung cancer and control group was p-value 0.00 and f-value 978.29. The data is illustrated in [Table/Fig-7]. ROC curve analysis of serum LDH in TB vs. lung cancer shows to have best cut-off value 659.0 IU/L(sensitivity 98.0% and specificity 100%) [Table/Fig-8] and for Pleural effusion the best cut-off value was 703.0IU/L (sensitivity 98.0% and specificity 100%) [Table/Fig-9].
Mean values of LDH (IU/L) in Serum & PF in TB, Lung Cancer and Control Groups.
ROC Curve analysis of Serum LDH in TB vs Lung Cancer.
ROC Curve analysis of Pleural Fluid LDH in TB vs Lung Cancer.
Discussion
Specific and systematic approach towards the classification of pleural effusion permits the diagnosis of a large number of pleural diseases, especially when considering the high incidence of pulmonary tuberculosis and lung cancer in India. In our study with respect to gender we have found that men are more predisposed to both tuberculosis and lung cancer (63% in TB cases and 86% in lung cancer cases) which is similar to other global studies [13–15] although incidence of lung cancer is increasing alarmingly in females who are basically never smokers [16], in our study we have got 7 cases out of 50 cases suffering from lung cancer in which 4 cases are having adenocarcinoma, 2 cases of squamous cell carcinoma and 1 case of large cell carcinoma which is following similar pattern according to incidence rate as studied by Noronha V et al., [7]. In the present study, as a rule first we have analysed and segregated exudates arising from TB and malignancy by Light’s criteria and Roth et al., followed by confirmation by our diagnostic criteria and then subjected to further analysis [8,12].
Serum as well as pleural effusion total protein, albumin and globulin were significantly higher in tuberculosis group than lung cancer group (p-value <0.0001) but both were less when compared to control group (p-value <0.0001) only globulin was higher in TB group than control group but statistically it was found insignificant (p-value=0.2189) which is in agreement with other studies conducted by Damburam et al., Nnodim et al., Akiibinu et al., Adedapo et al., MC Dhar et al., but in variance with studies by Sasaki et al., Yamanaka et al., and Jemikalajah et al., [17–24]. Upon ROC analysis serum protein concentration can be used as an efficient tool as the best cut-off value observed was 6.2gm/dL with sensitivity of 92% and specificity of 100%. The total protein concentration in pleural effusion of tuberculosis group is more than 4.5 gm/dL (our mean±SD is 4.94±0.202) which is in agreement with results obtained by Liam et al., and Melo et al., [25,26]. From ROC analysis the best cut-off value was 4.5 gm/dL with sensitivity of 98% and specificity of 100% thus can again be an efficient diagnostic tool to differentiate lung cancer cases from tuberculous effusion cases.
SEAG is calculated mathematically(serum albumin-pleural fluid albumin) in both the groups i.e., tuberculous and malignant effusion groups and we found that value in tuberculous group is significantly higher than malignant group with p-value<0.002 which is again in agreement with study conducted by MC Dhar et al., but on ROC analysis it was observed as not so significant tool as best cut-off value observed was 0.6gm/dL with sensitivity of 73.3% and specificity of only 59.2% [20].
Lactate Dehydrogenase (LDH), a non-specific inflammatory marker [27] is significantly increased in serum and pleural fluid of both tuberculosis and cancer group than control group with p-value <0.0001 (control serum LDH is 198.07±69.594) but it is more elevated in cancer group than tuberculosis group with p-value <0.0001 in both serum and pleural fluid of cancer group when compared with tuberculous group which is in agreement with the study conducted by Leila Antonangelo et al., which suggests greater extent of pleural disease or the presence of blood in the pleural cavity [28,29]. On ROC analysis the serum and pleural fluid LDH concentration was found to be most effective diagnostic tool to differentiate lung cancer cases from tuberculous effusion cases (serum LDH best cut-off value was 659.0IU/L with sensitivity 98% and specificity of 100% and pleural fluid LDH the best cut-off value was 703.0IU/L with sensitivity 98% and specificity 100%).
Limitation
The limitation of our study is limited sample size and study was conducted in a single region. Larger sample size and multi-centric studies could be done to obtain wider insights.
Conclusion
Biochemical analytes like total protein, albumin, globulin, SEAG and LDH levels in serum and pleural fluid may be useful and efficient tool to differentiate between two common exudative cases i.e. tuberculosis and lung cancer along with other specific test. As these tests are easy, inexpensive and thus can help us in early segregation of lung cancer cases from pulmonary tuberculosis in primary health care setup.