Introduction
Spinal tuberculosis presents a radiological challenge in many cases when it presents with atypical pattern of involvement and has to be distinguished from various differentials, which include metastases. In such cases Diffusion Weighted Imaging (DWI) with Apparent Diffusion Co-efficient (ADC) value may play a role in reaching towards a conclusion, thereby preventing unnecessary biopsy in such patients.
Aim
Measurement of mean ADC values in tubercular vertebrae and associated collection.
Materials and Methods
The study was comprised of 55 patients and was conducted on 3.0 TESLA Siemens machine Magnetom Verio. Patients either known to have tuberculosis or those with classic tuberculous findings were included in the study. All these patients were followed up for post-treatment confirmation and ADC value. All the patients underwent routine MRI along with DW-MRI sequence, ADC values and FNAC/ Biopsy if required.
The ADC values were calculated from the involved vertebral bodies and surrounding soft tissue and also from normal vertebrae preferably from one above and below the affected vertebrae to establish ADC of normal vertebrae, which was helpful in treatment response in patients with antitubercular therapy. At least six ADC value was taken from affected vertebrae and soft tissue.
Results
The mean ADC value of tubercular vertebrae was found out to be 1.47 ± 0.25 x 10⁻³ mm2/sec, of adjacent soft tissue collection (abscess) was 1.94 ± 0.30 x 10⁻³ mm2/sec and normal vertebrae was 0.48 ± 0.16 x 10⁻³ mm2/sec. ADC value of post treated vertebrae decreased and complete resolution showed ADC near normal vertebrae.
Conclusion
Normal range of the ADC values in spinal tuberculosis and associated paravertebral collection may be helpful in the differentiation of spinal tuberculosis from lesions with spinal involvement which are not proven to be tuberculosis and who did not have the classical appearance of either tuberculosis or metastasis. But there exists a zone of overlap of ADC values in metastatic and tubercular vertebrae, which can lead to false negative results. Therefore, in overlap cases there should be correlation with clinical history, other related investigations or biopsy.
Introduction
Diffusion Weighted Magnetic Resonance Imaging (DWI or DW-MRI) is an imaging method that uses the brownian motion of water molecules to generate contrast in Magnetic Resonance (MR) images. By this method the diffusion process of the water molecules can be measured in vivo in biological tissue. Since the beginning of the 1990’s, DWI has been successfully applied for the early diagnosis of ischemia in the Central Nervous System (CNS) [1]. The emergence of new MR systems and faster imaging pulse sequences has led to use of DWI in the body and spine.
DWI is typically performed using at least two b-values (e.g., b = 0 s/mm2 and other b-value from 0 to 1,000 s/mm2) to enable meaningful interpretation; the higher the b-value, the greater the degree of signal attenuation from water molecules [2]. Diffusion weighted scans are characterized by the b-value (in s/mm2), which is a function of diffusion gradient strength [3,4]. The b-values used in diffusion imaging of spine vary considerably. Commonly used b-values include 0, 400, 500, 800 and 1000 and at least three b-values are used in spine [5–8].
The Apparent Diffusion Co-efficient (ADC) depicts the specific diffusion capacity, microscopic structure and organization of a biological tissue [9]. A loss of signals occurs as a result of the restriction of the movements of the molecules in the diffusion – sensitivity sequences and this loss is measured by calculating the ADC [10].
The areas of restricted diffusion will appear to be higher in signal intensity on DW images; these areas will appear as low signal intensity areas (opposite to DW images) on the ADC map and suggest high cellular areas [2]. The higher the ADC value (means no restriction), the lesser the compactness or cellularity of the tissue or viscosity of the fluid [7]. The ADC is independent of magnetic field strength and can be compared if done on different MR machines [2].
The ADC value is automatically calculated by MR scanner by placing smallest Region of Interest (ROI) on area of interest. The mean ADC value within ROI is provided by MRI software and is expressed in unit of mm2/s (eg.1.0 to 1.1 x 10⁻³mm2/s or 1000-1100 x 10-6mm2/s). Generally restriction means an ADC value less than 1.0-1.1 x103mm2/sec, however there is no uniform agreement on it [11].
There is more free water content in the marrow in benign vertebral body involvement as compared to malignant infiltration. In malignant infiltration, there is dense compact tumor infiltration, which inhibits free movement of water molecules, thereby causing diffusion restriction [12]. The areas of restricted diffusion appear bright on DW-MRI and dark on ADC mapping [7].
Many studies have been performed to evaluate the efficacy of DW-MRI in differentiating malignant and benign vertebral body involvement; in these studies the benign lesions included infections, traumatic, osteoporotic vertebral body involvement [7]. The ADC values in lesions caused by malignant infiltrations are significantly lower than in benign osteoporotic lesions. This difference can be explained by the structure of the cancerous tissue, containing a dense network of tumor cells, which restricts the self-diffusion of the water molecules. In benign lesions the interstitial volume in the oedema is expected to be increased, leading to an increase of the self- diffusion in the lesion and increased ADC value [1].
Spinal Tuberculosis (TB), also called Pott’s spine, is quite common in India. It can be confidently diagnosed on MRI if there are classical TB findings. The classical form is contiguous involvement of the vertebrae and the intervening IV disc (diskitis) with marrow oedema of the vertebrae and erosive changes in the apposing vertebral endplates. There may be associated anterior subligamentous collection with cranio- caudal extension and it may cause erosion of the anterior margin of the vertebral bodies with marrow oedema distant from the primary infection site. There may be posterior extension of the tuberculous process as epidural collection causing compression of thecal sac or cord with neurological complication [13].
More frequently detected extension is anterolaterally, forming paravertebral and/or psoas abscess. Paravertebral abscesses form early and are easily seen in the thoracic region as posterior mediastinal masses [13].
Any tuberculous vertebral lesion, which does not have the classical/typical features mentioned above, is referred to as atypical spinal TB. The more common atypical spinal TB is in the form of spondylitis without discal involvement, showing multifocal vertebral involvement without associated disc destruction [13].
Collapse of a vertebral body, particularly the anterior segment, may result in tuberculous kyphosis. Calcification within abscess is virtually pathognomonic of tuberculosis [14].
TB is a great mimicker and may have varied imaging presentations. In this prospective study, we aim to quantify and evaluate apparent diffusion coefficient values in cases of spinal tuberculosis by MRI diffusion weighted imaging. This may help in cases where classical features of spine TB are not present and may increase diagnostic confidence in doubtful cases and decrease the need for biopsy.
Materials and Methods
The study comprised 55 patients and was conducted on 3.0 TESLA Siemens machine Magnetom Verio. Patients either known to have tuberculosis or those with classic tuberculous findings were included in the study. All these patients were followed up for post-treatment confirmation and ADC value and FNAC/ Biopsy if required.
Details of clinical history, other related investigations, family history of tuberculosis, anti-tubercular treatment, etc. were taken from all patients before MRI examination. All patients underwent a routine plain MRI of the spine. DW-MRI was also performed in the same sitting in sagittal images and at least six ADC values were taken from affected vertebrae and soft tissue.
The MRI protocol included T1 sagittal; T2 sagittal and axial; STIR coronal and sagittal and post contrast sagittal and axial. Slice thickness was 3.0 mm. Field of view (FOV) was 28-32 cm.
The MRI pulse sequence used for DW-MRI was single-shot echo-planar sequence. Sagittal DW-MRI was performed at b-values of 0, 400, and 800. ADC values were taken from the abnormal as well as pre/paravertebral or anterior epidural collection if present. The ADC value was also taken from two normal appearing vertebral bodies, one cranial and other caudal to the affected vertebrae. ADC values were measured on the sagittal images, because of ease to measure ADC values from normal vertebrae adjacent to the abnormal vertebrae. Six ADC values were calculated in each patient from infected vertebral bodies and from the adjacent soft tissue collection, if present. The final mean ADC value in all the proven cases of tuberculosis was calculated.
ADC values from the unaffected vertebrae above and below were also obtained in these patients. All known cases of spinal tuberculosis and those with classical radiological features were included in this study. The patients were followed up till a diagnosis was established or FNAC/Biopsy was performed if required. All patients fulfilling these criteria were included irrespective of their age group and gender.
Exclusion criteria included patients with spine involvement due to trauma, osteoporotic collapse, or any known disease other than tuberculosis. Patients without any follow-up or those lost to follow-up were also not included.
Results
Number of patients initially included was 85; 30 patients were excluded from this study as they were lost on follow-up. Fifty-five patients were followed up at various intervals of time within the limits of the study period (17 months from December 2013 to June 2015). Age group upto 75 years were included.
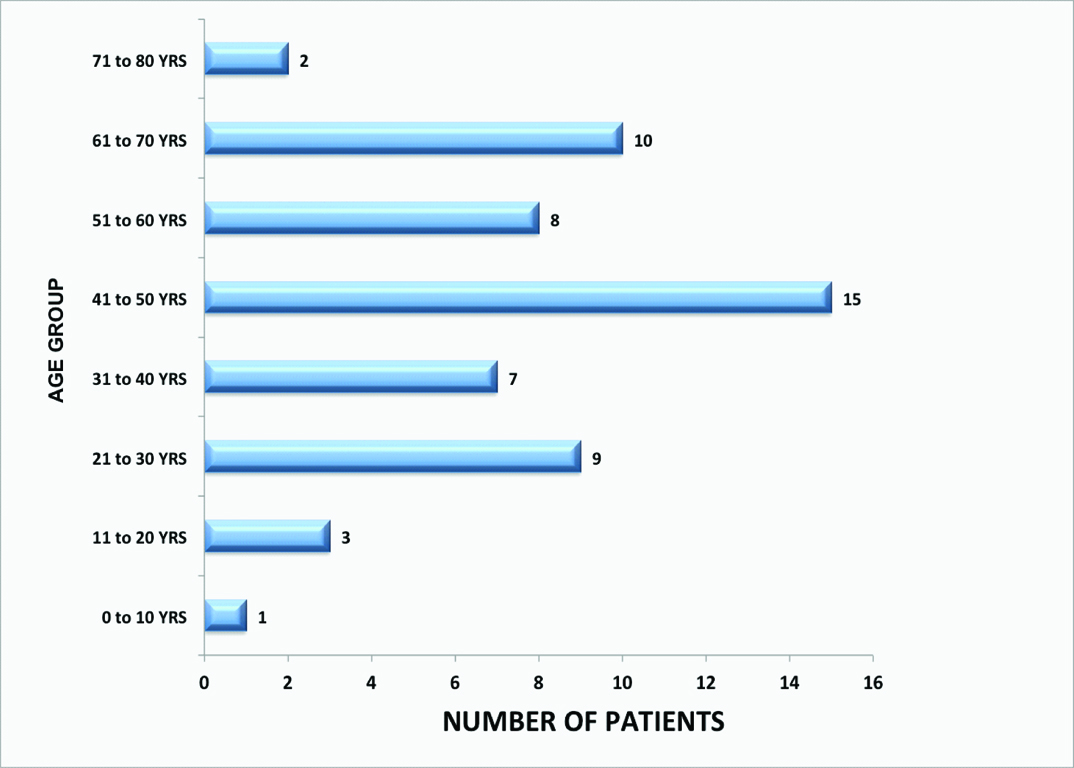
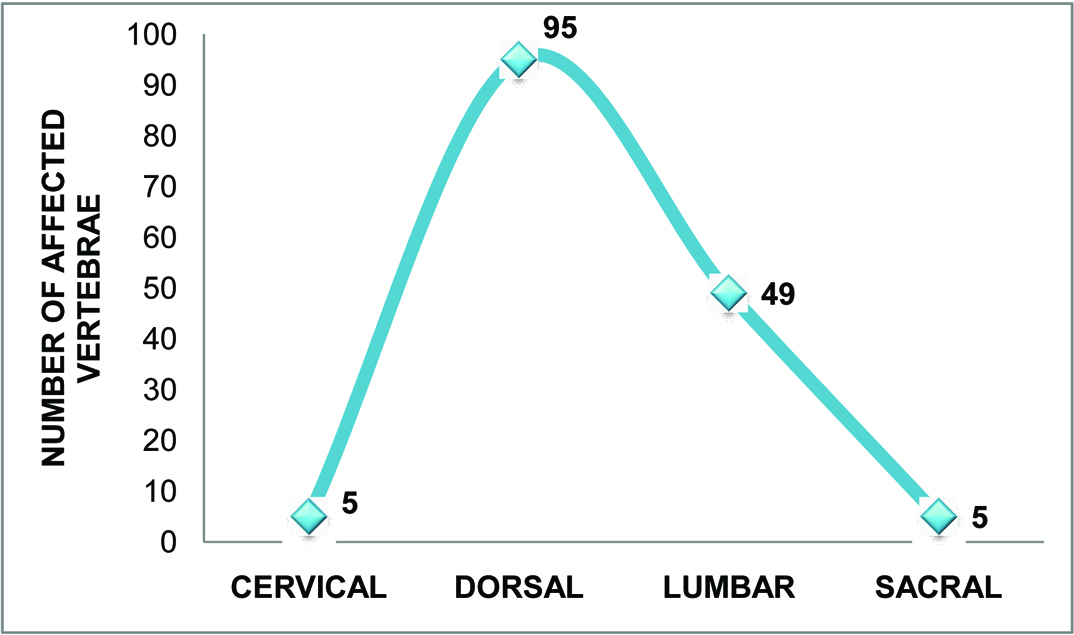
This study included fifty-five patients (35 male and 20 female) [Table/Fig-1] with either known tuberculosis or classic tuberculous findings. The youngest patient was 3 years old and the eldest was 74-years-old. The highest number of patients,15(27.3%) were in age group 41-50 years and the least in age group 01-10 years 1(1.8%) [Table/Fig-1]. Total 154 vertebrae were involved, out of which 5 were cervical (3.24%), 95 were dorsal (61.7%), 49 were lumbar (31.82%) and 5 were sacral (3.24%), [Table/Fig-2].
Bar chart representing distribution of pott’s spine according to age (55 patients).
Graph representing distribution of involved vertebrae in spinal tuberculosis (55 patients, total 154 vertebrae involved).
Fifty-three patients showed multiple vertebrae involvement while only 2 patients had solitary vertebral involvement. Total of 24 patients had adjacent soft tissue collection [Table/Fig-3,4,5,6 and 7].
Altered signal intensity is seen involving D6, D7 and D8 vertebral bodies and posterior elements with pre/ paravertebral collection. Diffusion images show ADC value of 1.24 x 10⁻³ mm2/sec from affected vertebral body and 2.60 x 10⁻³ mm2/sec from adjacent soft tissue involvement.

Contiguous vertebrae involvement L2 and L3 vertebral bodies with diskitis. The cortical endplates show moderate irregularity with formation of epidural collection causing moderate compression over thecal sac. ADC value from anterior epidural collection is 2.02 x 10⁻³ mm2/sec.

Signal alterations in C7 to D2 vertebral bodies and their posterior elements. C7/ D1 I.V. disc shows diskitis. D1 vertebral body is partially collapsed with abrupt altered curvature leading to kyphotic deformity. An epidural collection causing significant cord compression with myelopathic changes. Diffusion study showed ADC of 1.36 x 10⁻³ mm2/sec in the involved vertebra.

Altered signal intensity from D7 to D12 vertebral bodies along with diskitis and involvement of their posterior elements. Large prevertebral/ paravertebral collection is seen. The observed ADC values from affected vertebrae were 1.27 x 10⁻³ mm2/sec, 1.11 x 10⁻³ mm2/sec and 1.09 x 10⁻³ mm2/sec. Prevertebral collection demonstrated ADC value of 2.0 x 10⁻³ mm2/sec.

Follow up case of pott’s spine at L4 level. After 10 months of ATT, patient underwent MRI examination. Fatty changes noted with no enhancement in post contrast. No evidence of active infective process was noted. ADC value from L4 vertebra was 0.57 x 10⁻³ mm2/sec, which is close to normal vertebrae.

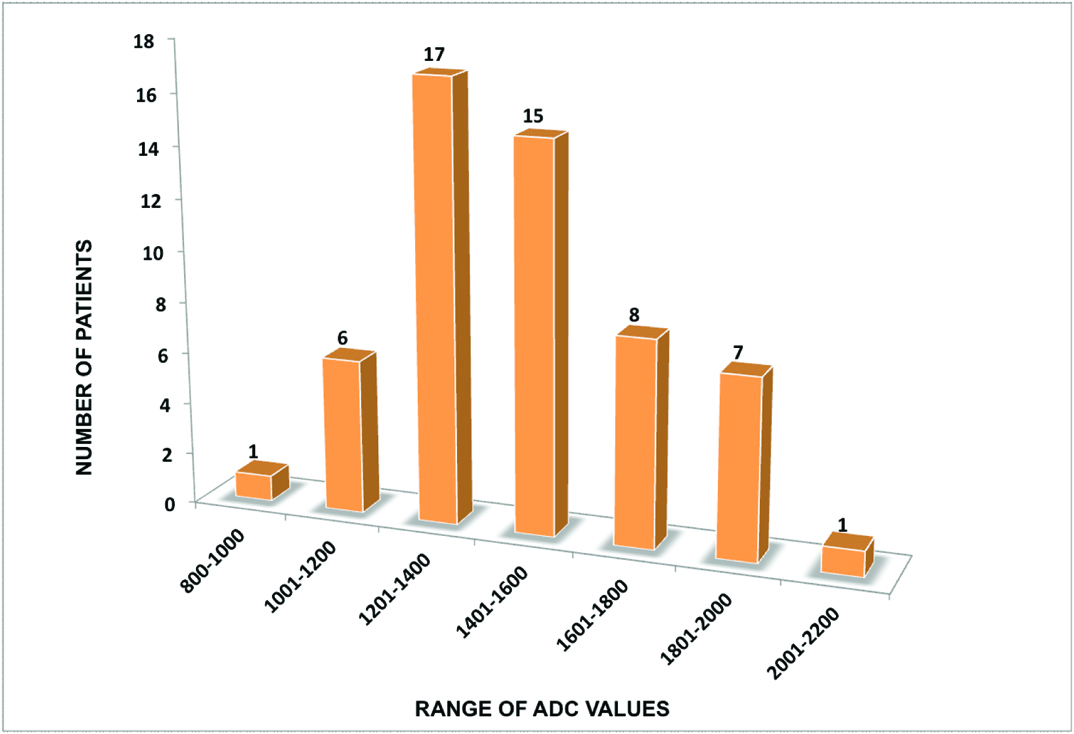
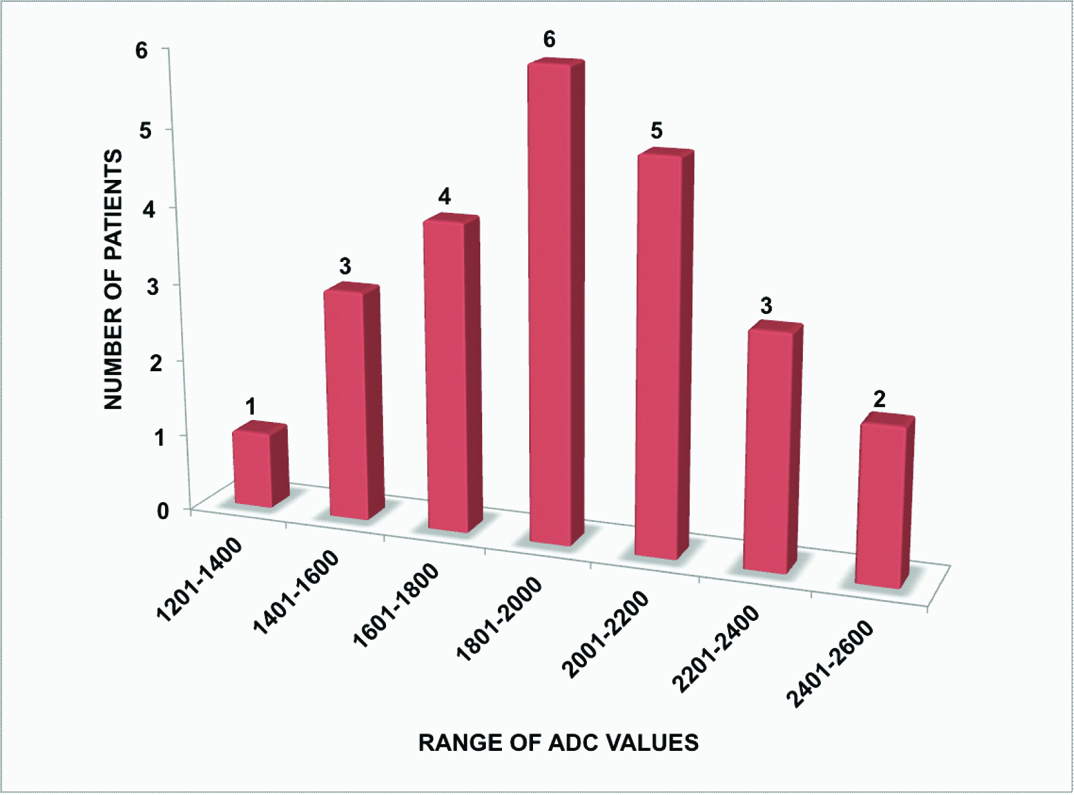
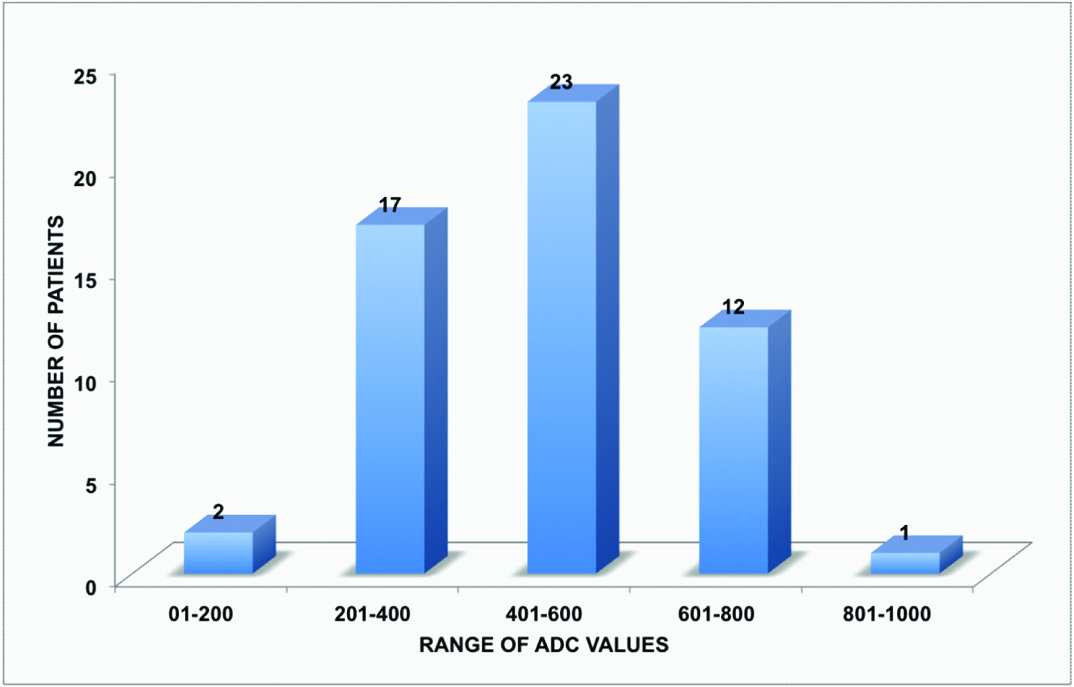
The ADCaverage range of tubercular vertebrae was from 0.99 x 10⁻³ mm2/sec to 2.12 x 10⁻³ mm2/sec with maximum number of patients in the range from 1.20 x 10⁻³ mm2/sec to 1.40 x 10⁻³ mm2/sec [Table/Fig-8]. The ADCaverage range of adjacent soft tissue collection was from 1.39 x 10⁻³ mm2/sec to 2.44 x 10⁻³ mm2/sec with maximum number of patients in range from 1.80 x 10⁻³ mm2/sec to 2.00 x 10⁻³ mm2/sec [Table/Fig-9]. The ADCaverage range of normal vertebrae was from 0.13 x 10⁻³ mm2/sec to 0.84 x 10⁻³ mm2/sec with maximum number of patients in the range from 0.40 x 10⁻³ mm2/sec to 0.60 x 10⁻³ mm2/sec [Table/Fig-10].
Bar chart representing distribution of ADC values in tubercular vertebrae (55 patients).
Bar chart representing distribution of ADC values in adjacent soft tissue collections (24 patients).
Bar chart representing distribution of ADC values in normal vertebrae above and below the infected vertebrae (55 patients).
Then the mean ADC value for all of the above was calculated. The mean ADC value of infected vertebrae was found out to be 1.47 ± 0.25 x 10⁻³ mm2/sec, of adjacent soft tissue collection was 1.94 ± 0.30 x 10⁻³ mm2/sec and normal vertebrae was 0.48 ± 0.16 x 10⁻³ mm2/sec.
Discussion
This study defines a normal range of the ADC values in spinal tuberculosis and associated paravertebral collection. The mean ADC value of tubercular vertebrae was 1.47 ± 0.25 × 10⁻³ mm2/sec (99% confidence interval - 1.38 × 10⁻³ mm2/sec to 1.56 × 10⁻³ mm2/sec; significant at 1% level of confidence) and of pre/ paravertebral collection was 1.94 ± 0.3 × 10⁻³ mm2/sec.
The mean ADC values of normal unaffected vertebrae (mean ADC of 0.48 ± 0.16 ×10⁻³ mm2/sec) were considerably lower than infected vertebrae (using paired t test, p-value <0.0001).
There was significant decline in ADC values of infected vertebrae after anti tubercular treatment, which led to the conclusion that ADC values were related to severity of disease process and declined in follow-up cases after they received treatment.
Taskin et al., conducted a study in 99 patients, 133 lesions to differentiate benign vertebral bone marrow lesions from malign lesions according to ADC values, enabling quantitative assessment. The mean ADC value of the benign induced acute compression fractures was significantly higher than that of the malign induced compression fractures. According to the optimal cut-off value of 1.32 x 10⁻³mm2/sec, determined for the differentiation of benign and malignant vertebral bone marrow lesions, sensitivity was 96.5%, specificity 95.2%, positive predictive value 96.5%, and negative predictive value 95.2% [10]. The ADCaverage range for tubercular vertebrae in our study was from 0.99 x 10⁻³ mm2/sec to 2.12 x 10⁻³ mm2/sec (mean ADC1.47 ± 0.25 x 10⁻³ mm2/sec). This could lead to an overlap between infective and metastatic lesions in few cases. The ADCaverage range in our study from adjacent soft tissue collection was from 1.39 x 10⁻³ mm2/sec to 2.44 x 10⁻³ mm2/sec (mean ADC 1.94 ± 0.30 x 10⁻³ mm2/sec).
This was helpful in cases of overlap, if soft tissue collection was present. Our ADC value findings for tubercular vertebrae were similar to the study conducted by Palle et al., to define a range of apparent diffusion coefficient values in spinal tuberculosis (the mean ADC value of affected vertebrae 1.4 ± 0.20 x 10⁻³mm2/sec). They also applied the derived ADC value of tubercular vertebrae on vertebrae with indeterminate aetiology to determine its ability in predicting tuberculosis. The sensitivity of this cut- off was 64.8%, the specificity 75% and positive predictive value 74.5%. The range of ADC values derived in their study was significantly different from the mean ADC values of normal vertebrae and metastatic vertebral lesions. However, there was an overlap of ADC values between tuberculosis and metastatic vertebrae in a few cases [7].
In our study, ADC value of paravertebral collection was significantly higher as compared to ADC values from infected vertebrae. We did not find any reference for comparison of the paravertebral collection. Balliu et al., evaluated 45 patients with altered signal intensity vertebral bodies on plain-film, CT, bone scintigraphy, conventional MR studies, biopsy or follow-up. All patients underwent isotropic DW-MR images (multi-shot EPI, b-values of 0 and 500 sec/mm2). The cause of altered signal intensity was benign osteoporotic collapse in 16, acute neoplastic infiltration in 15 and infectious processes in 14 patients [15] Mean ADC value from benign oedema (1.9 ± 0.39 x 10⁻³mm2/sec) was significantly (p < 0.0001) higher than untreated metastatic lesions (0.9 ± 1.3 x 10⁻³mm2/sec). Mean ADC value of infectious spondylitis (0.96 ± 0.49 x 10⁻³mm2/sec) was not statistically (p>0.05) different from untreated metastatic lesions. Their conclusion was that ADC values may help distinguishing benign fractures from malignant or infectious vertebral bone marrow lesions but was not valuable to differentiate infection from malignancy. The mean ADC value of infected vertebrae in our study was much higher andwas found out to be 1.47 ± 0.25 x 10⁻³ mm2/sec and of adjacent soft tissue collection was 1.94 ± 0.30 x 10⁻³ mm2/sec.
Bhugaloo et al., conducted a study for specificity and sensivity of DWI to differentiate benign from malignant vertebral compression fractures [16]. The Positive Predicative Value (PPV) and Negative Predictive Value (NPV) was both 90%. The quantitative assessment of ratio revealed a statistical significant difference between the benign (1.73 x 10- 3mm2/sec) and the malignant (0.96 x 10⁻³mm2/sec) group of lesion (Mann-Whitney U-test, p=0.0001).
Chan et al., studied the usefulness of the apparent diffusion coefficient (ADC) in differentiating between benign and malignant fractures. Mean combined ADCs were 0.23 x 10⁻³mm2/sec in normal vertebrae, 0.82 x 10⁻³mm2/sec in malignant acute vertebral fractures and 1.94 x 10⁻³mm2/sec in benign acute vertebral fractures [12]. In our study the Mean ADC of normal vertebrae was 0.48 ± 0.16 x 10⁻³ mm2/sec.
Conclusion
Normal range of the ADC values in spinal tuberculosis and associated paravertebral collection may be helpful in the differentiation of spinal tuberculosis from lesions with spinal involvement which are not proven to be tuberculosis and who did not have the classical appearance of either tuberculosis or metastasis.
But there exists a zone of overlap of ADC values in metastatic and tubercular vertebrae, which can lead to false negative results. Therefore a detailed clinical history and examination with routine MR sequences is must. ADC of tubercular collection may be helpful in addition.
[1]. Andreas B, Quantitative analysis of diffusion-weighted magnetic resonance imaging in the spine 2010 Ludwig Maximilian University of Munich [Google Scholar]
[2]. Koh D, Collins D, Diffusion-weighted MRI in the body: applications and challenges in oncologyAm J Roentgenol 2007 188(6):1622-35. [Google Scholar]
[3]. Beauchamp N, Ulug A, Passe T, van Zijl P, MR diffusion imaging in stroke: review and controversiesRadiographics 1998 18(5):1269-83. [Google Scholar]
[4]. Meyer J, Gutierrez A, Mock B, Hebron D, Prager J, Goray G, High-b-value diffusion-weighted MR imaging of suspected brain infarctionAm J Neuroradiol 2000 21:1821-29. [Google Scholar]
[5]. Melnyk A, Magnetic resonance imaging of the bone marrow 2013 1st editionHeidelbergSpringer [Google Scholar]
[6]. Tang G, Liu Y, Li W, Yao J, Li B, Li P, Optimization of b value in diffusion weighted MRI for the differential diagnosis of benign and malignant vertebral fracturesSkeletal Radiol 2007 36(11):1035-41. [Google Scholar]
[7]. Palle L, Reddy M, Reddy K, Role of magnetic resonance diffusion imaging and apparent diffusion coefficient values in the evaluation of spinal tuberculosis in Indian patientsIndian J Radiol Imaging 2010 20(4):279-83. [Google Scholar]
[8]. Bozgeyik Z, Onur M, Poyraz A, The role of diffusion weighted magnetic resonance imaging in oncologic settingsQuant Imaging Med Surg 2013 3(5):269-78. [Google Scholar]
[9]. Dewan K, Salama A, Habashy H, Khalil A, Evaluation of benign and malignant vertebral lesions with diffusion weighted magnetic resonance imaging and apparent diffusion coefficient measurementsEgypt J Rad and Nuclear Medicine 2015 46(2):423-33. [Google Scholar]
[10]. Taskin G, Incesu L, Aslan K, The value of apparent diffusion coefficient measurements in the differential diagnosis of vertebral bone marrow lesionsTurk J Med Sci 2013 43:379-87. [Google Scholar]
[11]. Niknejad M. Apparent diffusion coefficient | Radiology Reference Article | Radiopaedia.org [Internet]. Radiopaedia.org. 2016 [cited 14 May 2016]. Available from: http://radiopaedia.org/articles/apparent-diffusioncoefficient-1 [Google Scholar]
[12]. Chan J, Peh W, Tsui E, Chau L, Cheung K, Chan K, Acute vertebral body compression fractures: discrimination between benign and malignant causes using apparent diffusion coefficientsBrit J Radiol 2002 75(891):207-14. [Google Scholar]
[13]. Momjian R, George M, Atypical imaging features of tuberculous spondylitis: case report with literature reviewJ Radiol Case Rep 2014 8(11):1-14. [Google Scholar]
[14]. Engin G, Acuna B, Acuna G, Tunaci M, Imaging of extrapulmonary tuberculosisRadiographics 2000 20:471-88. [Google Scholar]
[15]. Balliu E, Vilanova J, Pelaez I, Puig J, Remollo S, Barcelo C, Diagnostic value of apparent diffusion coefficients to differentiate benign from malignant vertebral bone marrow lesionsEur J Radiol 2009 69:560-66. [Google Scholar]
[16]. Bhugaloo A, Abdullah B, Siow Y, Ng K, Diffusion weighted MR imaging in acute vertebral compression fractures: differentiation between malignant and benign causesBiomed Imaging Interv J 2006 2(2):12 [Google Scholar]