Cardiovascular disease often manifests early as metabolic syndrome, autonomic dysregulation and hypertension [1]. Easy identification of individuals in this high-risk class, in the absence of any disease, could promote early identification and thus reduce the prevalence of adolescents with metabolic syndrome who are likely to become overweight/obese adults with hypertension and heart failure. Heart Rate Variability (HRV), a measurement of the autonomic modulation of heart rates, is a widely used screening tool for heart disease [2]. HRV indicators of autonomic dysregulation have been reported in children affected by obesity [3]. In previous studies from our laboratory, Fast Fourier Transform (FFT) measures of HRV showed that after periods of overnight fasting, higher Body Mass Index (BMI) was associated with greater sympathetic modulation in African-American adolescents [4]. However, in the same population, a 900 Cal test beverage challenge produced an adequate stimulus to decrease sympathetic modulation but failed to differentiate between individuals with higher BMI compared to those with normal-to-lower BMI [5]. These findings demonstrate the dependency of HRV on physiological state, as has been reported previously for HRV measurements during sleep versus wakefulness [6] and the need to perform metabolic provocation testing for 3 hours to create an adequate profile of each subject to characterize their autonomic responsiveness to energy substrate challenges. Nonlinear feedback control appears to be a property of normal cardiac rhythmicity [7]. The present study tests the hypothesis that healthy adolescents with high BMI are differentiable from those with normal-low BMI by the correlation between their blood pressures and dynamical systems-related scaling exponents that measure HRV. This study represents the first step in determining whether HRV could be useful in identifying overweight, otherwise healthy youngsters who could be at the greatest risk for developing hypertension in the future and bases its findings on congruency with previous studies through the use of detrended fluctuation analyses in conjunction with k-means clustering methods.
This study was designed to test the hypothesis that scaling exponents motivated by nonlinear fractal analyses of Heart Rate Variability (HRV) differentiate overweight, otherwise healthy adolescent/young adult subjects at risk for developing prehypertension, the primary forerunner of cardiovascular disease.
Materials and Methods
This cluster analysis study was performed during calendar years 2012-2013. The experiments and data collection were approved by the Howard University Institutional Review Board, Washington DC, U.S.A. Subjects without any diagnosed cardiovascular disease were recruited for the experiment and each subject provided informed consent. The characteristics of the study population, which consisted of 13 healthy 18–20-year-old African-American male university students, are presented in [Table/Fig-1]. The study participants were admitted to the General Clinical Research Center (GCRC) at the Howard University Hospital. All subjects were non-smokers and consumed less than two standard alcohol drinks a day, without recreational drug dependencies and not currently on any prescriptive medication that could interfere with the autonomic nervous system modulation.
Characteristics of the study group.
| Parameter | Mean |
|---|
| Age (years) | 18.61±0.65 |
| Height (inches) | 68.64±2.82 |
| Weight (lbs.) | 186.97±54.28 |
| Body mass index (kg/m-2) | 27.82± 7.48 |
| Systolic blood pressure (mmHg) | 129.16±11.83 |
| Diastolic blood pressure (mmHg) | 71.92 ± 7.22 |
Each participant underwent high-fat and high-carbohydrate test beverage treatments on resting HRV on separate days, after an unsupervised self-reported period of overnight fasting. Upon entering the GCRC between 8:00 and 9:00 AM, on each of the two testing days after the overnight fasting periods and before ingestion of the test beverages, body weight and height were measured (Detector scale) and these values were used to compute BMI as the quotient kg body weight/m2 height. Respiratory Quotient (RQ) was then measured by indirect calorimetric method using an isolated flow-directed breathing chamber (Deltatrac, Sensor Medics, Yorba Linda, CA) to insure study participants successfully fasted overnight with a qualifying RQ of 0.7. Systolic and diastolic blood pressures were measured by automated sphygmomanometer (Critic are Systems Model 506DXNT, Waukesha, WI). Each participant was found to have a resting systolic/diastolic blood pressure less than 140/90 mmHg.
Electrocardiogram (ECG) data was recorded using a BIOPAC data acquisition system (BIOPAC Systems Inc., Santa Barbara, CA) comprised of a single-channel differential input amplifier and signal-conditioning module (ECG100A) with an analog-to-digital converter module (MP100). Data was recorded at a sample rate of 500 Hz. prior to ingestion of the test beverage, 20 min of baseline data was recorded. Following this, a high-carbohydrate or high-fat treatment of 900 Cal was administered randomly over a period of 20-30 min, on two separate days. Systolic and Diastolic Arterial Blood Pressure (SBP, DBP) measurements were taken at the beginning of each subsequent hour. The high-carbohydrate test beverage consisted of 900 Cal of pure fruit juice containing 30 mg Na and the high-fat test beverage consisted of 900 Cal of half-and-half dairy mixture made of 67% fat, 23% carbohydrate, 10% protein, and contained 320 mg Na. Ingestion of the test beverage was followed by 3h of continuous monitoring. In order to discern the changes in the dynamical systems-related measurements of HRV as the test beverages were digested and metabolized, each 3-h file was separated into three 1h files, one 1h file starting after the first 30 min post ingestion, and two 2-h files with overlap using BIOPAC. This resulted in one 20min pre-ingestion ECG RR interval file and six metabolism-induced RR interval files per individual for each test beverage. To process the ECG files, each file was processed by the (Nevrokard) HRV analysis program to be converted into RR intervals. All artifacts were removed based on established heart rate patterns from the RR interval file.
Detrended Fluctuation Analysis Method
The Detrended Fluctuation Analysis (DFA) is a modification of a root mean square analysis. Developed to study the fluctuations in physiological data sets, DFA has the advantage of detecting long-range correlation in non-stationary time series [8]. Because certain disease states alter the inherent scale invariant property of the RR intervals, the application of DFA to successive RR intervals leads to the detection of pathological states [8]. The DFA algorithm is integrated over the RR interval time series [9]. The integrated time series is then divided into boxes of equal length, n. In each box of length n, a least-squares line is fit to the data. This line represents the trend in that box. This process is repeated over different box sizes and provides a relationship between F (n), the average fluctuation as a function of box size and the box size, n. If scaling is present in the biological signals, F (n) will increase with box size n such that F(n) αnα. This linear relationship is then plotted on a double log graph whose slope yields the fractal coefficient, α.
The exponent is viewed as describing the landscape of a time series as in the degree of “roughness”; the larger the value of α, the smoother the time series and the smaller the, α rougher the time series. This is the distinction between extreme correlation and complete randomness. In terms of a healthy heart, α=1 can be seen as a middle ground between the two extremes. For healthy individuals on a time scale of 102~104 heart beats, α = 1.00 ± 0.11[8].
In this study, Peng’s application of DFA to distinguish between unhealthy and healthy RR interval time series was used to develop our application of DFA to study the cardiovascular dynamics of healthy individuals under the duress of digesting and metabolizing an autonomic nervous system stimulant. In addition to the calculation of α, the DFA crossover analysis [7,8] was applied to all the data to calculate α1 and α2. The crossover analysis allows the ability to uncover pathological differences in time frames. This method was previously used to make a distinction between healthy and unhealthy patients. Typically, in healthy patients, α1 is expected to be greater than α2 because its value is greatly influenced by respiratory sinus arrhythmia [8]. Within the same construct, α2 is expected to be smaller and is considered to be indicative of an individual’s overall health [8]. In the healthy realm, we expect α1>α2 [8]. It was discovered that in unhealthy patients, reverse cross phenomena is observed where α1<α2. Reverse crossover is seen in the presence of pathological conditions, such as in patients with congestive heart failure. Within the framework of our experiment, we use Peng’s insight to define the parameters α1 and α2 to include the effects of our test beverage on our participants. Our subjects underwent hyper-caloric dietary stress and we observed an increase in sympathetic signaling. This increase is akin to an increase in sympathetic modulation that is seen in patients with congestive heart failure. Thus, we redefined our short time scale features, α1, to be indicative of the subjects when they were most influenced by metabolism of the high-carbohydrate or high-fat test beverage and α2 as a recovery period during which the subjects regained their pre-drink status. Consequently, α1 and α2 were calculated for every 1h, 2h and 3h segments. An α1 was calculated from the slope of log F(n) versus log(n) when 4≤ n ≤16 and α2 was obtained from the same plot when 16≤ n≤64. The scaling exponents α, α1 and α2, were then used in combination with k-means clustering to study the dependency of each of the dynamical systems-related fractal exponents on BMI.
K-means Cluster Method
K-means clustering is a technique which aims to cluster observations into groups in an effort to uncover emergent patterns that are not readily observable. K-means is an iterative algorithm with two steps which are repeated until a steady state is reached [10]. Step 1 assigns each data point to the closest cluster center and Step 2 recalculates the new cluster center (geometric centroid of data points assigned to the cluster). The algorithm partitions the data for N data points into K disjoint subsets {S1, S2, …Sk} minimizing the sum of squares criterion as
J = kj = 1Σηεsj|xn - μj| where xn is the vector representing the nth data point and μj is the geometric centroid of the jth cluster using data points in Sj from the previous iteration [10]. The highest Dunn’s index determines the correct number of clusters in a data set. It is defined as
DIm = min1≤ i ≤ m {min1≤ j ≤ m, j ≠ I (δCi, Cj/ max1≤k≤ m ∆k)} where m is the number of clusters and δ Ci,Cj is the intercluster distance measured by the Euclidean distance between data points from different clusters, ∆k is the maximum intracluster distance measured by the Euclidean distance between data points within a cluster [11]. The ‘max ∆k’ is the largest ‘maximum intracluster distance’ of all clusters. The parameters are normalized to have a mean of zero and a standard deviation of one.
Statistical Analysis
The number of optimal clusters using k-means clustering technique was determined by computing the highest Dunn’s index [12] using the Matlab computer program (Mathworks, Natick, MA). One-way analysis of variance (ANOVA) with multiple range testing was used to determine the significance of dependencies of α, α1, and α2 on BMI and SBP (Microsoft Excel).
Results
The key element of this analysis is the computation of the scaling coefficients α, α1 and α2 for each 1h, 2h, and 3h segment following ingestion and metabolism of high-carbohydrate and high fat test beverages. It was observed that α value increased during the caloric challenge and appears to represent metabolically-induced changes in HRV across the participants in this study. Overall, α values showed that the study participants were healthy individuals as α≅1 as shown in [Table/Fig-2].
Values for the fractal coefficients α, α1, α2.
| n=26 | α | α1 | α2 |
|---|
| 1st 1-h | 0.92 ± 0.11 | 0.75 ± 0.15 | 0.87 ± 0.11 |
| 2nd 1-h | 0.98± 0.09 | 0.84 ± 0.18 | 0.94 ± 0.11 |
| 3rd 1-h | 1.03± 0.08 | 0.91 ± 0.19 | 0.99 ± 0.10 |
| 1st 2-h | 0.99± 0.07 | 0.79 ± 0.14 | 0.92± 0.08 |
| 2nd 2-h | 1.03 ± 0.06 | 0.87 ± 0.17 | 0.97 ± 0.08 |
| 3-h | 0.92± 0.12 | 0.81 ± 0.12 | 0.89± 0.16 |
| 1st 1-h (excluding first 30 min) | 1.01±0.08 | 0.81 ±0.17 | 0.96 ± 0.11 |
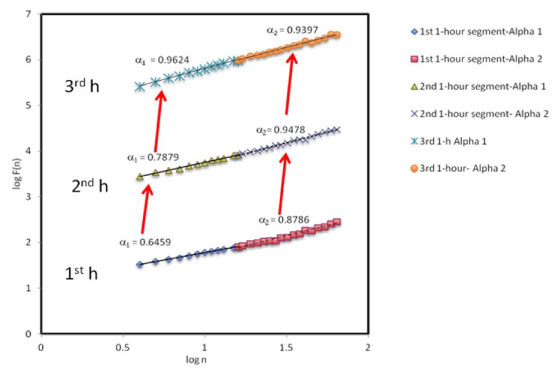
Reverse crossover was observed as α1 remained less than α2 until the 3rd 1h segment when crossover occurred and both α1 and α2 were observed to approach 1 as seen in [Table/Fig-3]. Summative, although α was found to be close to 1.0 with respect to each time segment, α1 and α2 varied with respect to each time segment and approached 1.0 as recovery from metabolism of the test beverages was reached. This observation implies that α1 and α2 were more sensitive to the autonomic challenges during the metabolism of the test beverage.
Fractal coefficients, application to metabolic challenges. α1 is representative of the study intervention and α2 of the overall health of the subject. α1> α2 indicates crossover and α1< α2 reverse crossover. The plots are shifted vertically for viewing purposes.
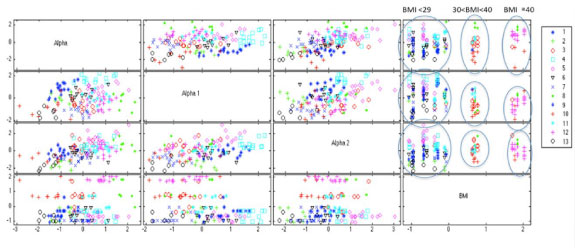
To investigate the dependency of α, α1, α2 on various pre-measured variables such as BMI, a k-means cluster analysis was first done using α, α1, α2. and BMI for all both treatments and time segments. [Table/Fig-4] summarizes the k-means values for α, α1, α2, and BMI for each cluster group. [Table/Fig-5] shows that the analysis did yield clear delineation between three groups with significantly different BMI values for BMI≤29 kg/m-2 (n=9), BMI 30-39 kg/m-2 (n=2), and BMI≥40 kg/m-2 (n=2), p<0.001 [Table/Fig-6].
Average k-means cluster values for fractal coefficients α, α1, α2, and body mass index (BMI).
| Cluster Number | Number in Group | α | α1 | α2 | BMI |
|---|
| 1 | 9 | 0.89 ±0.03 | 1.03 ±0.06 | 0.92 ±0.05 | 26.44 ±2.65 |
| 2 | 7 | 0.87 ±0.03 | 0.83 ±0.06 | 0.75 ±0.05 | 23.35±3.17 |
| 3 | 12 | 0.96 ±0.03 | 0.74 ±0.09 | 0.99 ±0.07 | 32.08 ±4.30 |
| 4 | 13 | 1.02 ±0.06 | 1.13 ±0.05 | 1.02 ±0.06 | 23.42 ±2.48 |
| 5 | 15 | 1.05 ±0.06 | 0.96±0.08 | 1.09±0.07 | 22.79 ±1.50 |
| 6 | 11 | 0.97 ±0.05 | 0.91 ±0.08 | 0.89 ±0.05 | 22.64 ±2.55 |
| 7 | 16 | 0.96 ±0.04 | 0.64±0.07 | 0.83±0.05 | 22.24 ±2.54 |
| 8 | 7 | 1.16 ±0.03 | 0.78 ±0.12 | 1.01 ±0.07 | 36.18 ±5.63 |
| 9 | 8 | 0.85 ±0.03 | 0.89±0.06 | 0.88±0.04 | 22.35±1.20 |
| 10 | 9 | 0.81 ±0.07 | 0.68 ±0.13 | 0.83 ±0.04 | 36.06±4.43 |
| 11 | 11 | 1.04 ±0.04 | 0.85±0.07 | 0.95 ±0.03 | 28.66 ±3.67 |
| 12 | 17 | 1.06 ±0.04 | 0.73 ±0.09 | 0.94 ±0.06 | 41.76 ±1.02 |
| 13 | 6 | 0.81 ±0.03 | 0.61±0.07 | 0.74 ±0.07 | 22.36 ±1.88 |
Fractal coefficients α, α1, α2, and body mass index, related k-means clusters for all time intervals and test beverage treatments. The legend on the right displays the cluster number and corresponding cluster marker.
Relationship between body mass index and blood pressure for all time intervals and test beverage treatments. BMI=body mass index; SBP=systolic blood pressure; DBP=diastolic blood pressure, *significantly different than controls at p<0.01.
| Variable | Control BMI<29, n=9 | BMI 30-39, n=2 | BMI>40, n=2 |
|---|
| BMI (kg/m-2) | 23.76 ± 3.20 | 34.39 ± 4.95 | 41.77 ± 1.02 |
| SBP (mmHg) | 122.45 ± 10.02 | 128.71 ± 11.31* | 136.1 ± 11.44* |
| DBP (mmHg) | 70.17 ± 8.70 | 67.62 ± 7.77 | 67.4 ± 7.65 |
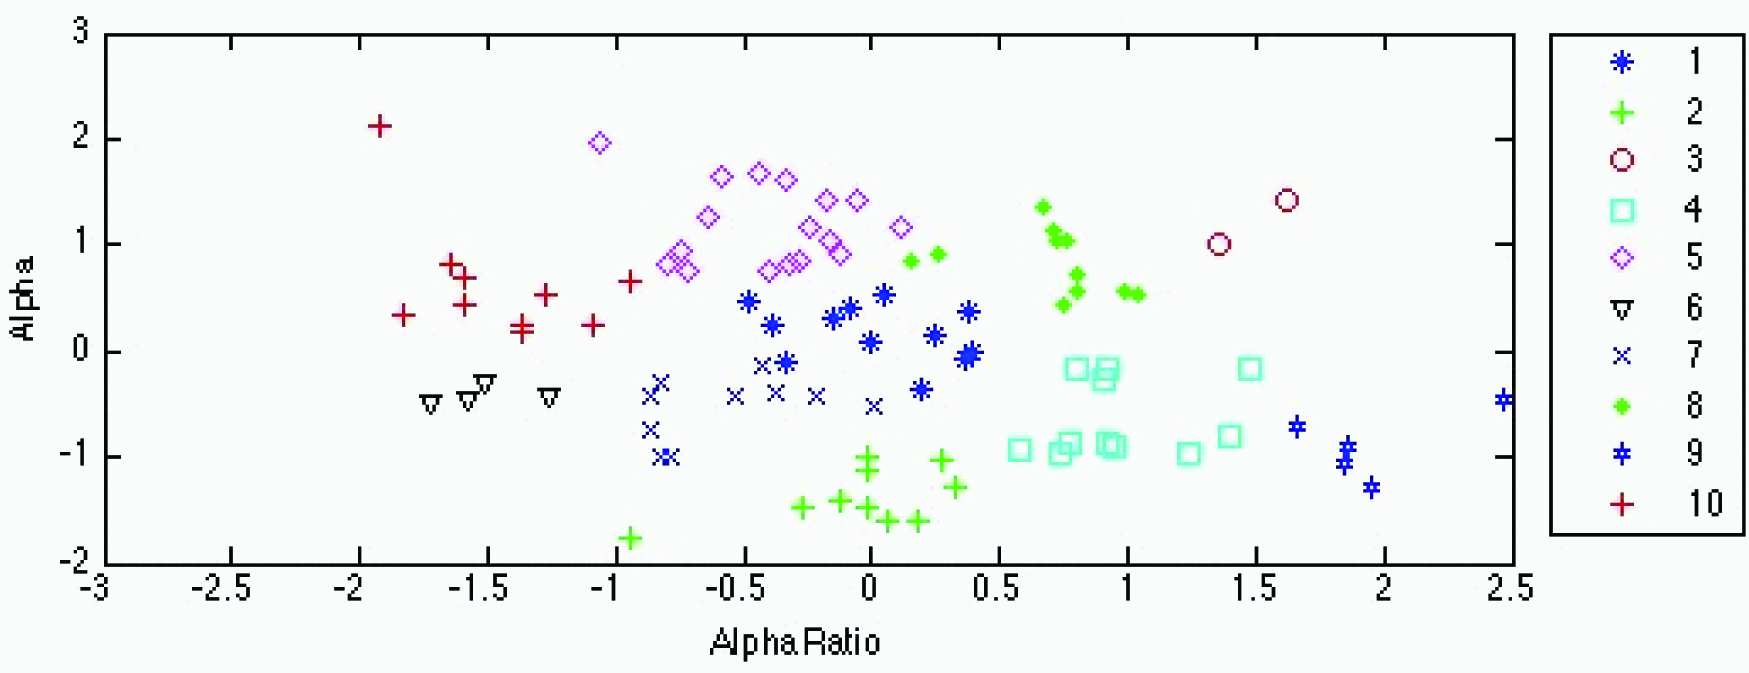
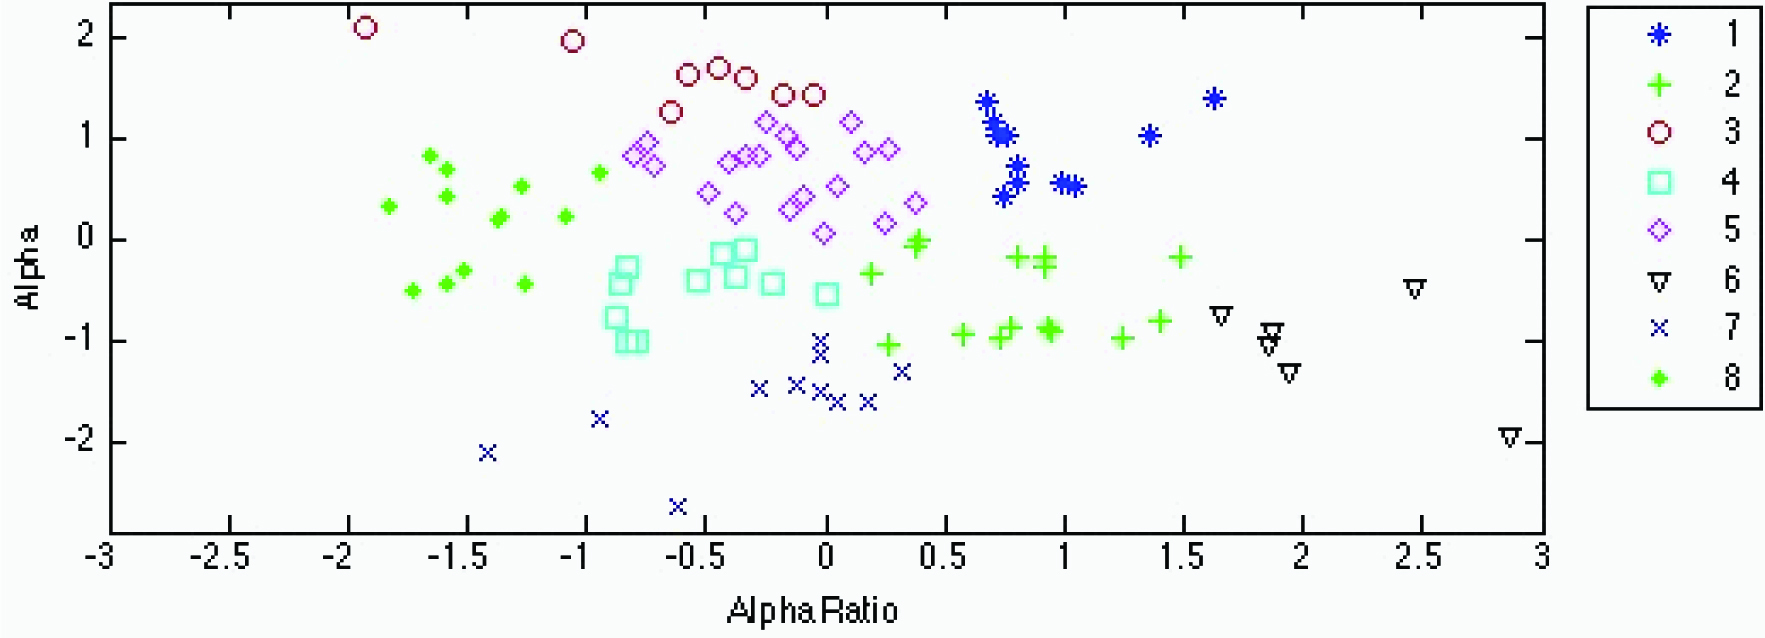
An ancillary analysis was performed to determine the dependency on BMI without BMI as a parameter. Cluster analysis of the high-carbohydrate test beverage treatment (10 clusters) shown in [Table/Fig-7] and [Table/Fig-4] and of the high-fat treatment (8 clusters) in [Table/Fig-8] and [Table/Fig-6] produced grouping with very little overlap. ANOVA on both clusters demonstrated significance at p<0.001. [Table/Fig-9,10] depict the K-means cluster analysis of the high-carbohydrate and high fat test beverage treatment based on the fractal coefficient parameter α and on the α1, α2 ratio.
K-means cluster analysis of the high-carbohydrate test beverage treatment. Fractal coefficients α and α1/α2 ratios between clusters are significantly different at p<0.05. The same single-, double- and triple-lettered superscripts indicate cluster systolic blood pressure (SBP) and body mass index (BMI) values associated with each cluster that are significantly different at p≤0.05, p≤0.01, and p≤0.001, respectively.
| Cluster Number | Number in Group | α | α1/α2 | SBP | BMI |
|---|
| 1 | 3 | 0.75 ±0.28 | 1.33±0.02 | N/A | 24.46 ±1.30 |
| 2 | 10 | 0.78 ±0.06 | 0.88 ±0.08 | 120.67±10.21 | 25.93 ±8.07aabc |
| 3 | 11 | 1.06 ±0.03 | 0.67 ±0.05 | 121.80±5.89a | 35.00 ±6.86aaddeffggg |
| 4 | 12 | 0.96 ±0.02 | 0.81 ±0.02 | 132.80±8.41a | 32.14± 6.74bhjjkk |
| 5 | 11 | 0.98 ±0.07 | 0.69 ±0.04 | 125.22±8.17 | 28.19±6.87dd |
| 6 | 1 | 1.09 | 1.34 | 126.0 | 28.20 |
| 7 | 6 | 1.15±0.04 | 0.86 ±0.03 | 132.25±15.22 | 33.87 ±8.81cmno |
| 8 | 13 | 1.03 ± 0.02 | 0.89 ±0.51 | 117.20±17.88 | 25.82 ±7.21ehjjkkm |
| 9 | 18 | 0.92 ±0.02 | 0.93 ±0.04 | 123.67±8.78 | 24.51 ±4.60ffn |
| 10 | 10 | 0.94 ±0.05 | 1.10 ±0.05 | 123.13±16.34 | 24.58 ± 2.36gggo |
K-means cluster analysis of the high-fat test beverage treatment.
| Cluster Number | Number in Group | α1/α2 | α1/α2 | SBP | BMI |
|---|
| 1 | 11 | 1.06 ±0.03 | 1.1±0.05 | 116.0±7.84abbcde | 22.54 ± 4.06aabcccdeeff |
| 2 | 17 | 0.91 ± 0.04 | 1.07 ±0.06 | 125.09±9.45a | 23.72 ± 5.12gghhjkk |
| 3 | 8 | 1.15 ±0.03 | 0.82±0.10 | 127.33±20.43 | 32.55 ±7.15aaggmnn |
| 4 | 11 | 0.91±0.03 | 0.84 ± 0.05 | 122.0±9.59 | 27.12±5.56bm |
| 5 | 20 | 1.04 ±0.03 | 0.90±0.05 | 131.88±12.68bb | 30.88±7.86ccchhoo |
| 6 | 6 | 0.85 ±0.05 | 1.30±0.80 | 128.33±4.93c | 25.16±2.20dnnoop |
| 7 | 11 | 0.79 ±0.05 | 0.89±0.09 | 129.13±13.71d | 27.94 ±6.19eej |
| 8 | 13 | 0.99 ±0.51 | 0.68 ±0.04 | 125.4±7.09e | 31.65 ± 9.4ffkkp |
Fractal coefficients α and α1/α2 ratio between clusters are significantly different at p<0.05. The same single-, double- and triple-lettered superscripts indicate cluster systolic blood pressure (SBP) and body mass index (BMI) values associated with each cluster that are significantly different at p≤0.05, p≤0.01, and p≤0.001, respectively. Significant differences for both SBP and BMI were found between clusters 1 and 5, 1 and 6, 1 and 7 and 1 and 8.
K-means cluster analysis of the high-carbohydrate test beverage treatment based on the fractal coefficient parameter α and on the α1, α2 ratio. The legend on the right displays the cluster number and corresponding cluster marker. No significant differences for both systolic blood pressure and body mass index were found between any of the clusters.
K-means cluster analysis of the high-fat test beverage treatment based on the fractal coefficient parameter and on the α1, α2 ratio. The legend on the right displays the cluster number and corresponding cluster marker. Significant differences for both systolic blood pressure and for body mass index were found between clusters 1 and 5, 1 and 6, 1 and 7 and 1 and 8.
Discussion
Previous studies from our laboratory have been unable to differentiate between normal and overweight 18-20year-old African-American males after overnight fasting [4] or during 3h periods of metabolizing 900 Cal high-carbohydrate and high-fat test beverages using FFT measures of HRV [5]. The main finding of this subsequent study is that scaling exponents were able to differentiate between normal and overweight study subjects. There were several differences, which provided advantages in using DFA and k-means cluster analyses as presented in the present study. Our previous studies analyzed peak and nadir HRV measures during a 3-h period of metabolizing isocaloric high-carbohydrate and high-fat test beverages after overnight fasting [5,13]. In the present study, DFA permitted analysis of the HRV measurements across the 3-h period using scaling exponents in varying time windows during the digestion and metabolism of the test beverages. Positive correlations between premeasured BMI and the fractal coefficients α, α1 and α2 [8,14–17] were found. Optimal clustering of data cells exhibited three centroids showing dependency of the scaling coefficients α, α1 and α2 on BMI < 29, BMI 30-39 and BMI ≥ 40 kg/m-2. These findings suggest that the trajectories of changes in HRV during 3-h periods after an isocaloric test beverage challenge likely resulted from less HRV; i.e., smaller increase in sympathetic activity, for individuals with ≥30 kg/m-2 compared to those < 29 kg/m-2. Through further investigation, the link between the scaling exponents and pre-measured parameters deemed applicable in this analysis. The study participants were neither prehypertensive nor hypertensive, but, through the course of metabolic stress and increased sympathetic activity, an increase in blood pressure was observed.
The blood pressure of each participant was measured once every hour during the course of the treatment. Because the blood pressure and ECG measurements were not measured on the same time scale, only aggregate averaged hourly data were compared to the scaling exponents. Although a limiting factor, the initial goal to observe the collective changes in blood pressure during the digestion of the test beverages by clusters with statistically similar intracluster values can be performed with scientific confidence. When the average hourly systolic blood pressure per cluster group was calculated, an increase in systolic blood pressure positively correlated with an increase in BMI. The three aforementioned clusters were associated with significantly different systolic blood pressures. This finding is consistent with the expectation that SBP, a measure of blood force during ventricular contraction, should be influenced more by sympathetic cardiac activity than DBP, attributable to increased stroke work [18]. With the exclusion of BMI as a parameter, the SBP values showed positive correlation to increasing BMI. Furthermore, SBP showed greater correlation with BMI in the high-fat treatment compared to the high-carbohydrate treatment. This difference might be related to the ten-fold greater sodium content of the high-fat test beverage which could have produced vasoconstriction and increased arterial resistance, similar to what has been reported for ingestion of sodium-rich carbonated natural mineral water [19]. This correlation between the hypercaloric drinks and SBP imply that their metabolism was able to induce prehypertensive/hypertensive characteristics among all BMI groups but had a greater effect among those with BMI ≥ 30 kg/m-2.
A previous study on the effects of sugar sweetened beverages has suggested that those who consume these types of beverages on a daily basis were more likely to have high blood pressure [20]. What these studies did not do that our study has done was to stratify the effects in time windows of peak digestion and metabolism. Another strength in our study is our subjects were not pre-hypertensive nor hypertensive before or after the high caloric intake. This differs from the previous studies because their measurements were not taken during the digestion and metabolism but rather as a daily monitored blood pressure reading inferring that the adolescents were prehypertensive or hypertensive.
Although these measurements indicated the absence of cardiovascular disease, which was purposeful in our study design, the trajectories of the data pooled across the trials of the two test beverage provocations exhibited directional changes similar to those reported for aging and for the development of cardiovascular disease [17,21–23]. Similar trajectories were observed when the high-carbohydrate trials were compared to the high-fat trials and when the individuals with BMI < 29 kg/m2 were compared to overweight individuals with BMI ≥ to 30 kg/m2. An obvious limitation of this study is that these analyses were unable to differentiate individuals with BMI < 25 kg/m2, an internationally accepted cutoff for overweight [24]. The reason for this may be our limited sample size of 13 subjects, thereby suggesting the need for expansion of this study to a larger, wider population.
After validating the hypothesis that DFA with cluster analysis of HRV fractal exponents could differentiate normotensive overweight individuals by BMI and SBP, we tested the proposition that significant overlap between the intercluster differences for SBP and those for BMI occurred in a unique category of the study subjects. To test this proposition, we performed cluster analyses of the high-carbohydrate and high-fat treatments, performed independently on separate days. We found that although there was no overlap of the intercluster differences for SBP and BMI associated with the high-carbohydrate treatment, there was significant overlap associated with the high-fat treatment. These findings support the hypothesis that this unique category of subjects, exhibiting trajectories of fractal exponents related to increased sympathetic activity induced by ingesting and metabolizing high-fat test beverages are made up of individuals at highest risk for developing hypertension in the near future.
Limitation
Our prior studies on similar groups of subjects [5,13] have shown that postprandial heart rate, energy expenditure and LF/HF increase but these variables were not able to differentiate overweight from normal weight subjects. In the present study, we were able to differentiate the overweight from normal weight subjects. A limitation of this study is that we did use validated standards to quantify the risk for prehypertension that is often associated with metabolic syndrome in African-American males. Instead, we relied on BMI and SBP as indicators of the risk.
Hence, we could not determine the benefit of complex measuring of dynamical systems-related (nonlinear fractal) HRV over BMI and SBP. Metabolic data (lipid, cholesterol and glucose metabolism) would have provided important additional insight in this respect. Studies are in progress to carefully quantify the risk for metabolic syndrome to test whether our approach to measuring postprandial HRV parameters, performing DFA and cluster analyses would differentiate obese and/or prehypertensive subjects with high and low risk for metabolic syndrome. This study was also limited by the small number of subjects and the results must, therefore, be considered as a preliminary report describing a novel physiological assessment methodology, pending recruitment of a larger number of subjects.
Conclusion
In summary, in evaluating the electrocardiogram interbeat intervals of healthy 18-20 years old using Peng’s fractal, dynamical systems-related scaling exponents, we were able to demonstrate increased sympathetic modulation of our study group during ingestion and metabolism of isocaloric high-carbohydrate and high-fat test beverages. Furthermore, in using k-means cluster in conjunction with DFA data, we were able to see emergent correlation within the groups to BMI and SBP. In additional studies which precluded BMI, we also observed cluster formation with dependencies on BMI and SBP. We observed that large BMI was positively correlated with high SBP during the digestion and metabolism of the test beverages. Scaling exponent combined with k-means cluster analyses appear to be capable of unmasking the dependency of premeasured parameters on measures of sympathetic influences on heart rate modulations associated with metabolic provocation of the autonomic nervous system. These findings suggest the need for future studies to determine whether ranging analysis for stratifying risk factors in various age and health related communities helps identify otherwise healthy overweight or obese individuals at highest risk for developing hypertension and metabolic syndrome in the future.
Disclosures
The authors declare the views expressed in this article are the authors’ own and not those of the U.S. Merchant Marine Academy, the Maritime Administration, the Department of Transportation or the United States government. The authors declare no competing financial interests.
Fractal coefficients α and α1/α2 ratio between clusters are significantly different at p<0.05. The same single-, double- and triple-lettered superscripts indicate cluster systolic blood pressure (SBP) and body mass index (BMI) values associated with each cluster that are significantly different at p≤0.05, p≤0.01, and p≤0.001, respectively. Significant differences for both SBP and BMI were found between clusters 1 and 5, 1 and 6, 1 and 7 and 1 and 8.