World Health Organization (WHO) defines quality of life as an individual’s perception of his living situation due to the valuable systems and culture in which he lives and his relationship with his favourable objects, expectations, standards and priorities. This definition involves a broad concept influenced by the individual’s mental and physical health condition, level of independence, social communication and personal ideas [1,2]. The quality of life involves different dimensions of people’s social mental, physical welfare and health. Each of quality of life’s dimensions has two measuring objective and subjective aspects. Although objective aspect is important in the description of individual’s health rate, but the individual subjective perceptions and expectation is indicative of real quality of life which is experienced by him [3]. The study of present evidences suggests that social factors determining people’s health have a considerable role in their health condition and quality of life and economic factors are introduced as one of most significant factor in this regard [4]. Increasing the social protections significantly causes significant improvement in people’s Quality of life [5]. In this regard, it can be cited by two models: 1-buffering model which believes people’s social protection supports them against negative effects of stress. This model suggests that social protection is beneficial just for stressed people; because, it prevents stress influence on a person. 2-main effect model, which declares that there is direct correlation between people’s social protection and its physical and mental outcomes; i.e., social support regardless of whether or not a person is under the influence of stress, can avoid the negative experiences of the beneficial effect on health. Thus, it has useful effects on health, this model believes that social protection modifies undesirable effects of mental stress by five ways which are as follow: 1) Emotional consideration: including listening to people’s problems and their feelings and expression, empathy, caring, perception and encouragement; 2) Helping: including protection and helping which leads to adaptive behaviour; 3) Information: provide guidance and recommendations to improve coping; 4) Evaluation: providing feedback from others in the field of performance that leads to the correct functioning of a person; 5) Sociability, soial support is usually caused by socialization, so it has useful effects [6,7].
Rook believes that, there are 3 aspects of social protection that may influence people’s health and behaviour. The first, involves characteristics of social network to which a person belongs to, so that it provides connection among network consists of corresponding relations. This structural aspect includes individual relationship status, size of relations network, accessible intimate friends and a lot of contacts. Second aspect; involves content of social relations. This aspect refers to the functions of social protection including the dimensions of emotional protection such as love and alliance, consult and companionship protection such as thinking and feeling, informational protection such as solving the problem and collecting information. Third aspect involves the evaluation of social network which this aspect includes the measurement of protection’s quality and also satisfaction with social relations [8]. Merely prolonged living age is not considered in the modern science; but it should be considered that additional years of human life should finally pass in peace and mental and physical health. If you don’t meet such conditions, scientific progresses for supplying prolonged life will be futile and hazardous. This research is, therefore, planned and conducted to investigate the relationship between people’s socioeconomic factors and health-related quality of life related to health in western Iran in 2013.
Materials and Methods
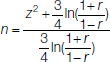
In this cross-sectional study, 918 participants were selected among different counties of Ilam province by multi-stages cluster sampling and then related families were determined and householder was asked questions by clustering method. Sample size was computed with α = 0.05, β = 0.10, r = 0.29 and using the formula:
The family’s economic and general condition was determined with the questionnaire including questions about demographic and job condition, having car, house, loan, income and living costs which it rated based on likert scale form. SF-36 questionnaire was used for measurement of people’s quality of life related to health its validity and consistency among different communities has investigated [9,10] and also the validation about its Persian copy is performed in Iran [11]. Cronbach-α coefficient of this questionnaire in the present research was obtained 0.81.
SF-36 is one of most important questionnaires which is applied for evaluating quality of life related to health among healthy individuals and patients, it is evaluating quality of life related to health in 8 scopes which included 36 questions as follows 10 questions about physical function, 4 questions about limitation due to physical problems and 3 questions about limitation due to emotional problems, 2 questions about physical pain and its effect on daily activity, 5 questions about people’s perception of their public health, 2 questions about social function and 4 questions about exhilaration and 5 questions concerning people’s mental health. This tool involves two summarized compounds which were obtained by scales combining as follow; the summary of physical health evaluation including: physical function, physical pain, limitation due to physical problems and public health, the summary of people’s mental health including: social function, mental health, Exhilaration and limitation due to emotional problems. To score the questionnaire in each dimension; first, it scored any question by questionnaire direction and then the sample’s score summed up and had became scale of zero (bad situation) to 100 (best situation). Which mean score of 100 has been calculated in any scale. The dependent variable (quality of life grade) should be converted to a dual variable for using logistic regression. Therefore, the scores below average (61.71) were defined as undesired life quality and scores above average were defined as people’s favourable life quality. Date was analysed using SPSS ver. 16.0 and normality of data check using Kolmogorov-Smirnov test. Pearson correlation coefficients was used to find correlation of quantitative varabels. In logistic regression, quality of life was defined as depended variable and dichotomous (good and bad). Independent variables intered in to regression modeled as both continuous and categorical forms. Final models were selected by maximum likelihood forward method. Significant level was considered less than 0.05.
Results
In this study, 918 householder with age 32.97± 9.5 and age range 18-70 years were evaluated. The mean ± sd quality of life for participants were 61.74±12.31 (range 0-100) and among males and females was 61.44±12.38 and 61.97±12.26. There were significant statistical correlation between gender and limitation due to physical problem, limitation due to emotional problem, exhilaration, physical pain, public health and mental health (p<0.05) [Table/Fig-1].
Compared to the average indicators and score of quality of life in people according to sex.
| Variable | Male | Female | value-p |
|---|
| Mean | SD | Mean | SD |
|---|
| Physical functioning | 73.97 | 28.32 | 72.87 | 27.83 | 0.581 |
| Limitations due to physical problem | 44.88 | 35.82 | 58.19 | 34.66 | <0.001* |
| Limitations due to emotional problem | 43.52 | 38.43 | 56.55 | 38.69 | <0.001* |
| Mental Health | 56.47 | 11.82 | 53.4 | 10.15 | <0.001* |
| Exhilaration | 53.31 | 11.65 | 51.5 | 10.89 | 0.022* |
| Social functioning | 70.34 | 20.75 | 67.61 | 19.78 | 0.065 |
| Physical pain | 73.8 | 22.13 | 67.34 | 20.23 | <0.001* |
| Public Health | 63 | 18.35 | 58.37 | 16.72 | <0.001* |
| Physical Health Summary | 63.92 | 14.25 | 64.24 | 13.97 | 0.754 |
| Mental Health Summary | 55.89 | 11.6 | 57.26 | 12.08 | 0.104 |
| Total score of quality of life | 61.44 | 12.38 | 61.97 | 12.26 | 0.547 |
*Significant using t-test.
The findings of this study showed that there was significant and direct correlation between age with monthly income (r=0.18, p<0.05) and there was significant and indirect correlation between age with physical health summary (r= -0.21, p<0.05) and mental health summary (r= -0.08, p<0.01). There was direct correlation among monthly income of househoulders with mental and physical health summary. But there was only significant statistical between income of househoulders with physical health (p<0.05) [Table/Fig-2].
Correlation between age and physical health summary and mental health summary and income.
| Age | Income | Physical Health Summary | Mental Health Summary |
|---|
| Age | 1 | | | |
| Income | 0.18** | 1 | | |
| Physical Health Summary | -0.21** | 0.11* | 1 | |
| Mental Health Summary | - 0.08* | 0.08 | 0.51** | 1 |
* Significant at a level of less than 0.05
** Significant at less than 0.01
Based on results of logistic regression, odds favourable quality of life among women was 1.12 times that of men (OR=1.12, CI=0.84–1.4). Therefore, it can be said that favourable quality of life among women was 12 percent more than men and among singles was 0.68 of married individuals (OR=0.68, CI =0.48–0.96). Also, the odds favourable quality of life for employed and retired was 1.25 and 0.56 times of unemployed people respectively. Favourable quality of life for groups 25-29-year-old, 30-34-year-old, 35-39-year-old, 40-44-year-old, 45-49-year-old and over 50-year-old was respectively 0.49, 0.44, 0.37, 0.54, 0.38, and 0.21 times that of age group under 25-year-old in respect of age group, favourable quality of life for groups with incomes 500-750 thousand toman, 750 – one million and over one million was respectively 1.4, 2.09, 2.16, times that of groups with income under 500 thousand tomans in respect of monthly income. Whereas there was significant statistical correlation among people’s age and marital status and their quality of life in respect of statistical conditions (p<0.05) [Table/Fig-3].
Results of logistic regression between quality of life and economic- population factors, regardless of confounding factors.
| Variable | | OR (CI 95%) | p-value |
|---|
| Sex | (Women / Men) | 1.12(0.84-1.4) | 0.432 |
| Marital Status | (Single / Married) | 0.68(0.48- 0.96) | 0.031* |
| Job | Unemployed | Ref | 0.126 |
| Employed | 1.25(0.93- 1.67) | 0.131 |
| Retired | 0.56(0.2- 1.5) | 0.259 |
| Bad | Ref | 0.002** |
| Economic situation | Average | 2.1(1.39- 3.16) | <0.001** |
| Well | 1.8(1.17- 2.8) | 0.007** |
| Bad | Ref | <0.001** |
| Life Satisfaction | Average | 1.5(0.98- 2.5) | 0.057 |
| Well | 2.7(1.74- 4.33) | <0.001** |
| < 25 | Ref | 0.002** |
| 25 -29 | 0.49(0.29- 0.89) | 0.007** |
| 30 -34 | 0.44(0.26- 0.74) | 0.002** |
| Age | 35 -39 | 0.37(0.21- 0.66) | 0.001** |
| 40 -44 | 0.54(0.3- 0.99) | 0.046* |
| 45 – 49 | 0.38(0.18- 0.8) | 0.011* |
| >50 | 0.21(0.09- 0.47) | <0.001** |
| Less than500 | Ref | 0.059 |
| Income (thousands of Tomans) | 500-750 | 1.4(0.86- 2.57) | 0.158 |
| 750- One million | 2.09(1.09- 3.98) | 0.021* |
| More than a million | 2.16(1.14- 4.08) | 0.017* |
* Significant at a level of less than 0.05.
** Significant at less than 0.01.
While after deletion of studies altered variables effect, there was only significant statistical correlation among people’s quality of life and their economic situation and satisfaction rate about life (p<0.01), so that, odds favourable quality of life for individuals with middle economic situation (OR=1.8, CI =1.03–3.3) and good economic situation (OR=3.4, CI=1.51-7.86) was higher than those with bad economic situation. Also, individual quality of life with middle satisfaction rate (OR=1.3, CI =0.65-2.65) and with good satisfaction rate (OR=3.4, CI=1.68-6.95) was more than those with dissatisfaction about their life [Table/Fig-4].
results of logistic regression between quality of life and economic- population factors, considering confounding factors
| Variable | Groups | OR (CI 95%) | p -value |
|---|
| Life Satisfaction | Bad | Ref | <0.001** |
| Average | 1.3(0.65- 2.65) | 0.443 |
| Well | 3.4(1.68- 6.95) | 0.001** |
| Bad | Ref | 0.009** |
| Economic situation | Average | 1.8(1.03- 3.3) | 0.039* |
| Well | 3.4(1.51- 7.86) | 0.003** |
* Significant at a level of less than 0.05.
** Significant at less than 0.01.
Discussion
The assessment of quality of life in the west of Iran and the detection of the relationship between it and socioeconomic status were the purpose of this study.
There was significant association between gender and small-scopes limitation due to physical problem, limitation due to emotional problems, Exhilaration, physical pain, public health and mental health (p<0.05). In the studies which were performed by Mir et al., men had better quality of life than women in physical dimension meaninglessly and in mental dimension meaningfully [12]. Whereas in the studies performed by Heydarnia et al., and Hadi et al., gender had not influenced the studied individual’s life quality [4,13]. The same can be said the quality of life among our country’s men is lower than women because of their responsibility about living costs provision and encountering physical and mental problems.
In this study, it showed a significant and direct correlation between age and monthly income and a significant and inverse correlation among people’s age and their physical and mental health summary. Also, there was direct correlation between people’s monthly income and their mental and physical health summary whereas it had only significant statistical correlation with people’s physical health. In 2006, the research was conducted by Albokordi et al., on shahinshahr’s elders that they had found similar results [14] and in 2008, Bazrafshan et al., of Shiraz province had concluded that people’s age increase is caused to decrease their quality of life and its dimensions [15]. In Mir et al., study, there was significant and inverse correlation between household’s age and physical health abbreviation and quality of life (p=0.005, r=0.87), so that younger had better physical dimension but there was significant and direct correlation between their age and mental health summary (p=0.04, r=0.45) [14]. As it would be expected the quality of life in both dimensions (mental and physical) decline with increasing the age that part of this may be due to the physical limitations of elders and other part may be due to person’s mental and emotional conditions about his life. In the study conducted by Tabari et al., there was a significant correlation between people’s income and their mental and physical dimension and people who had sufficient income, physical activity performed and mental health symptoms were lower in them [16]. This will require the economic protection and consideration of people groups especially socially deprived individuals.
Based on results of logistic regression in the present research, odds favourable quality among women was 1.12 times more than men and among married was 1.47 times more than single individual. Cultural condition of west of Iran, specialy Ilam provience, that relationship between boys and grils before getting married is very limited, and even it is shame, so we think this is main reason that quality of life in married people was better than single people. In Heydarnia et al., studies, the physical and mental health abbreviation among married was 1.48 and 4.12 times more than of singles, respectively and these rates had increased 0.99 and 0.98 times that of singles by increasing age, respectively [4]. In Hadi et al., gender had not affected healthful individual’s quality of life but women group significantly had better quality of life against physical and emotional problems and social function which perhaps due to their conversation ability and high collaboration [13]. On other hand, men often take responsibility for living costs provision which this issue is not ineffective factor on their quality of life. In Giocomazzi studies such as present research, it was not correlation between people’s gender and quality of life [17]. But in Lai’s research [18] it was observed significant correlation among them which can be resulted from social culture differences or difference in the type of research.
Also, in respect of job condition, the favourable quality of life for employed and retirees was respectively 1.25 and 0.56 times more than of unemployed people’s take a job is very importants so it can improve socioeconomic statuse of peoples and their quality of life. The odds favourable quality of life for age group under 25-year-old was better than other age groups.
In respect of monthly income; odds favourable life quality for groups with incomes 500-750 thousand to man,750 – one million and over one million was respectively 1.4, 2.09, 2.16 times more than that of groups with income under 500 thousand to man. Whereas, in respect of statistical condition; there was significant statistical correlation between people’s age and marital status and their quality of life. The study was conducted by Hasnpoor et al., there was not significant statistical correlation among people’s quality of life and age, marital status, job condition and monthly income as this was observed among other studies [19–21]. Whereas, the results of studies by Paryad et al., and Simpson et al., showed that there are significant correlation between these variable and quality of life, but Reynolds et al., and Howes et al., noted only this correlation between people’s quality of life and their age and sex variable [22–25]. It does not determine, because, gender is influenced on people’s life quality but some researchers hold that biological and psychological factors are influenced on people’s life quality [26].
Multivarite logistic regression showed that, there was only significant statistical correlation between quality of life and their economic condition, satisfaction factors about their life. So that, the favourable quality of life for individuals with good and middle economic conditions and satisfaction was more than those with bad condition. In studies of Abbaszadeh et al., chance of people with dissatisfaction about their living was 2.15 times to have lower quality of life [27]. The significant correlation between two factors is indicated that people’s positive attitude about their living can be effected on increase quality of life. In Heydarnia et al., studies; it is possible that mental and physical health rate among deprived individual was bad compared with society’s ordinal people which these rates were 10 and 15 times that of those, respectively [4].
Although survival was only main challenge of the twentieth century, living with better quality is the main problem in modern century; so, the attention to people’s life quality has become one necessity [28].
Limitation
There were many Limitations in this study such as: some people do not like to tell about their income, living cost, their economic satiation and quality of life, some of participants have low knowledge and they have problem in uderstanding of some of qestions, inspite of choosing a big sample size, sampling error has effect on generalized ability of results.
Conclusion
According to finding of this research the average quality of life in the studied households was in the middle level. As regard household’s income rate was influenced by their health and quality of life. The greatest obstacle to safe and secure life in society were economic problems, living problems, social deprivation and poverty. Therefore, the general improvement of people’s quality of life can be influenced by increasing social cooperation, improving health care services and providing counseling services obtained from policies by health care.
*Significant using t-test.
* Significant at a level of less than 0.05
** Significant at less than 0.01
* Significant at a level of less than 0.05.
** Significant at less than 0.01.
* Significant at a level of less than 0.05.
** Significant at less than 0.01.