Breast cancer is the most common cancer among women worldwide with nearly 1.7 million cases diagnosed in 2012 [1]. Breast cancer is also the most common cancer in women in India where it accounts for 27% of all cancers in women [2,3]. For every two women newly diagnosed with breast cancer in India, one woman dies of it [2–4].
Early detection in order to improve breast cancer outcome is the cornerstone of breast cancer control [5]. While mammography and ultrasonography (USG) are time tested diagnostic modalities which have shown the highest sensitivity in the detection of breast cancer, both methods present some limitations. Mammography performed in dense breasts may often yield false-negative results [6]. Ultrasound has been proven to improve diagnostic sensitivity when added to screening mammography in high-risk women with dense breasts. However, the downside was an increased false-positive rate and lower positive predictive value [7].
Ultrasound elastography was introduced to obtain a more accurate characterization of breast lesions. By offering additional information about tissue stiffness, real-time tissue elastography can improve visualisation of tumours and facilitate differentiation between benign and malignant disease.
This study was performed to assess the diagnostic performance of four interpretation criteria for elastography as well as to compare the diagnostic performance of sonoelastography with that of conventional ultrasound in characterising breast lesions as benign or malignant.
Materials and Methods
Collection of Data
This prospective study was conducted with approval by the Institutional Legal Ethical Committee. A total of 143 lesions in 136 patients referred for ultrasound were analyzed from October 2013 till October 2015. Patients included were at least 18-year-old, female and had a sonographically visible lesion smaller than 4cm in size. Of these, 43 lesions were excluded, 37 because pathological results were not available, 2 because of prior lumpectomy,4 lesions were later excluded because a 6 month follow-up ultrasound examination could not be performed.
Real time ultrasound followed by elastography was performed with the ACUSON S 2000 ultrasound scanner (Siemens Medical Solutions) by one of four radiologists, using the 9-4MHz linear array transducer. The images were later reviewed together and a consensus regarding diagnosis was achieved.
The four radiologists involved in this study received training in elastography by the Siemens applications staff and practised recording elastography images during daily examinations for a period of 18 months prior to the study.
Conventional Sonographic Examination
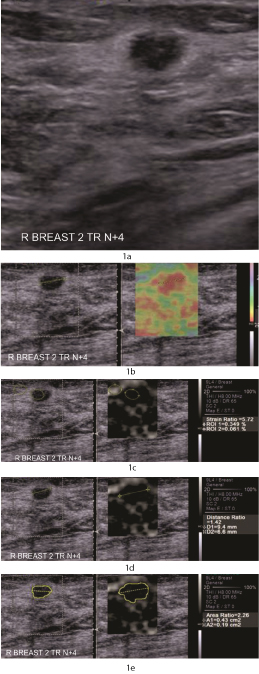
Each lesion was assessed with the Breast Imaging Reporting and Data System (BI-RADS) [8] ultrasound descriptors i.e. shape, orientation, margin, lesion boundary, echo texture, posterior acoustic features, following which the lesions were classified according to the BI-RADS criteria [Table/Fig-1a-e].
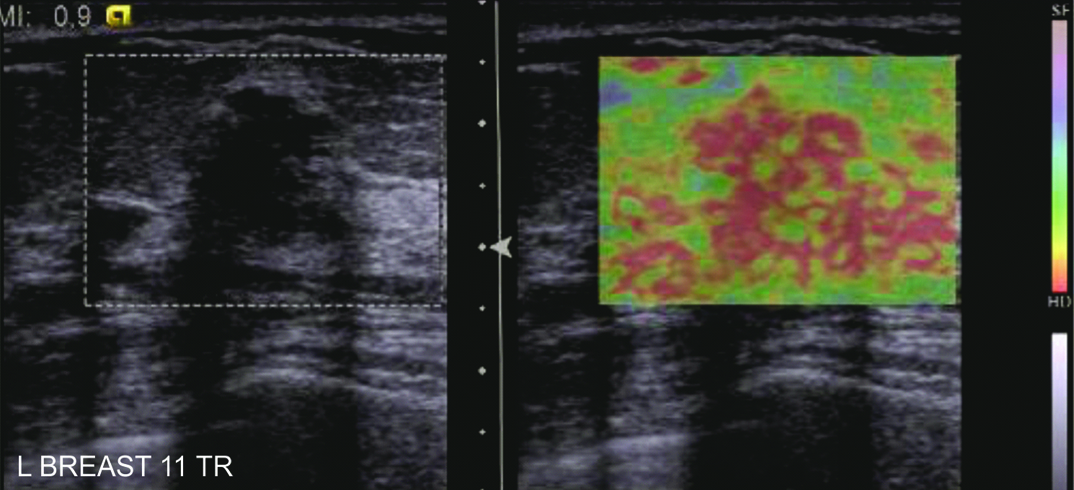
1a) A 65 year old woman who presented with nodularity of the right breast, eventually diagnosed as invasive ductal carcinoma. Transverse ultrasound image revealed an oval, hypoechoic mass with parallel orientation, indistinct margins and a thick echogenic halo interpreted as BI-RADS 4A.
1b) Side by side display of B mode and elastography images with colour mapping used for evaluation of elastography score. There is no strain seen within the lesion as well as in the surrounding area i.e. Elastography Score of 5
1c) To calculate the strain ratio, relative strain values of the mass (ROI 2) and fat (ROI 1) were measured taking care that both regions of interest (ROI) were of the same size. The strain ratio defined as the fat to mass strain ratio was automatically calculated. The strain index was 5.72.
1d) Calculation of distance ratio: The longest lesion dimension was manually measured on both the elastogram (D1) and the corresponding B mode image(D2). The corresponding distance ratio was calculated. The distance ratio was 1.4
1e) The area ratio was then calculated from the automated tracing of the area of the lesion on the elastogram (A1) and on B mode (A2). The area ratio was 2.25
Sonographic Elastography
After the conventional sonographic examination, compression elastography was performed using eSietouch elasticity imaging technology.
Technique
Once the optimum B mode image was obtained, elastograms were acquired taking due care that the lesion remained in the imaging plane. A quality factor of more than 60 was used to ensure adequate lesion displacement while obtaining the elastogram.
As precompression is a critical factor to obtain images adequate for analysis, due care was taken to apply minimal precompression by using a liberal amount of coupling gel and by ensuring that the subcutaneous fat in the elastogram was soft.
The images from conventional sonography and sonographic elastography were displayed side by side as a single image. A Region of Interest (ROI) box was set to include the area from the subcutaneous fat layer to the superficial portion of the pectoralis muscle and to focus on the target mass, taking due care that the lesion occupied no more than a third of the ROI box.
Interpretation Criteria for Sonographic Elastography
Four interpretation criteria i.e., elastography score [9], strain ratio [10], distance ratio [11] and area ratio [12] were recorded for evaluation of sonographic elastography.
Elastography score
The elastography score was evaluated on the displayed static images with an arbitrary colour map as follows:
Blue: Tissue with the greatest strain (softest component)
Red: Tissue with no strain (hardest component)
Green: Tissue with intermediate strain
The elasticity scores of the target lesions were assessed using the following scoring system described by Itoh et al., [9].
A score of 1 indicated even strain for the entire hypoechoic lesion (i.e., the entire lesion was evenly shaded blue). A score of 2 indicated strain in most of the hypoechoic lesion with some areas of no strain (i.e. the hypoechoic area showed a blue and red mosaic pattern) [Table/Fig-2].
Fibroadenoma. ultrasound showed a well defined oval hypoechoic lesion with parallel orientation showing posterior acoustic enhancement. Corresponding elastogram showed an elastography score of 2.
A score of 3 indicated strain at the periphery of the hypoechoic lesion with sparing of the centre of the lesion (the peripheral part was green, the centre was red) [Table/Fig-3].
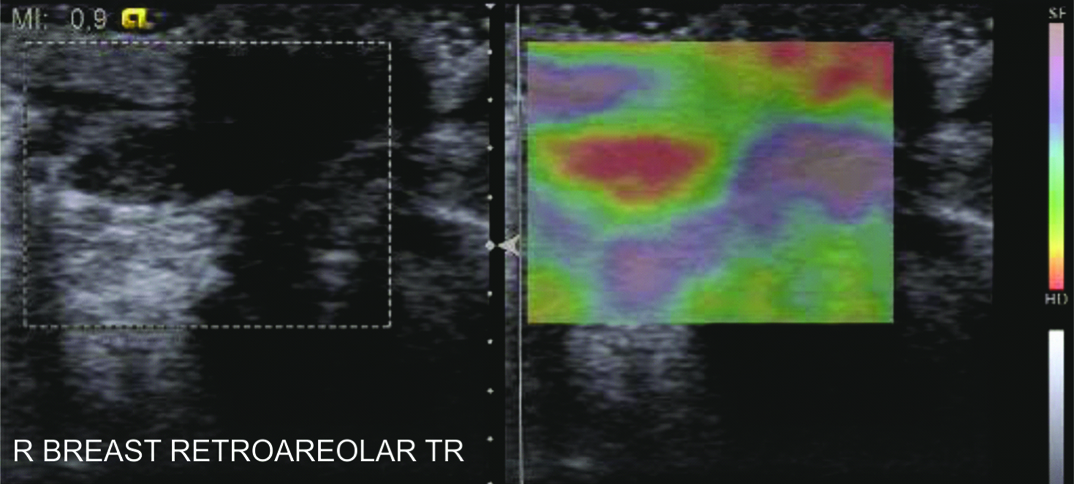
Intraductal papilloma. Ultrasound revealed a focally dilated duct in the retroareolar region with an intraductal solid echogenic mass. On the elastogram, this lesion was found to have an Elastography Score of 3.
A score of 4 indicated no strain in the entire hypoechoic lesion (the entire lesion was red but its surrounding area was not included).
A score of 5 indicated no strain in the entire hypoechoic lesion or surrounding area (both the entire hypoechoic lesion and the surrounding area were red) [Table/Fig-1b].
Strain ratio
On a representative static image, relative strain values of the mass and fat were measured. The Region of Interest (ROI) for the fat strain was drawn into an elliptical shape and placed in the fat tissue at a depth similar to, or as close as the depth of the target mass as possible, to avoid the pressure decay with depth. The ROI for the mass strain was adjusted within the mass contours [13]. Care was taken that both regions of interest were of the same size [Table/Fig-1c].
The strain ratio defined as the fat to mass strain ratio was automatically calculated by the embedded software program in the ultrasound unit.
Ratio of Size Compared to B-Mode Imaging
Each lesion was measured in the same position on both the elastogram and B-mode image. Size ratios were computed for each lesion.
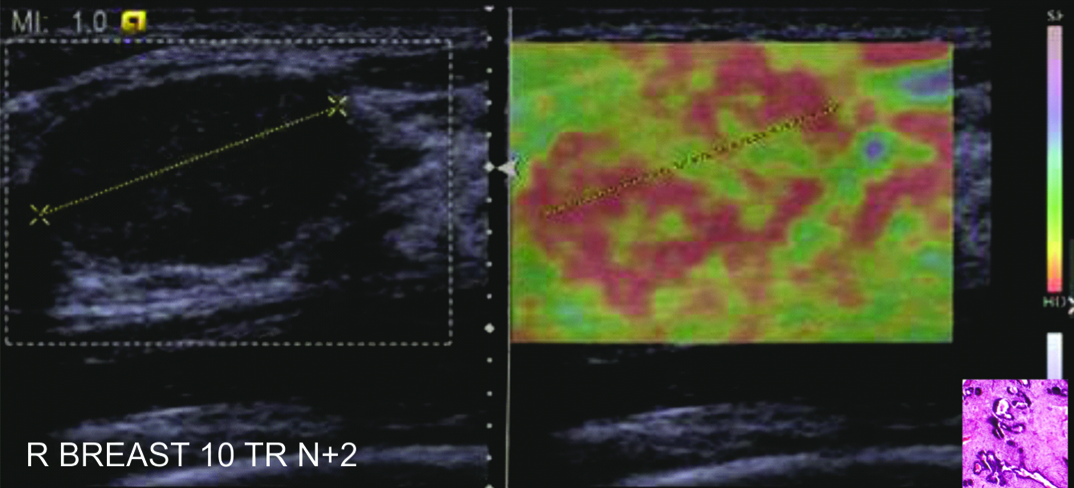
To calculate the distance ratio the longest lesion dimension was manually measured on both the elastogram and the corresponding B mode image. The corresponding elasticity image to B mode ratio (E/B ratio) was calculated [Table/ Fig-1d].
To calculate the area ratio the area of the lesion was measured on the elastogram and the corresponding B mode image using the automated border detection and measurement incorporated in the machine. The area ratio was then automatically calculated by an embedded software program in the ultrasound unit [Table/Fig-1e].
Pathological Diagnosis
In all 100 cases included in the study diagnosis was established by FNAC, ultrasound guided core-needle biopsy, surgical biopsy, or both. Surgical excision was recommended for all malignant lesions. FNAC results were accepted as definitive only in those lesions that had concordant imaging and cytological features of benignity. For 52 benign lesions with sonographic and cytological concordance, sonographic follow-up was performed after 6 months. Surgical excision was also performed in 7 benign lesions with non concordant sonographic and cytologic findings.16 benign lesions were surgically excised as per patient or physician preference.
Statistical Analysis
To evaluate the differences between benign and malignant masses on sonographic elastography, the four interpretation criteria were compared relative to the pathologic diagnosis by the Student t-test. The final BI-RADS categories were correlated with pathology.
The diagnostic performance of the interpretation criteria was compared with that of conventional sonography by the area under the receiver operating characteristic curve. Statistically significant differences between the areas under the receiver operating curve were reported as 95% confidence intervals. Statistical analysis was performed with SPSS version 18.0 software for Windows. p<0.05 was considered statistically significant.
The best cut-off point for each of the interpretation criteria was defined as the value at which the maximal sum of sensitivity and specificity was achieved. This was calculated using the MedCalc version 10.1 software for Windows (MedCalc Software, Mariakerke, Belgium). Using the best cut-off point thus obtained, the sensitivity and specificity of each of the four interpretation criteria was calculated.
Finally, the elastography score for sonographic elastography was correlated with the BI-RADS categories for conventional sonography.
Results
Among the 100 breast lesions analysed, 75 were diagnosed as benign, and 25 were diagnosed as malignant on pathological analysis. The final pathological diagnosis is shown in [Table/Fig-4]. The age distribution of the benign and malignant lesions is shown in [Table/Fig-5].
| Benign | |
| Fibroadenoma | 44 |
| Fibrocystic change | 23 |
| Infected fibrocystic change | 3 |
| Benign Phylloides Tumour | 2 |
| Hematoma | 1 |
| Intraductal papilloma | 1 |
| Mastitis (Granulomatous) | 1 |
| Total | 75 |
| Malignant | |
| Infiltrating ductal carcinoma | 21 |
| Invasive lobular carcinoma | 1 |
| Intracystic papillary carcinoma | 1 |
| Ductal carcinoma in situ | 2 |
| Total | 25 |
Age distribution of benign and malignant lesions.
| Age(years) | Pathology | Total |
|---|
| Benign | Malignant |
|---|
| 15-30 | 14 | 0 | 14 |
| 30-45 | 26 | 3 | 29 |
| 45-60 | 29 | 14 | 43 |
| 60-75 | 6 | 7 | 13 |
| 75-90 | 0 | 0 | 0 |
| 90+ | 0 | 1 | 1 |
| Total | 75 | 25 | 100 |
Correlation of Conventional Ultrasound (BI-RADS) with Pathology Results
The final BI-RADS categories were as follows:
Category 3: 54 lesions (all benign);
Category 4A: 16 lesions (15 benign, 1 malignant);
Category 4B: 6 lesions (4 benign and 2 malignant);
Category 4C: 6 lesions (1 benign and 5 malignant);
Category 5: 18 lesions (17 malignant and 1 benign)
With a conventional cut-off between BI-RADS categories 3 and 4A, the sensitivity, specificity, positive predictive value (PPV) negative predictive value (NPV) and accuracy were 100% (25/25), 70.66% (53/75), 53.19% (25/47), 100% (53/53) and 78% (78/100) respectively [Table/Fig-6].
Correlation of sonography with sonoelastography
| Modality | Sensitivity | Specificity | PPV | NPV | Accuracy |
|---|
| Sonography (B-Mode)* | 100 | 70.66 | 53.19 | 100 | 78 |
| Sonography (B-Mode)† | 96.15 | 92.10 | 80.64 | 98.14 | 95 |
| Sonoelastography‡ | 100 | 82.66 | 65.78 | 100 | 87 |
*With malignant as BI-RADS 4A, 4B, 4C, and 5 and benign as BI-RADS 2 and 3.
†With malignant as BI-RADS 4B, 4C and 5 and benign as BI-RADS 2, 3 and 4A
‡Using Elastography score with a score of 1, 2, and 3 as benign and a score of 4, 5 as malignant
Interpretation Criteria for Elastography
Correlation of Elastography score with pathological diagnosis
The mean elastography score was significantly higher for malignant lesions (4.97 ± 0.27) than for benign lesions. (2.93 ± 1.04) (p<0.001).
Of the 25 malignant lesions, all had a score of 4 or 5. None of these lesions had a score of 1-3.
Of the 75 benign lesions, 29 had a score of 1 or 2 and 33 had a score of 3.
12 of the 35 lesions with a score of 5, and 1 of the 3 lesions with a score of 4 were benign.
Correlation of size ratio with pathology
For the 75 benign masses, the mean strain ratio ± SD was 3.87 ± 3.52. For the 25 malignant masses the mean strain ratio was 8.99 ± 5.34. The strain ratios for the malignant masses were significantly greater than those of the benign masses (p<0.001).
Distance ratios of the target lesions
The mean distance ratio of the benign lesions was 1.02 ± 0.25. The mean distance ratio of the malignant lesions was 1.13 ± 0.36.
Area ratios of the target lesions
For the 75 benign lesions, the mean area ratio was 1.11 ± 0.66. For the 25 malignant lesions, the mean area ratio was 1.71 ± 0.86. The mean distance as well as area ratios of the malignant lesions were significantly higher than that of the benign lesions (p<0.001).
The diagnostic performance of the interpretation criteria for elastography
The diagnostic performance of the interpretation criteria for elastography is shown in [Table/Fig-7].
Diagnostic performance of elastography score, strain ratio, distance ratio and area ratio at various cut off points.
| Cut off point | Sensitivity% | Specificity% |
|---|
| Elastography Score |
| Between 1 and 2 | 100 | 1.33 |
| Between 2 and 3 | 100 | 33.33 |
| Between 3 and 4 | 100 | 82.66 |
| Between 4 and 5 | 92 | 84 |
| Strain ratio |
| 1.82 | 100 | 29.3 |
| 1.9 | 96 | 30.67 |
| 4.35 | 96 | 70.6 |
| 4.72 | 92 | 74.6 |
| 4.85 | 84 | 76 |
| 6.2 | 60 | 85.3 |
| Distance ratio |
| 0.89 | 96 | 21.33 |
| 1 | 92 | 65.33 |
| 1.12 | 88 | 80 |
| 1.19 | 84 | 85.33 |
| 1.2 | 80 | 88 |
| 1.4 | 32 | 92 |
| Area ratio |
| 0.7 | 100 | 20 |
| 0.84 | 96 | 38.6 |
| 1.03 | 92 | 64 |
| 1.14 | 80 | 68 |
| 1.2 | 72 | 76 |
| 1.4 | 48 | 82.67 |
The optimal cut-off point was considered as one which obtained the maximum value of the sum of sensitivity and specificity.
A cut-off point between elasticity scores of 3 and 4 resulted in the best differentiation between benign and malignant masses with a sensitivity of 100% and a specificity of 82.66%. A strain ratio cut off point of 4.72 enabled the best differentiation between benign and malignant masses. With a best cut off point calculated to be 1.19, the distance ratio yielded a sensitivity of 84% and a specificity of 85.33%. With regards to area ratio the best cut-off point was calculated to be 1.03, with a sensitivity of 92% and specificity 64%.
The elastography score was found to have the best performance among the 4 criteria used, followed by the strain ratio. Among the size ratio measurements the area under the curve for the distance ratio was found to be more accurate than the area ratio.
The best cut-off point for conventional sonography was between BI-RADS categories 4A and 4B.
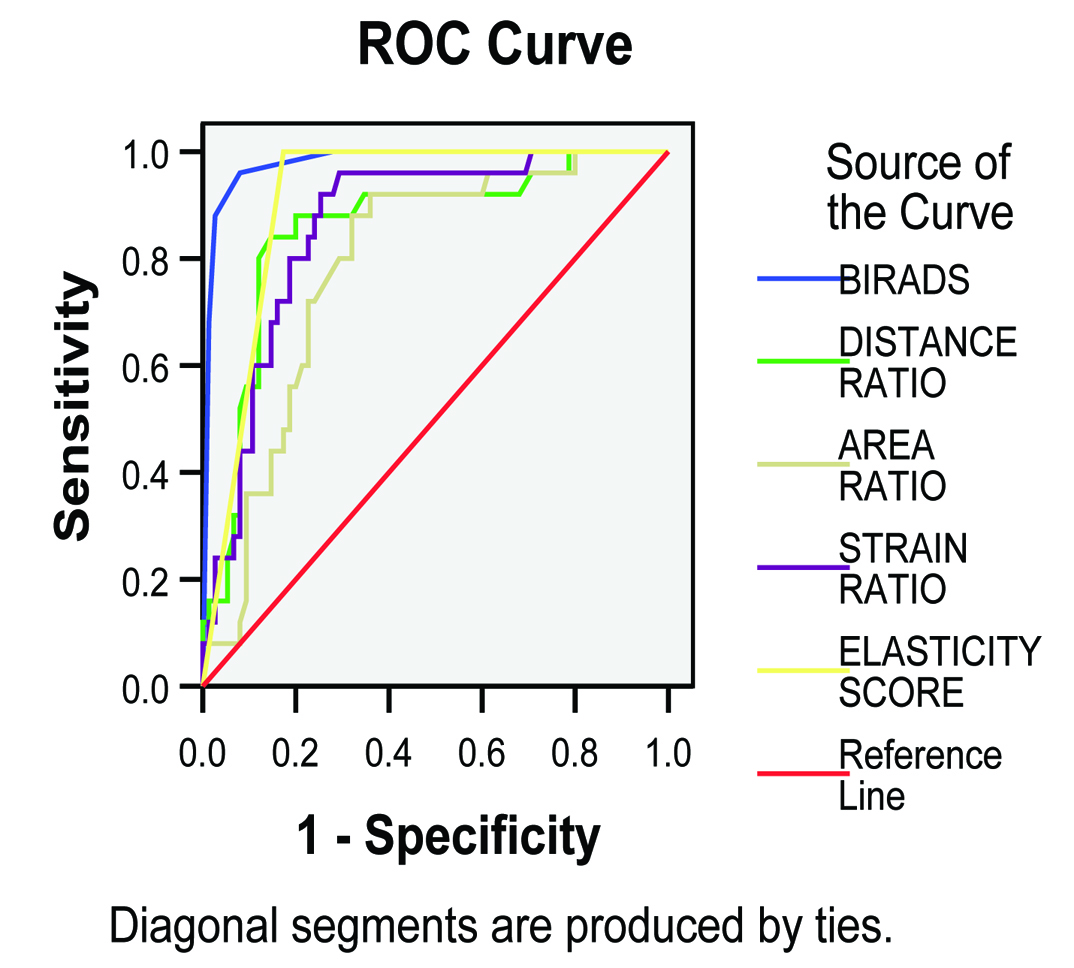
In the receiver operating characteristic curve analysis, the area under the curve value was slightly greater for conventional sonography (0.980) than for the elastography score (0.913). These differences were found to be statistically significant [Table/Fig-8].
Receiver operating characteristic curve analysis.
The area under the receiver operating characteristic curve (Az) values were 0.980 (95% confidence interval [CI], 0.955-1.005) for BI-RADS 0.913 (95% CI, 0.858-0.968) for elastography score 0.862 (95% CI,0.786-0.939) for the strain ratio 0.856 (95% CI, 0.767-0.945) for the distance ratio and 0.788(95% CI , 0.693-0.883) for the area ratio respectively
Discussion
Interpretation Criteria for Sonoelastography
Over the past decade, research has been ongoing to discover the potential of elastography to further improve the accuracy of conventional sonography. Various criteria have been studied to analyse elastography images and thereby characterize lesions based on their strain imaging characteristics. It is essential that criteria used for evaluation be accurate, while at the same time simple to perform so as to enable their incorporation into routine clinical practice.
Itoh et al., conducted a landmark study in 2004 wherein a new 5 point scoring system was suggested [9]. This Tsukuba elasticity score has yielded reproducible results in multiple studies [9,12,14–17].
Strain ratio was introduced in an attempt to semiquantitate the measurements and was found to provide an objective quantification of strain within a lesion compared to that of the surrounding normal tissue [10,13,16,18,19]. Yerli et al., presented a study of 78 lesions to evaluate if the combination of elastography score and strain ratio was useful in the differentiation of benign from malignant lesions [20]. They concluded that after the evaluation of lesions with the 5 point elasticity scoring, additional evaluation of the strain index increases calculation time and did not contribute to the differentiation between benign and malignant lesions.
Work by Barr et al., and others has proved that benign and malignant lesions may be distinguished by differences in the size of the lesion on B mode and elastography images [12,21–23].
Jung et al., evaluated size ratio, strain ratio and elastography score and concluded that strain ratio showed the best diagnostic performance among these criteria [16]. In this study, we compared 4 interpretation criteria for elastography, i.e. elastography score, strain ratio, distance ratio and area ratio. To the best of our knowledge, no previous study has compared all these four criteria simultaneously.
The results of our study prove that each of these criteria is able to differentiate benign and malignant lesions with statistical significance. Using the receiver operating characteristic curve analysis the elastography score was shown to have the best diagnostic performance among these 4 criteria.
Comparison of Conventional Sonography versus Sonographic Elastography
B-mode sonography is a non invasive and cost-effective method for initial evaluation of suspected breast lesions. The location, number and morphology of the lesions can be determined with great accuracy by using B-mode sonography.
This study results showed an excellent value for sensitivity (100%) with conventional sonography. Furthermore, our study showed better specificity for sonographic elastography than conventional sonography, with a specificity of 82.66% when the cut-off point was between 3 and 4. These results corroborate those of other studies [12–14,17,18,24]. Thus, elastography in conjunction with conventional sonography does have potential to improve diagnostic accuracy.
We found the best cut off point for conventional sonography was between BI-RADS 4A and 4B considering BI-RADS 4A as benign, with BIRADS 4B and 4C as malignant. At this cut-off, the area under the receiver operating characteristic curve value was slightly greater for conventional sonography (0.980) than for the elastography score (0.913). These differences were found to be statistically significant [Table/Fig-8].
Correlation of BI - RADS with Elastography Score
In this study, 15 of the 16 BI-RADS 4A lesions (93.75%) were benign. Based on the elasticity score, 8 of these 16 lesions (50%) were prospectively assigned a score of 2 (n=2) or 3 (n=6) indicating benign tissue. All 4A lesions with elastography scores of 2 or 3 were found to be benign. Thus, these results corroborate those of other researchers [13–16,24,25] that this group of low suspicion lesions may be the area where elastography has the most beneficial role. BI-RADS 4A designate lesions with a low suspicion for malignancy in which a benign pathological diagnosis is expected and would be considered concordant. Strain characteristics with a high likelihood of benignity could allow interpretation of BI-RADS 4A lesions as either BI-RADS 3 or even 2.
Of particular note, the one BI- RADS 4A lesion subsequently found to be malignant was prospectively assigned a score of 5 thus raising confidence level in the diagnostic performance of this technique [Table/Fig-1].
There were 6 prospectively assigned BI-RADS 4B lesions, of which 4 were found to be benign. In this benign group, one lesion had a score of 2, one lesion had a score of 3 and the remaining 2 lesions had scores of 5.
Of these 2 BI-RADS 4b lesions with elastography score of 5, one was found to be an organising hematoma; the second was a fibroadenoma in dense fibroglandular tissue. In retrospect, these two benign lesions are inherently stiffer as compared to normal breast parenchyma, one of the limitations of elastography [Table/Fig-9].
Ultrasound showed a hypoechoic region which was interpreted as Elastography score 5. Trucut biopsy revealed an area of fibrocystic change. In retrospect, as the elastic properties of the fibrocystic change and the adjacent fibroglandular breast tissue are similar, the two appear as a single lesion on the elasticity image. Thus, it is important to analyze the tissue composition on B mode and correlate with the elastogram.
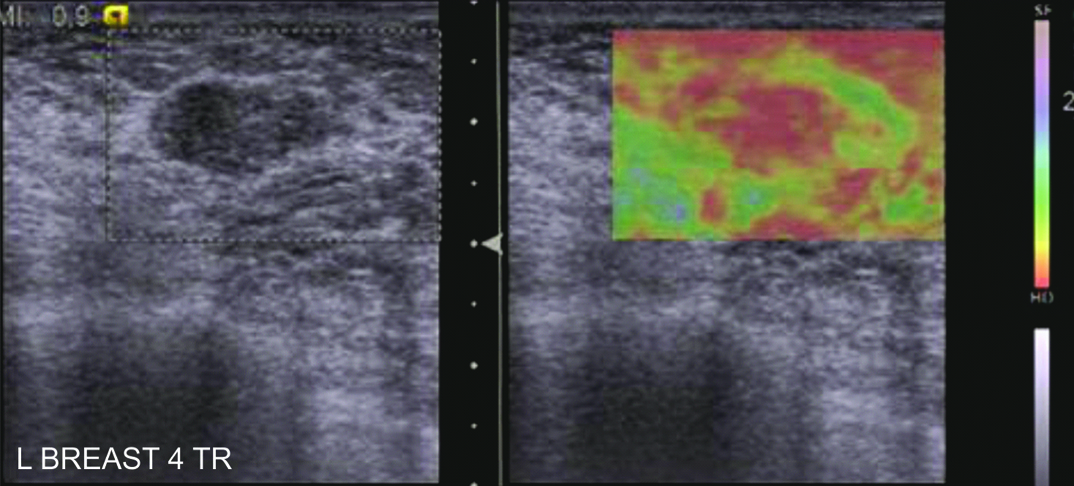
Fibroadenoma in a 36 year old lady. Ultrasound revealed a hypoechoic lesion with an ill defined margin interpreted as BI- RADS 4A. The elastography image was obtained with excessive precompression (as shown by the red colour of the subcutaneous fat), giving a misleading impression of Elastography Score 5.
There were 6 BI-RADS 4C lesions of which 5 were found to be malignant. The one benign lesion was assigned a score of 5 and was subsequently found to be an involuting fibroadenoma. This lesion was however correctly diagnosed on mammography, thus emphasizing the need for correlation with standard modalities.
On the basis of clinical presentation and BI-RADS imaging, 100 lesions were subjected to FNAC/ biopsy. There was a 25% positive biopsy rate. If all lesions with elastography scores 1 and 2 were followed –up, 29 biopsies would have been avoided while at the same time not missing any malignancy. Thus by improving specificity elastography has potential to decrease the number of invasive diagnostic procedures.
The addition of elastography to BI-RADS may be able to upgrade or downgrade BI-RADS category 3 and 4A lesions, improving the selection of patients for biopsy, however larger studies would be needed to validate results.
Limitation
One of the main limitations of this study is that the acquisition of elastograms as well as analysis is observer dependent. The magnitude of initial compression could affect the elasticity map. Hence inter and intraobserver variability is another factor which needs to be studied.
Future research and further technical advances including the creation of feedback to assess the amount of precompression, will ultimately determine the usefulness of elastography in clinical practice.
Conclusion
Among the four interpretation criteria used for interpretation of elastography images, elastography score was found to be the most useful. Our results corroborate those of other studies, that elastography has the potential to improve the specificity of ultrasound and if validated by larger studies may allow interpretation of BI–RADS 4A lesions as BI-RADS 3, thus improving specificity and avoiding unnecessary biopsy.