Diabetic Macular Oedema (DME) is the leading cause of legal blindness throughout the world [1–3]. It has been attributed to the microvascular theory [4,5]. This theory suggests increased capillary permeability and a breakdown of the blood retinal barrier in diabetic patients as the cause of macular oedema [2–4]. The current treatment option for varying grades of Diabetic Retinopathy (DR) and DME consists mainly of photocoagulation which destroys the diseased tissue so that unaffected retinal areas can be saved [1,4]. Much before the onset of microvascular changes, functional changes occur in a diabetic retina [5,6]. Various studies using electroretinography, colour vision, contrast sensitivity and dark adaptation have concluded that neuronal loss occurs much earlier than microvascular abnormailities [7–9]. Any loss of neuronal tissue will lead to a decrease in retinal thickness [10]. Optical Coherence Tomography (OCT) is the most precise method to measure retinal thickness in vivo [5,11]. It is an advantageous tool which helps in acquiring data at high speed, reconstructs in a three dimensional formal and shows the different retinal layers [5]. Fourier domain OCT provides high resolution (5μ) images and a higher scan rate [11]. The RTVue-100 OCT (Optovue, Inc., Fremont, CA) is one of the new commercially available Fourier-domain OCT instruments. The study was undertaken to map the retinal nerve fibre layer thickness variation in patients with Type II Diabetes Mellitus (DM), and compare them with age matched healthy controls.
Materials and Methods
Three hundred and thirty eyes of 165 patients attending the Ophthalmology outpatient department of a tertiary hospital over a period of 12 months (November 2011 – October 2012) were included in the study after obtaining written and informed consent. Patients were divided into 3 groups; 58 diabetic patients without DR, 57 diabetic patients with DR and 50 normal healthy subjects.
Inclusion criteria consisted of normal healthy subjects, type II diabetic patients without DR (Non DR Group) and with mild to moderate non proliferative DR (DR Group) [12]. Exclusion criteria consisted of patients with a history of Type I DM, DME, proliferative DR, pre-existing glaucoma, intraocular inflammation, optic nerve pathology, vitreous haemorrhage, previous retinal laser treatment, previous intraocular surgery/ procedure, media opacities such as dense cataracts, corneal opacities and uncooperative patients. Prior approval from Ethical Committee was also obtained.
All patients underwent detail Ophthalmological examination according to preset format. Intraocular pressure was recorded using Goldmann applanation tonometer. Optovue RTVue 100 three dimensional fourier domain OCT was used for scanning in all subjects. OCT scan was performed by a single person. Both eyes of all subjects underwent following scans after dilatation of pupil:
Enhanced Macular Map 5 (EMM5),
Optic Nerve Head (ONH) scan and
Ganglion Cell Complex (GCC) scan.
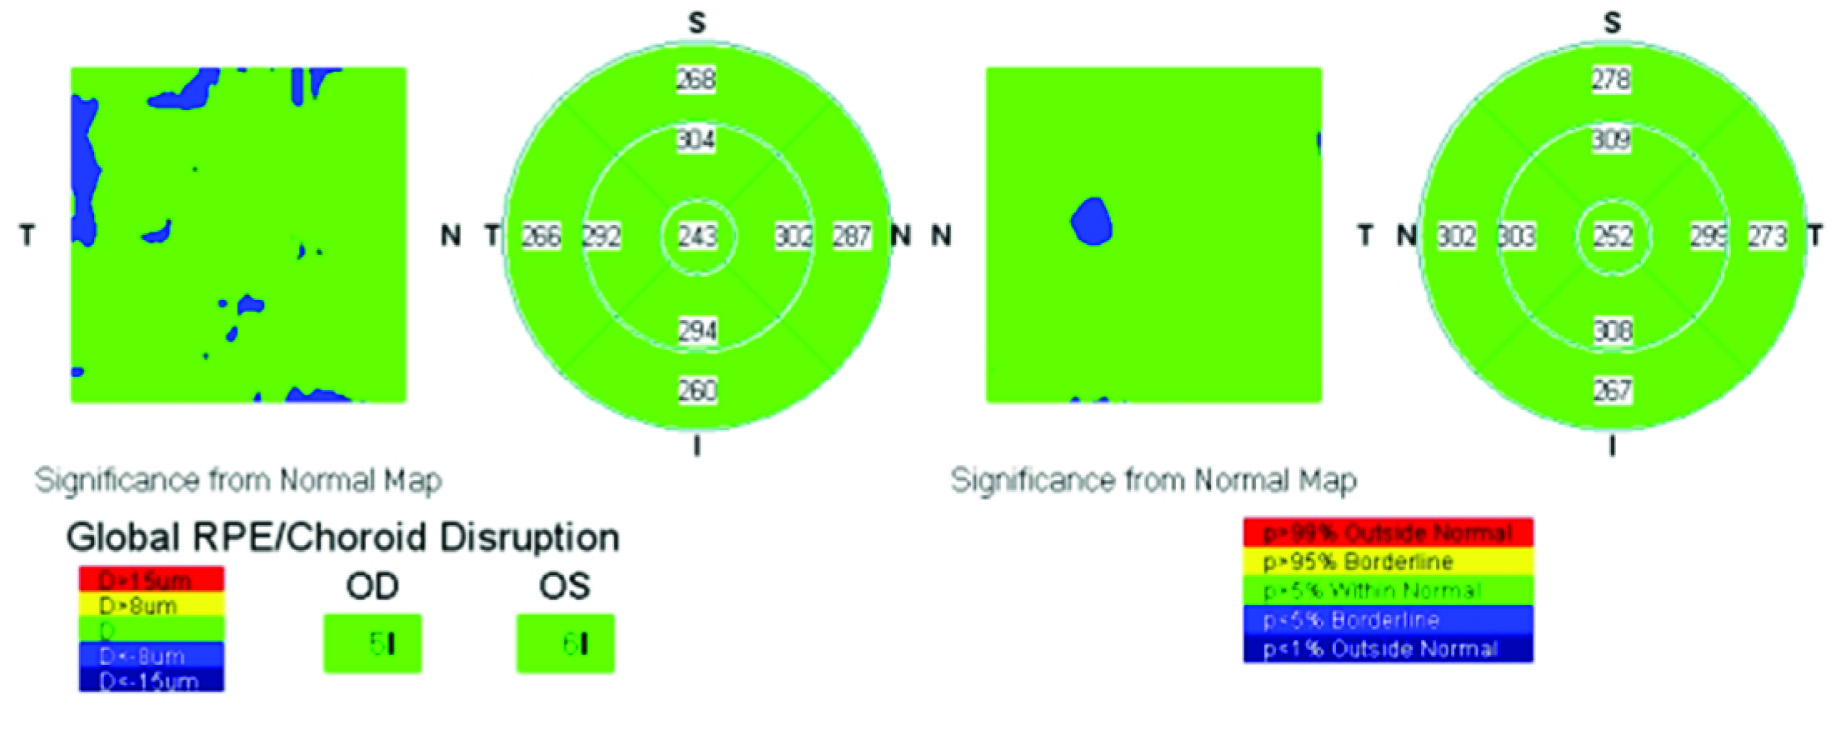
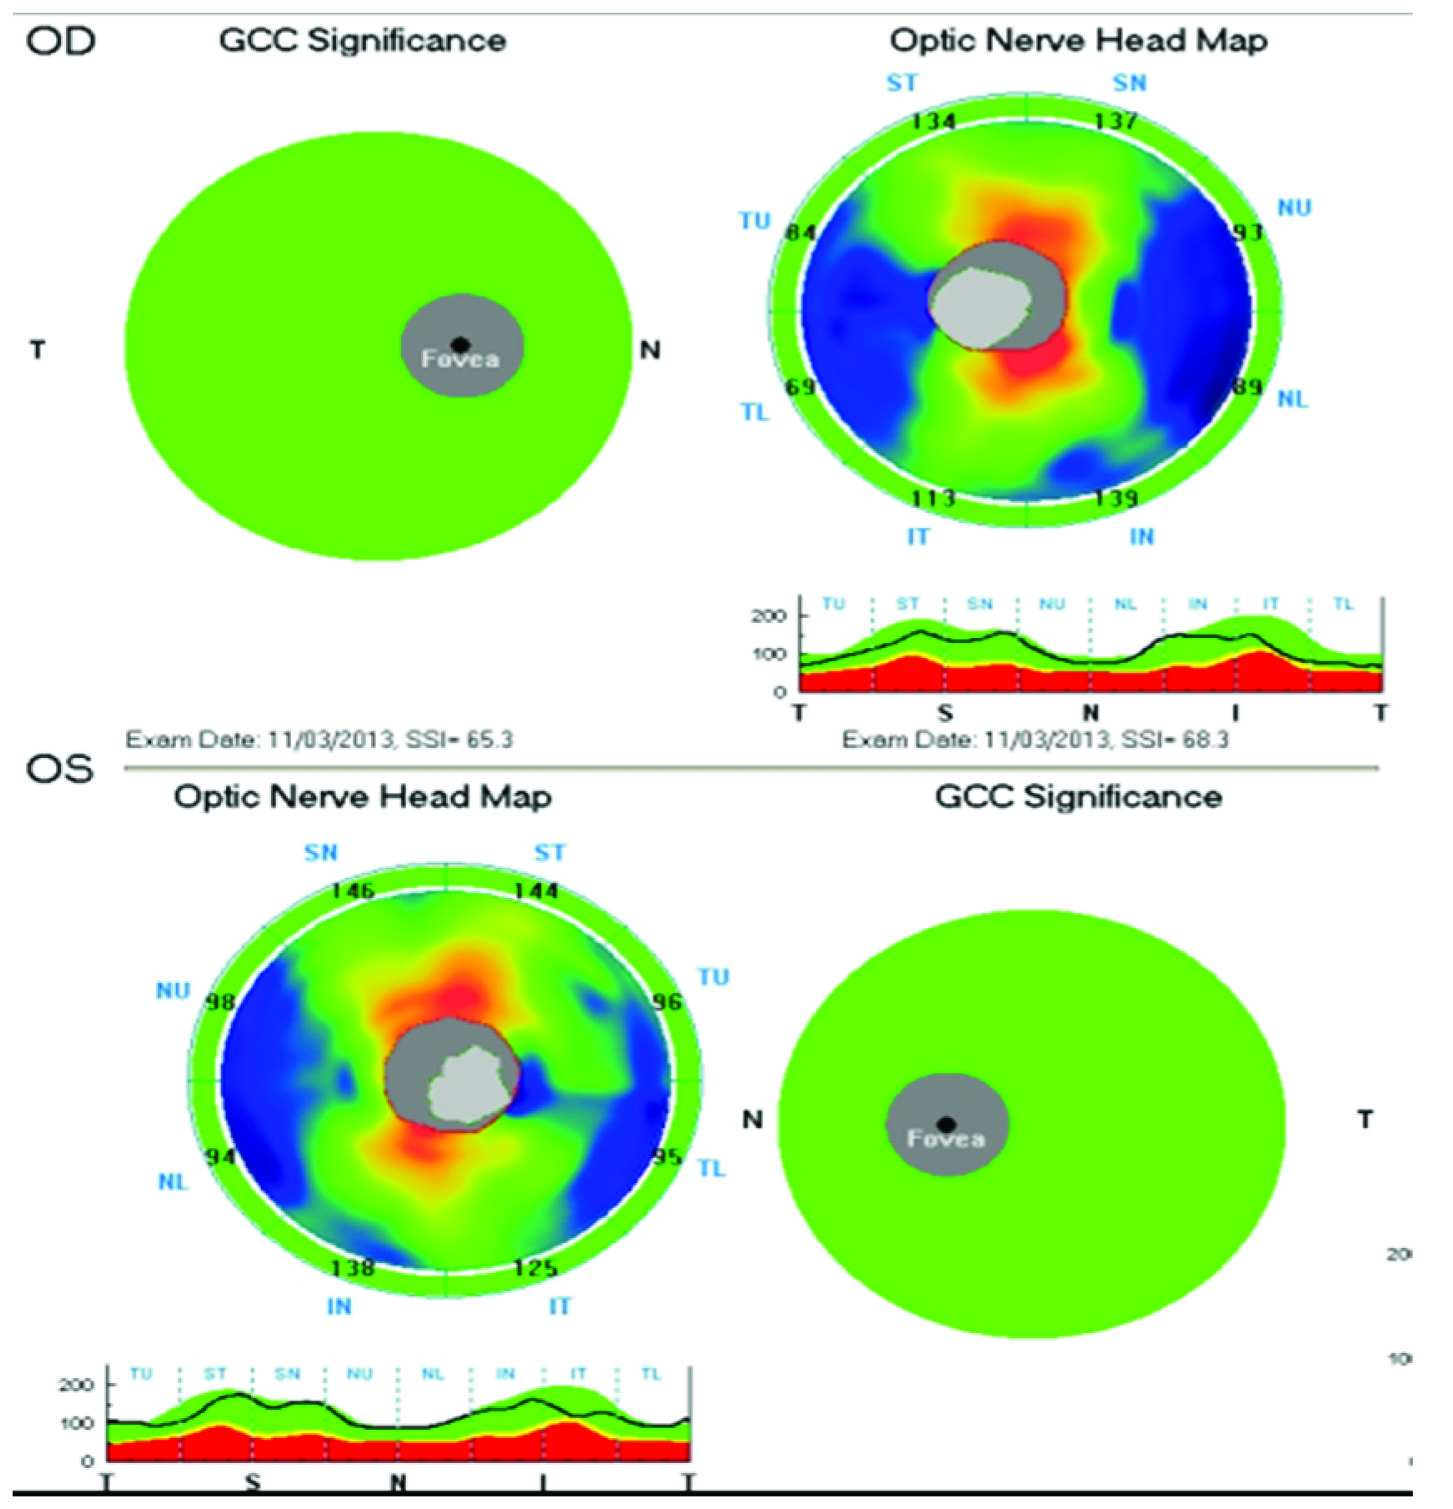
EMM5 scan [Table/Fig-1] was used to measure the foveal thickness and the parafoveal thickness in superior, inferior, nasal and temporal quadrants. It consisted of a dense grid scan in a 6x 6mm area of central macula. RNFL thickness was measured using the ONH protocol which utilizes 3.45mm diameter circle centered around the optic nerve head [Table/Fig-2]. This scan consisted of 13 circular scans with diameter ranging from 1.3- 4.9mm and 12 radial lines with 3.7mm length. RNFL analysis was done in 8 sectors namely Superotemporal (ST), Superonasal (SN), Inferotemporal (IT), Inferonasal (IN), Nasal Upper (NU), Nasal Lower (NL), Temporal Upper (TU), and Temporal Lower (TL). The GCC scan is centered 1 mm temporal to the foveal center and consists of 15 vertical line scans covering a 7mm square region.
EMM5 scan and parafoveal thickness scan on OCT in normal patient The MM5 covers a 5-mm–grid area. The analysis program can be used on the MM5 to generate retinal thickness data.
ONH scan on OCT:RNFL and GCC scan of normal patient showing correlated results.
Metabolic control of diabetes was assessed using reports of glycosylated haemoglobin (HbA1c) and serum creatinine available with the patient at the time of examination. HbA1c was measured by high performance liquid chromatography method using the Biorad D 10 machine and serum creatinine was measured by alkaline picrate method using the Unicel DXC 800 instrument.
Statistical Analysis
Interpretation and analysis of obtained results was carried out by using Statistical Package for Social Sciences version 17(SPSS, Inc., Chicago, IL) software. Statistical analysis of continuous variables was done using the Students t-test. One-way ANOVA, Post-hoc tests were applied and a p-value <0.05 was considered significant. Pearsons’ correlation of coefficient was calculated for other variables.
Results
There were 101 males (61.21%) and 64 females (38.79 %) with a male: female ratio of 1.58:1. All groups consisted of predominantly males. Out of 165 patients enrolled in the study, 115 (69.69%) were diabetic patients in both Non DR and DR Group. The mean age of normal healthy subjects was 45.4±7.96 years. [Table/Fig-3] shows the baseline characteristics of diabetic patients in both groups. [Table/Fig-4] shows the RNFL in 8 sectors, in the study groups. RNFL was found to be thinner in diabetic patients in both groups when compared to normal healthy subjects, however, it was significant only in the ST (p-value = 0.001) and NU (p-value = 0.031) sectors.
Baseline characteristics of the diabetic patients.
| Baseline Characteristics | Diabetic patients |
|---|
| Non DR Group | DR Group |
|---|
| Mean age | 51.16±9.49 years | 55.10±9.06years |
| Duration of DM | 3.60±4.28 years | 9.74±6.51 years |
| Insulin | 8 | 11 |
| OHA | 44 | 46 |
| Lifestyle/ Alternative Medicine | 6 | None |
| HbA1c (%) | 8.87±2.14 | 9.51±1.95 |
| Creatinine (mg/dl) | 0.82±0.37 | 1.48±1.62 |
Comparison of Retinal Nerve Fibre Layer in the study subjects.
| RNFL thickness | Normal subjects (n=100 eyes) | Diabetic patients | p-value |
|---|
| Non DR Group(n=116 eyes) | DR Group (n=114 eyes) |
|---|
| ST | 133.54±16.61 | 131.8±19.51 | 124.50±23.04 | 0.001 |
| SN | 118.28±24.89 | 118.73±23.89 | 113.00±20.04 | 0.089 |
| IT | 143.14±22.34 | 139.8±23.14 | 136.15±27.22 | 0.107 |
| IN | 136.56±26.43 | 133.50±27.17 | 129.97±32.46 | 0.240 |
| NU | 90.56±11.91 | 86.83±14.47 | 81.07±20.31 | 0.031 |
| NL | 80.71±10.58 | 79.93±12.45 | 78.25±20.87 | 0.403 |
| TU | 85.37±15.56 | 83.01±14.70 | 82.96±21.82 | 0.475 |
| TL | 84.99±16.78 | 82.59±16.78 | 82.53±18.15 | 0.467 |
On performing OCT for measuring the foveal thickness, all the patients had a normal foveal contour. Mean foveal thickness was found to be thickest in DR Group (246.26±32.47μ) in comparison to Non DR Group (236.35±24.11μ) and normal healthy subjects (233.53±20.40μ) [Table/Fig-5]. Statistically significant (p-value = 0.001) increment in mean foveal thickness was noted on using one-way ANOVA. Comparison between Non DR and DR group was performed using post-hoc test. Significant increment in foveal thickness was noted in patients of DR Group when compared to patients of Non DR Group (p-value < 0.05) and normal healthy subjects (p-value < 0.05).
Comparison of foveal and parafoveal thickness among the study subjects.
| Retinal thickness parameters | Quadrant | Normal subjects (n=100 eyes) | Diabetic patients | p-value |
|---|
| Non DR Group(n=116 eyes) | DR Group (n=114 eyes) |
|---|
| Foveal thickness | | 233.53±20.40 | 236.35±24.11 | 246.26±32.47 | 0.001 |
| Parafoveal thickness | Superior | 314.28±12.69 | 307.57±24.41 | 307.27±28.11 | 0.039 |
| Inferior | 310.93±17.46 | 302.83±22.40 | 300.42±24.90 | 0.001 |
| Nasal | 315.97±16.87 | 308.56±20.42 | 305.65±23.88 | 0.001 |
| Temporal | 300.8±16.51 | 291.77±23.37 | 294.72±29.42 | 0.008 |
| GCC | | 96.63±6.03 | 94.46±6.97 | 93.23±11.41 | 0.010 |
The foveal thickness in males was significantly greater than in females in all the three groups (p-value = 0.001). On comparison of foveal thickness between the three groups using one-way ANOVA, significant increase was found in males (p-value = 0.000) and in females (p-value = 0.016) with DR.
The mean parafoveal thickness was maximum in superior quadrant in all the groups [Table/Fig-5]. All the four parafoveal quadrants showed a significant thinning in Non DR group and DR Group (p-value = 0.039, 0.001, 0.001 and 0.008 respectively) when compared to normal healthy subjects. GCC showed significant thinning when compared in the three groups (p-value = 0.010) by using one-way ANOVA. Significant thinning of GCC was noted in patients of DR Group on comparing it with normal healthy subjects when post-hoc analysis was performed (p-value <0.05). Pearson’s coefficient of correlation showed a weak negative correlation between duration of diabetes and RNFL and GCC (R-value = -0.11, -0.02 respectively).
Metabolic control was worse in patients with DR. Pearson’s coefficient of correlation was calculated to assess the relationship between RNFL thickness and parameters of metabolic control. No correlation was seen between RNFL thickness and HbA1c. Mean Creatinine levels showed a weak negative (-0.14) correlation.
Discussion
Psychophysical and functional visual tests have demonstrated retinal dysfuction before onset of clinically evident retinal vascular changes [7–9]. Clinical evidence shows that in diabetic patients without DR, there is reduced contrast senstivity including impaired mesopic foveal contrast sensitivity [13]. In addition, the implicit time of first and second order multifocal electroretinogram is delayed in diabetic patient with no DR and amplitudes are decreased in second order component [14].
The importance of neurodegeneration in retinal diseases such as glaucoma and retinitis pigmentosa is well known. However, the effect of neurodegeneration in diabetes mellitus has largely been overlooked. In diabetes, thinning of RNFL can occur in the absence of glaucoma and other optic nerve diseases. Increased apoptosis, glial cell reactivity, microglial and altered glutamate mechanism are some neurodegenerative changes that have been proposed to occur in DR [4]. GCC, which consists of inner plexiform layer, ganglion cell layer and RNFL has shown to be valuable in detection of glaucoma as it is directly influenced by the glaucomatous damage [15]. Objective assessment of GCC finds importance in DR as its evaluation will help in detection of inner retinal loss associated with the disease and help in developing neuroprotective therapeutic regimens [16]. Therefore, it is of utmost importance for us to study the neurodegenerative component of DR so that in future, a preventive rather than interventional approach can be applied in its treatment.
In the present study, RNFL thickness was measured and compared among normal subjects, diabetic patients with and without DR. RNFL thinning was noted in both diabetic groups. Thinning was statistically significant in the ST quadrant in diabetic patients both in non DR and DR group and NU quadrant in comparison with normal control group. Current study is in accordance with other studies [17–20]. Superior RNFL loss in diabetic retina has been attributed to lower perfusion in superior retina and the ONH which may cause greater ischemia leading to structural damage to the ganglion cells superiorly [17].
Eyes with retinopathy showed a statistically significant increase in the mean foveal thickness when compared with normal subjects and in eyes without DR even in absence of DME. Oshitari T et al., in their study showed that foveal thickness was significantly higher in DR group than no DR group which is also seen in our study. They however reported a lower foveal thickness lower in patients with no DR when compared to controls which is contradictory to our findings [18]. Studies by others, however, are in concordance with the current study [17,21,22]. An increase in vascular permeability of diabetic retinas and longer duration of DM in the DR group has been implicated as a cause for increasing foveal thickness [15].
In all the groups, the mean foveal thickness was significantly higher in males when compared to females. Significant increment in foveal thickness was noted on comparison between normal subjects and no DR group, and no DR group and DR group. This finding is supported by Oshitari T et al., wherein they found a higher macular thickness in males as compared to females in normal eyes, eyes with no DR and eyes with DR. This suggests that retinas of women are more sensitive to the effects of diabetes than men [18].
Significant GCC thinning was noted in eyes with no DR and with DR. Similar result was seen in study conducted by Rodrigues et al., [20]. In the study conducted by Demir et al., though the GCC was thinner in diabetic subjects this thinning was not statistically significant in contrast to our study where the thinning was significant statistically [19]. Exact mechanisms for inner retinal loss are not clear but have been implicated to lower perfusion and higher metabolic demands of the inner retina which make it more vulnerable to the metabolic stress induced by diabetes [23].
Eyes with no DR showed a linear correlation between mean HbA1c and mean RNFL. Oshitari T et al., showed a weak negative correlation between the two [18]. Levels of mean creatinine showed a weak negative correlation with mean RNFL thickness suggesting that RNFL thickness decreased with increasing creatinine levels. A recent conducted study shows similar results [24].
The study concluded that significant RNFL thinning occurred in the superior sectors of ONH in diabetic subjects with DR and RNFL thickness decreased with increasing duration of Diabetes. GCC thinning was also noted in eyes with DR. These factors contribute to the evidence for early neurodegenration in the retina. Foveal thickness increases even in absence of DME, with progression of DR due to increased vascular permeability.
Limitation
The limitation of the current study lies in the fact that it was a non randomised study. It was a cross-sectional, observational study design. The subjects included in the study were of North Indian origin, hence its application to the world population is limited. Lastly, only approximate duration of diabetes was known to many subjects.
Conclusion
The present study, however, benefits diabetic patients as it can assess the RNFL status of the patients soon as the patient is diagnosed with diabetes mellitus. This will help in monitoring the patient. As RNFL thinning in diabetes mellitus is independent of glaucomatous thinning, OCT will prove to be a useful tool in diagnosing early neurodegenerative changes in diabetic patients even before onset of diabetic retinopathy.